Why France and Italy?
The new research published in the Journal of International Money and Finance “What are the causal links between fiscal and external sustainability in the EU? New time-varying evidence” studies 27 EU countries over 2002Q1–2023Q4. The empirical strategy proceeds in two steps. First, the paper estimates time-varying fiscal and external sustainability coefficients: fiscal sustainability is proxied by the evolving relationship between government revenues and government expenditures, while external sustainability is proxied by the evolving relationship between exports and imports. Second, it uses recursive Granger-causality tests to identify when fiscal sustainability affects external sustainability, and when the reverse occurs.
France and Italy are useful cases because they are two large euro-area economies with different macroeconomic positions. France belongs to the paper’s core-country group, while Italy belongs to the peripheral euro-area group. This distinction matters: the paper shows that core countries tend to have higher external sustainability coefficients, while peripheral countries display lower average fiscal and external sustainability coefficients.
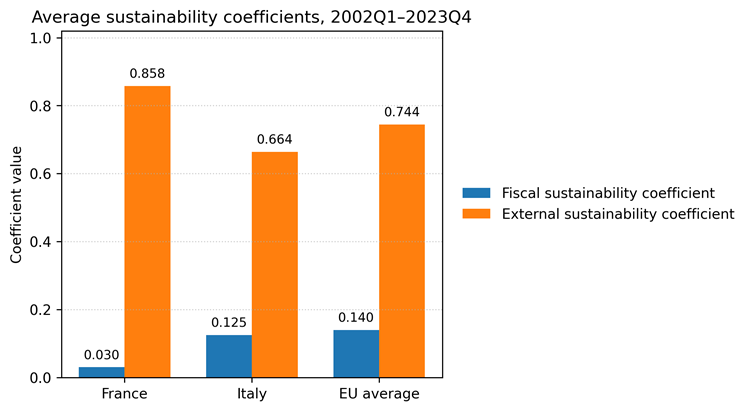
Figure 1. Average fiscal and external sustainability coefficients for France, Italy and the EU average, 2002Q1–2023Q4. Source: authors’ calculations from the accepted manuscript tables.
A first message is immediately visible in Figure 1. France has a very low average fiscal sustainability coefficient, 0.030, compared with 0.140 for the full sample. Yet its external sustainability coefficient, 0.858, is above the full-sample value of 0.744. Italy is different. Its fiscal coefficient, 0.125, is higher than France’s but still slightly below the EU average, while its external coefficient, 0.664, is below both France and the EU average.
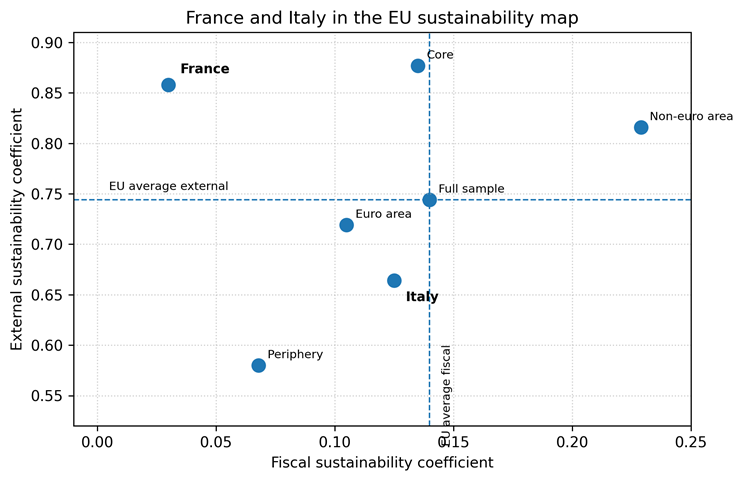
Figure 2. France and Italy in the fiscal–external sustainability map. Dashed reference lines mark the full-sample averages. Source: authors’ calculations from the accepted manuscript tables.
This mapping helps clarify the contrast. France is located in the low-fiscal/high-external quadrant. Italy is closer to the euro-area and peripheral pattern: more fiscal adjustment than France, but a weaker external sustainability coefficient. The result is not a judgment about current-account balances alone; it reflects the estimated time-varying responsiveness between exports and imports, and between revenues and expenditures.
France and Italy at a glance
| Indicator | France | Italy |
| Average fiscal sustainability coefficient | 0.030 | 0.125 |
| Average external sustainability coefficient | 0.858 | 0.664 |
| Fiscal coefficient: pre- to post-GFC | 0.005 → 0.041 | 0.092 → 0.141 |
| External coefficient: pre- to post-GFC | 0.888 → 0.844 | 0.603 → 0.692 |
| Key fiscal → external causality window | Eurozone crisis, 2010–2012 | Pandemic period, 2020–2022 |
| Key external → fiscal causality window | Pandemic period, 2020–2022 | From 2013Q4 onward |
Table 1. Summary of France–Italy contrasts in the accepted manuscript. Source: authors’ calculations and reported causality windows.
The GFC as a turning point
The paper distinguishes between the pre-GFC and post-GFC periods. For France, the fiscal coefficient rises from 0.005 before the GFC to 0.041 after it. This is an improvement, but from a very low starting point. Italy’s fiscal coefficient also rises, from 0.092 to 0.141, suggesting a stronger post-crisis fiscal response than in France.
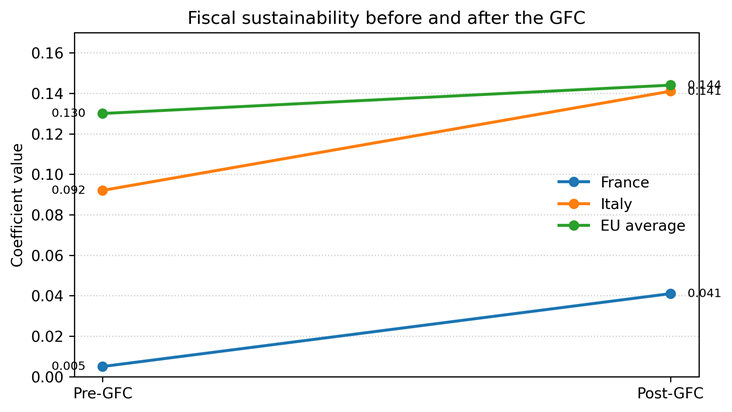
Figure 3. Fiscal sustainability before and after the GFC. Source: authors’ calculations from the accepted manuscript tables.
The external side differs more sharply. France starts from a high external coefficient and records a small decline, from 0.888 to 0.844. Italy moves in the opposite direction, with an increase from 0.603 to 0.692. Italy therefore improves in both dimensions after the GFC, but remains below France on external sustainability.
France: strong external sustainability, weak fiscal response
France’s profile is distinctive because the external side looks comparatively strong, while the fiscal side is weak. The average external coefficient is above the full-sample value and close to the core-country pattern. By contrast, the fiscal coefficient is substantially below the EU average. A natural reading is that France’s export-import relation appears more stable than its revenue-expenditure relation in the sample.
This does not mean that France has no external vulnerabilities. It means that, in the paper’s empirical specification, external sustainability is not the main weak point. The more salient issue is the low estimated fiscal response. For a country at the center of the euro area, this matters because fiscal credibility can shape financing conditions, confidence, and the broader adjustment process.
Italy: stronger fiscal adjustment, weaker external sustainability
Italy’s coefficient structure points to a different constraint. Its fiscal sustainability coefficient is higher than France’s, but its external coefficient is much lower. In the paper’s framework, Italy is closer to the peripheral euro-area pattern, where external performance, financing conditions, productivity and competitiveness are strongly connected to fiscal outcomes.
The post-GFC improvement in Italy is important. Both coefficients rise after the crisis, suggesting a stronger fiscal-external adjustment path. Yet the external coefficient remains below the full-sample average. This is the key macroeconomic difference with France: in Italy, external sustainability appears more central to the overall sustainability nexus.
Economic intuition: energy, competitiveness, balance sheets and institutions
The coefficients are empirical objects, but they are not abstract. They reflect structural features that affect how shocks are absorbed. For France, the key intuition is the energy structure. For Italy, it is the territorial structure of competitiveness and exports. These mechanisms should be read as interpretation of the results, not as variables directly estimated in the paper.
France’s high external sustainability coefficient is easier to understand when considering its electricity system. France has a very low-carbon electricity mix because of its large nuclear fleet, which the International Energy Agency describes as the second largest after the United States. Nuclear power represented roughly two-thirds of French electricity generation in 2024. This does not mechanically create a current-account surplus, but it reduces exposure to imported fossil fuels in electricity generation and dampens the terms-of-trade channel during energy price shocks. In the paper’s language, France is less exposed to the external-shock channel on the electricity side.
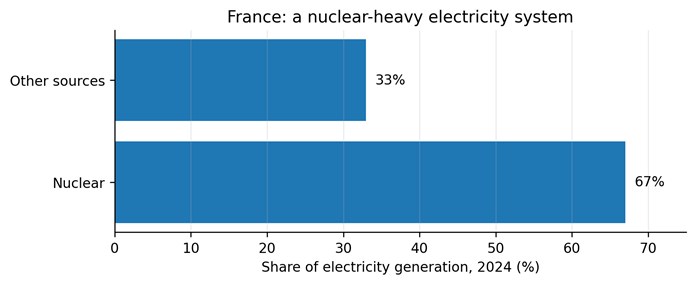
Figure 4. France’s nuclear-heavy electricity system and the external-shock channel. Source: IEA country profile and electricity data browser; nuclear share rounded from 2024 generation data.
This point also clarifies the fiscal result. A resilient energy mix can support external sustainability without ensuring fiscal sustainability. France’s low fiscal coefficient reflects the weaker estimated adjustment of revenues to expenditures. The energy base helps explain a relatively robust external coefficient; it does not remove the need for fiscal adjustment.
Italy is almost the mirror image. Its external sustainability is weaker in the aggregate, but the country has a strong export engine concentrated in the North. In 2024, North-West and North-East regions accounted for 68.8 percent of Italian goods exports. Lombardy alone represented 26.3 percent, while Emilia-Romagna and Veneto represented 13.4 percent and 12.9 percent. This helps interpret why external sustainability Granger-causes fiscal sustainability from 2013Q4 onward: when the northern export base performs well, it can feed into fiscal sustainability through higher corporate income, employment, VAT receipts, confidence and lower financing pressure.
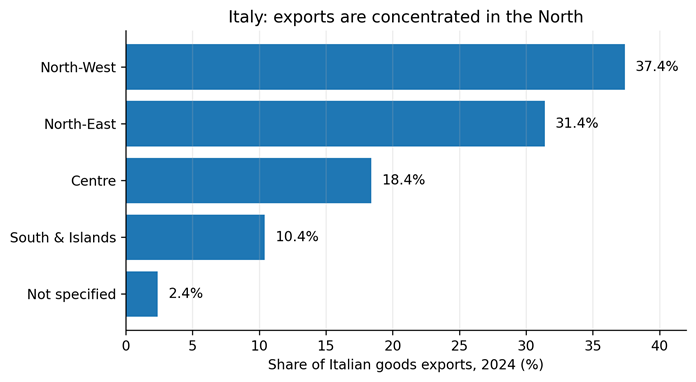
Figure 5. Italian goods exports by macro-region in 2024. Source: Istat, Export of Italian Regions, Q4 2024, Table 2. North-West plus North-East equals 68.8 percent of national exports.
The limitation is that this mechanism is geographically uneven. Strong competitiveness in Lombardy, Veneto, Emilia-Romagna, and Piedmont coexists with a weaker southern export base and with higher exposure to imported energy inputs. This dual structure can generate a paradox: Italy’s external performance can support fiscal sustainability when export clusters are strong, but aggregate external sustainability remains below France’s because the national adjustment is less broad-based and more exposed to energy and global manufacturing cycles.
The following table summarizes the economic intuition behind the France-Italy contrast.
| Structural feature | France | Italy | Interpretation |
| Energy mix | A nuclear-heavy electricity mix lowers exposure to fossil-fuel price shocks on the power side. | More exposed to imported energy inputs and energy-price shocks. | Helps rationalize France’s higher external sustainability coefficient. |
| Export structure | Large economy with diversified demand, but the external coefficient is less tied to a single regional export engine. | Northern manufacturing districts and firms are strongly export-oriented. | Helps explain Italy’s external-to-fiscal channel after 2013. |
| Fiscal channel | External resilience does not automatically imply a strong fiscal response. | Fiscal sustainability can improve when external/export performance strengthens revenues and confidence. | Same monetary union, different direction of causality. |
| Regional heterogeneity | More centralized national structure. | Pronounced North-South divide in competitiveness and export capacity. | Aggregate coefficients average very different territorial dynamics. |
Table 2. Structural economic channels behind the France-Italy comparison. Source: interpretation based on the accepted manuscript and official energy/export statistics.
Several additional factors deepen the economic intuition. They should not be presented as additional regressors in the paper. Rather, they are country-specific mechanisms that help translate the three channels of the paper – demand/absorption, risk-premium/financing, and terms-of-trade/external shocks – into the France-Italy comparison.
A first extension is the distinction between goods and services. France can combine a weak goods balance with a stronger services position; the Banque de France reports that the 2024 current-account improvement was driven partly by lower energy costs and by a further increase in the services surplus, especially business services. This helps explain why France can show a relatively strong external sustainability coefficient even when industrial competitiveness remains debated. Italy is different: its external performance is more closely tied to manufactured goods, industrial districts, and the global manufacturing cycle.
A second extension is the external balance sheet. The contrast is striking: France still had a negative net international investment position in 2024, while Italy had a positive position. Banca d’Italia reports that Italy’s net international investment position reached EUR 335 billion, equal to 15.3 percent of GDP, at the end of 2024, after a 39 percentage-point improvement since the end of 2013. This is consistent with the paper’s finding that external sustainability Granger-causes fiscal sustainability in Italy from 2013Q4 onward: external adjustment is not only a trade-flow story, but also a balance-sheet story.
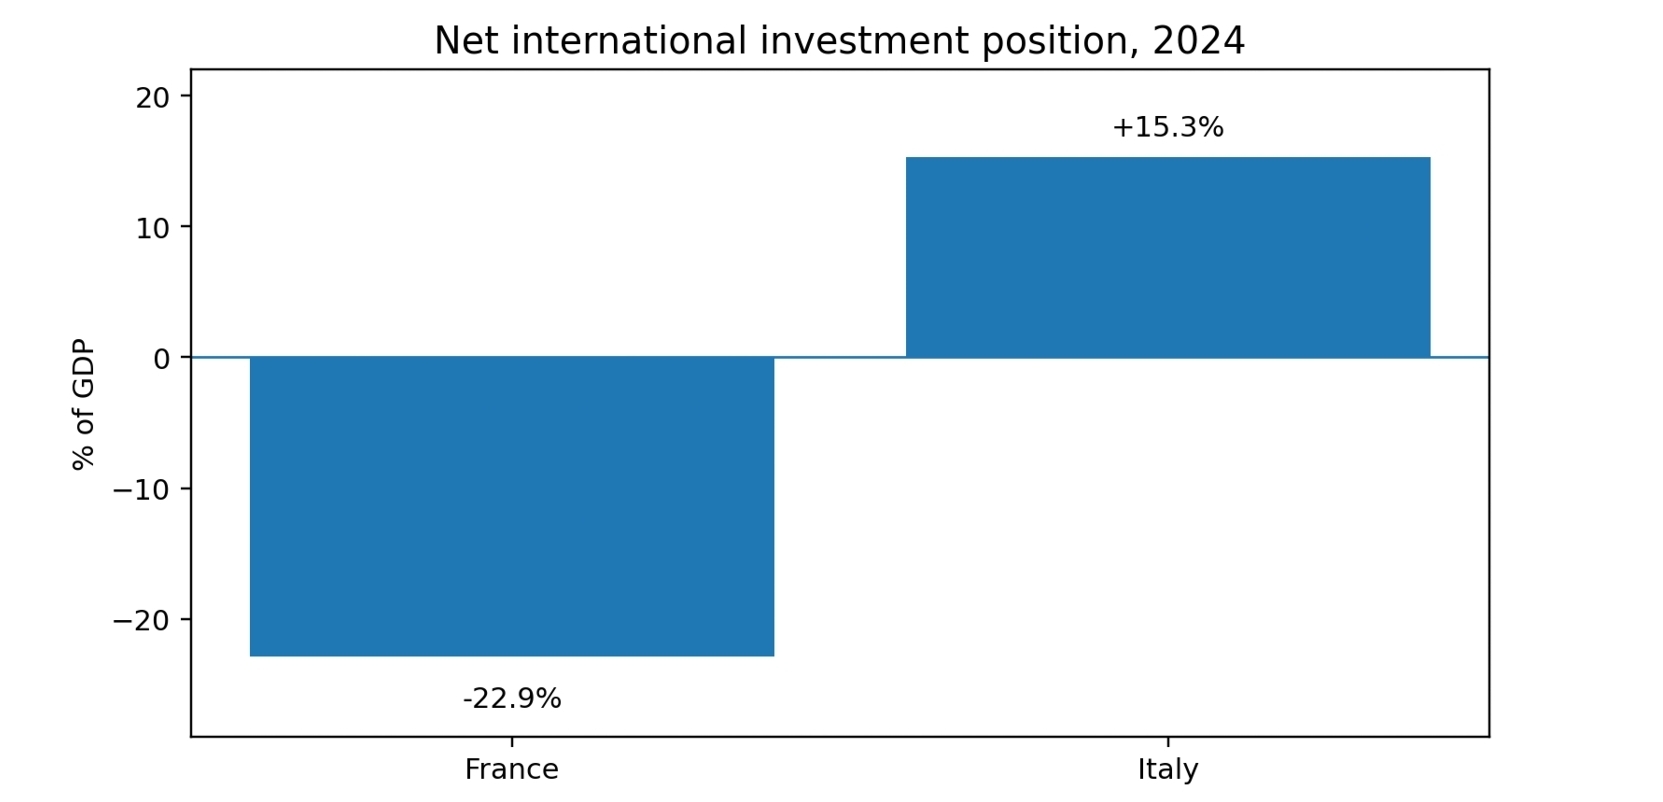
Figure 6. Net international investment position in 2024, France and Italy. Source: Banque de France and Banca d’Italia annual external-position reports.
A third extension is the fiscal structure itself. France’s low fiscal sustainability coefficient is easier to understand in light of its high public-spending model. The OECD Economic Survey of France notes that France has the highest public expenditure relative to GDP among OECD countries. Italy’s vulnerability is different: its public debt remains very high, and the sovereign-spread channel therefore matters more directly for fiscal-external feedbacks. This is why ECB backstops, market fragmentation risk and investor confidence are central to the Italian interpretation.
| Additional factor | France-Italy contrast | Why it matters |
| Goods versus services specialization | France benefits from a strong services surplus, while Italy relies more heavily on manufacturing exports and industrial districts. | Services can stabilize France’s external coefficient; manufacturing cycles make Italy’s fiscal position more dependent on external demand. |
| External balance sheet | France’s 2024 net international investment position remained negative; Italy’s was positive at 15.3 percent of GDP. | A stronger external balance sheet can lower vulnerability to financing shocks and helps interpret Italy’s external-to-fiscal causality after 2013. |
| Fiscal structure | France has a high public-spending model; Italy has a very high debt ratio. | France’s challenge is the weak revenue-expenditure response; Italy’s challenge is the sensitivity of fiscal sustainability to risk premia and confidence. |
| Productivity and labour participation | Italy combines strong exporting firms with low productivity growth and low labour-market participation, especially among women; France faces competitiveness issues but has a broader services base. | Potential growth and participation affect tax bases, debt dynamics and external competitiveness over the medium run. |
| ECB backstops and market fragmentation | France benefits from core-country credibility; Italy is more exposed to sovereign-spread dynamics. | The risk-premium channel is stronger when market stress connects fiscal solvency to external financing conditions. |
| Energy and supply chains | France’s nuclear-heavy electricity system reduces electricity-side exposure to fossil-fuel prices; Italy relies more on natural gas for electricity and heating. | Energy shocks transmit through import bills, price shields, firm costs and automatic stabilizers. |
Table 3. Additional structural factors behind the France-Italy contrast. Sources: Banque de France, Banca d’Italia, OECD, IEA, Istat and ECB.
These factors also help avoid an overly mechanical reading of the coefficients. France’s relatively high external coefficient does not mean that France has no competitiveness problem; it means that its export-import relation is more stable in the paper’s empirical setup, with services and energy structure acting as partial buffers. Italy’s weaker external coefficient does not mean that Italy lacks competitive firms; rather, competitiveness is concentrated territorially and sectorally, while high public debt and energy exposure make the fiscal-external link more sensitive to shocks.
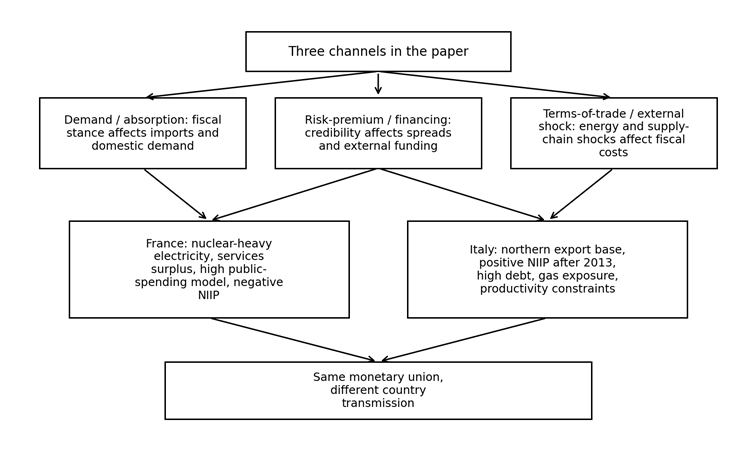
Figure 7. Broader economic intuition behind the France-Italy contrast. Source: author’s interpretation based on the paper and official country sources.
Causality is time-varying, not permanent
The paper’s main contribution is to move beyond static comparisons. The recursive tests show that causal links appear in specific crisis windows. During the Eurozone crisis, France is among the countries where fiscal sustainability Granger-causes external sustainability. Italy does not appear in that 2010–2012 fiscal-to-external group, but it does appear during the pandemic period. In the reverse direction, Italy is especially noteworthy: external sustainability Granger-causes fiscal sustainability from 2013Q4 onward. France shows external-to-fiscal causality during the pandemic period.
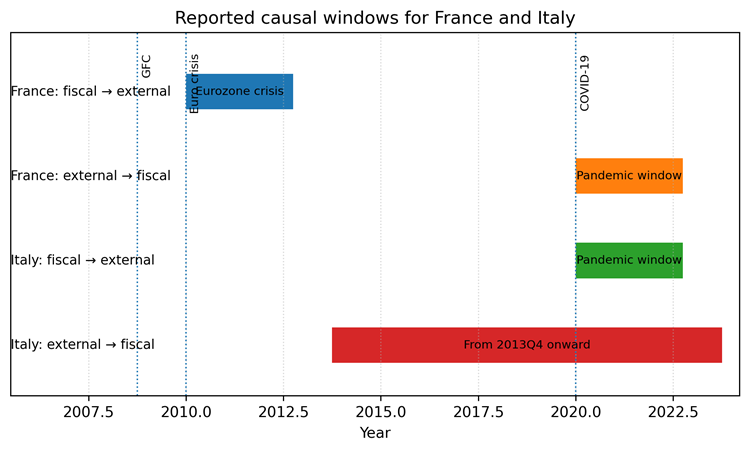
Figure 8. Reported causal windows for France and Italy. The bar lengths summarize the windows described in the accepted manuscript; the exact statistical paths are reported in the paper’s recursive-window figures.
This result is useful for policy interpretation. For France, fiscal credibility mattered for external adjustment during the euro-area stress episode. For Italy, the reverse mechanism is especially important after 2013: external performance appears to feed back into fiscal sustainability. In other words, Italy’s fiscal sustainability is not only a budgetary issue; it also depends on the external side of the economy.
Policy interpretation
The France–Italy comparison highlights two macroeconomic configurations inside the same monetary union. France combines high external sustainability with weak fiscal sustainability. Italy combines a stronger fiscal coefficient with lower external sustainability. The policy priority is therefore not identical. For France, strengthening fiscal sustainability without weakening growth is central. For Italy, external competitiveness, productivity, export capacity and the resilience of the tradable sector are directly relevant to fiscal sustainability.
The economic intuition reinforces the asymmetry. France’s nuclear-heavy electricity system helps buffer external shocks, but it does not solve the fiscal response problem. Italy’s northern export machine can support public finances through growth and revenues, but it also makes fiscal sustainability more dependent on external competitiveness and global manufacturing cycles.
The added mechanisms are useful for the blog because they connect the econometric evidence to concrete country structures. For France, services exports, nuclear electricity and high public expenditure point to a combination of external resilience and fiscal rigidity. For Italy, the positive external balance sheet, the northern export base, high debt and natural-gas exposure explain why external performance can support fiscal sustainability, while also leaving the country vulnerable to global demand, energy prices and sovereign-spread shocks.
The broader implication is that fiscal surveillance and external-imbalance surveillance should be read together. The Stability and Growth Pact and the Macroeconomic Imbalance Procedure are connected: in a monetary union, fiscal and external positions interact through absorption, risk premia, financing constraints and shocks such as energy prices or supply-chain disruptions.
Main takeaway
Fiscal and external sustainability in the euro area are linked, but not uniformly. France and Italy illustrate why country-specific, time-varying evidence matters: France’s fiscal side is the weak link, while Italy’s external side is central to the fiscal-external adjustment process.
References and data sources
Afonso, António, José Alves, José Carlos Coelho, and Jamel Saadaoui. “What are the causal links between fiscal and external sustainability in the EU? New time-varying evidence.” Accepted in Journal of International Money and Finance.
International Energy Agency. France country profile and electricity data browser. Used for the stylized fact on France’s nuclear-heavy electricity mix.
Istat. Export of Italian Regions, Q4 2024. Used for the 2024 regional export composition of Italy.
Banca d’Italia. The economy of the Italian regions, November 2024. Used for macro-regional context on Italian regional dynamics.
Banque de France. The balance of payments and international investment position, 2024 annual report. Used for the 2024 current-account, services-surplus, and NIIP discussion.
Banca d’Italia. The 2024 Annual Report at a Glance. Used for Italy’s 2024 NIIP, public-debt ratio and external-balance-sheet interpretation.
OECD. OECD Economic Surveys: France 2024. Used for the interpretation of France’s high public-spending model.
OECD. OECD Economic Surveys: Italy 2024. Used for the discussion of productivity, labour-market participation and bureaucracy constraints. European Central Bank. The Transmission Protection Instrument, 21 July 2022.