In a recent NBER WP, Joshua Aizenman and I examine the behavior of exchange rates around the 2024 US presidential election. In a previous post, I present this recent work in detail:
How these recent exchange rate movements have evolved in the recent weeks? In this blog, I will build on previous blogs to download one-minute data for the EUR/USD currency pair and explore the behavior of the exchange rate around the US election and around the Inauguration Day. I have to use Jupyter to download the data from Polygon.io, so I recommend you to consult the following blog before diving into this one.
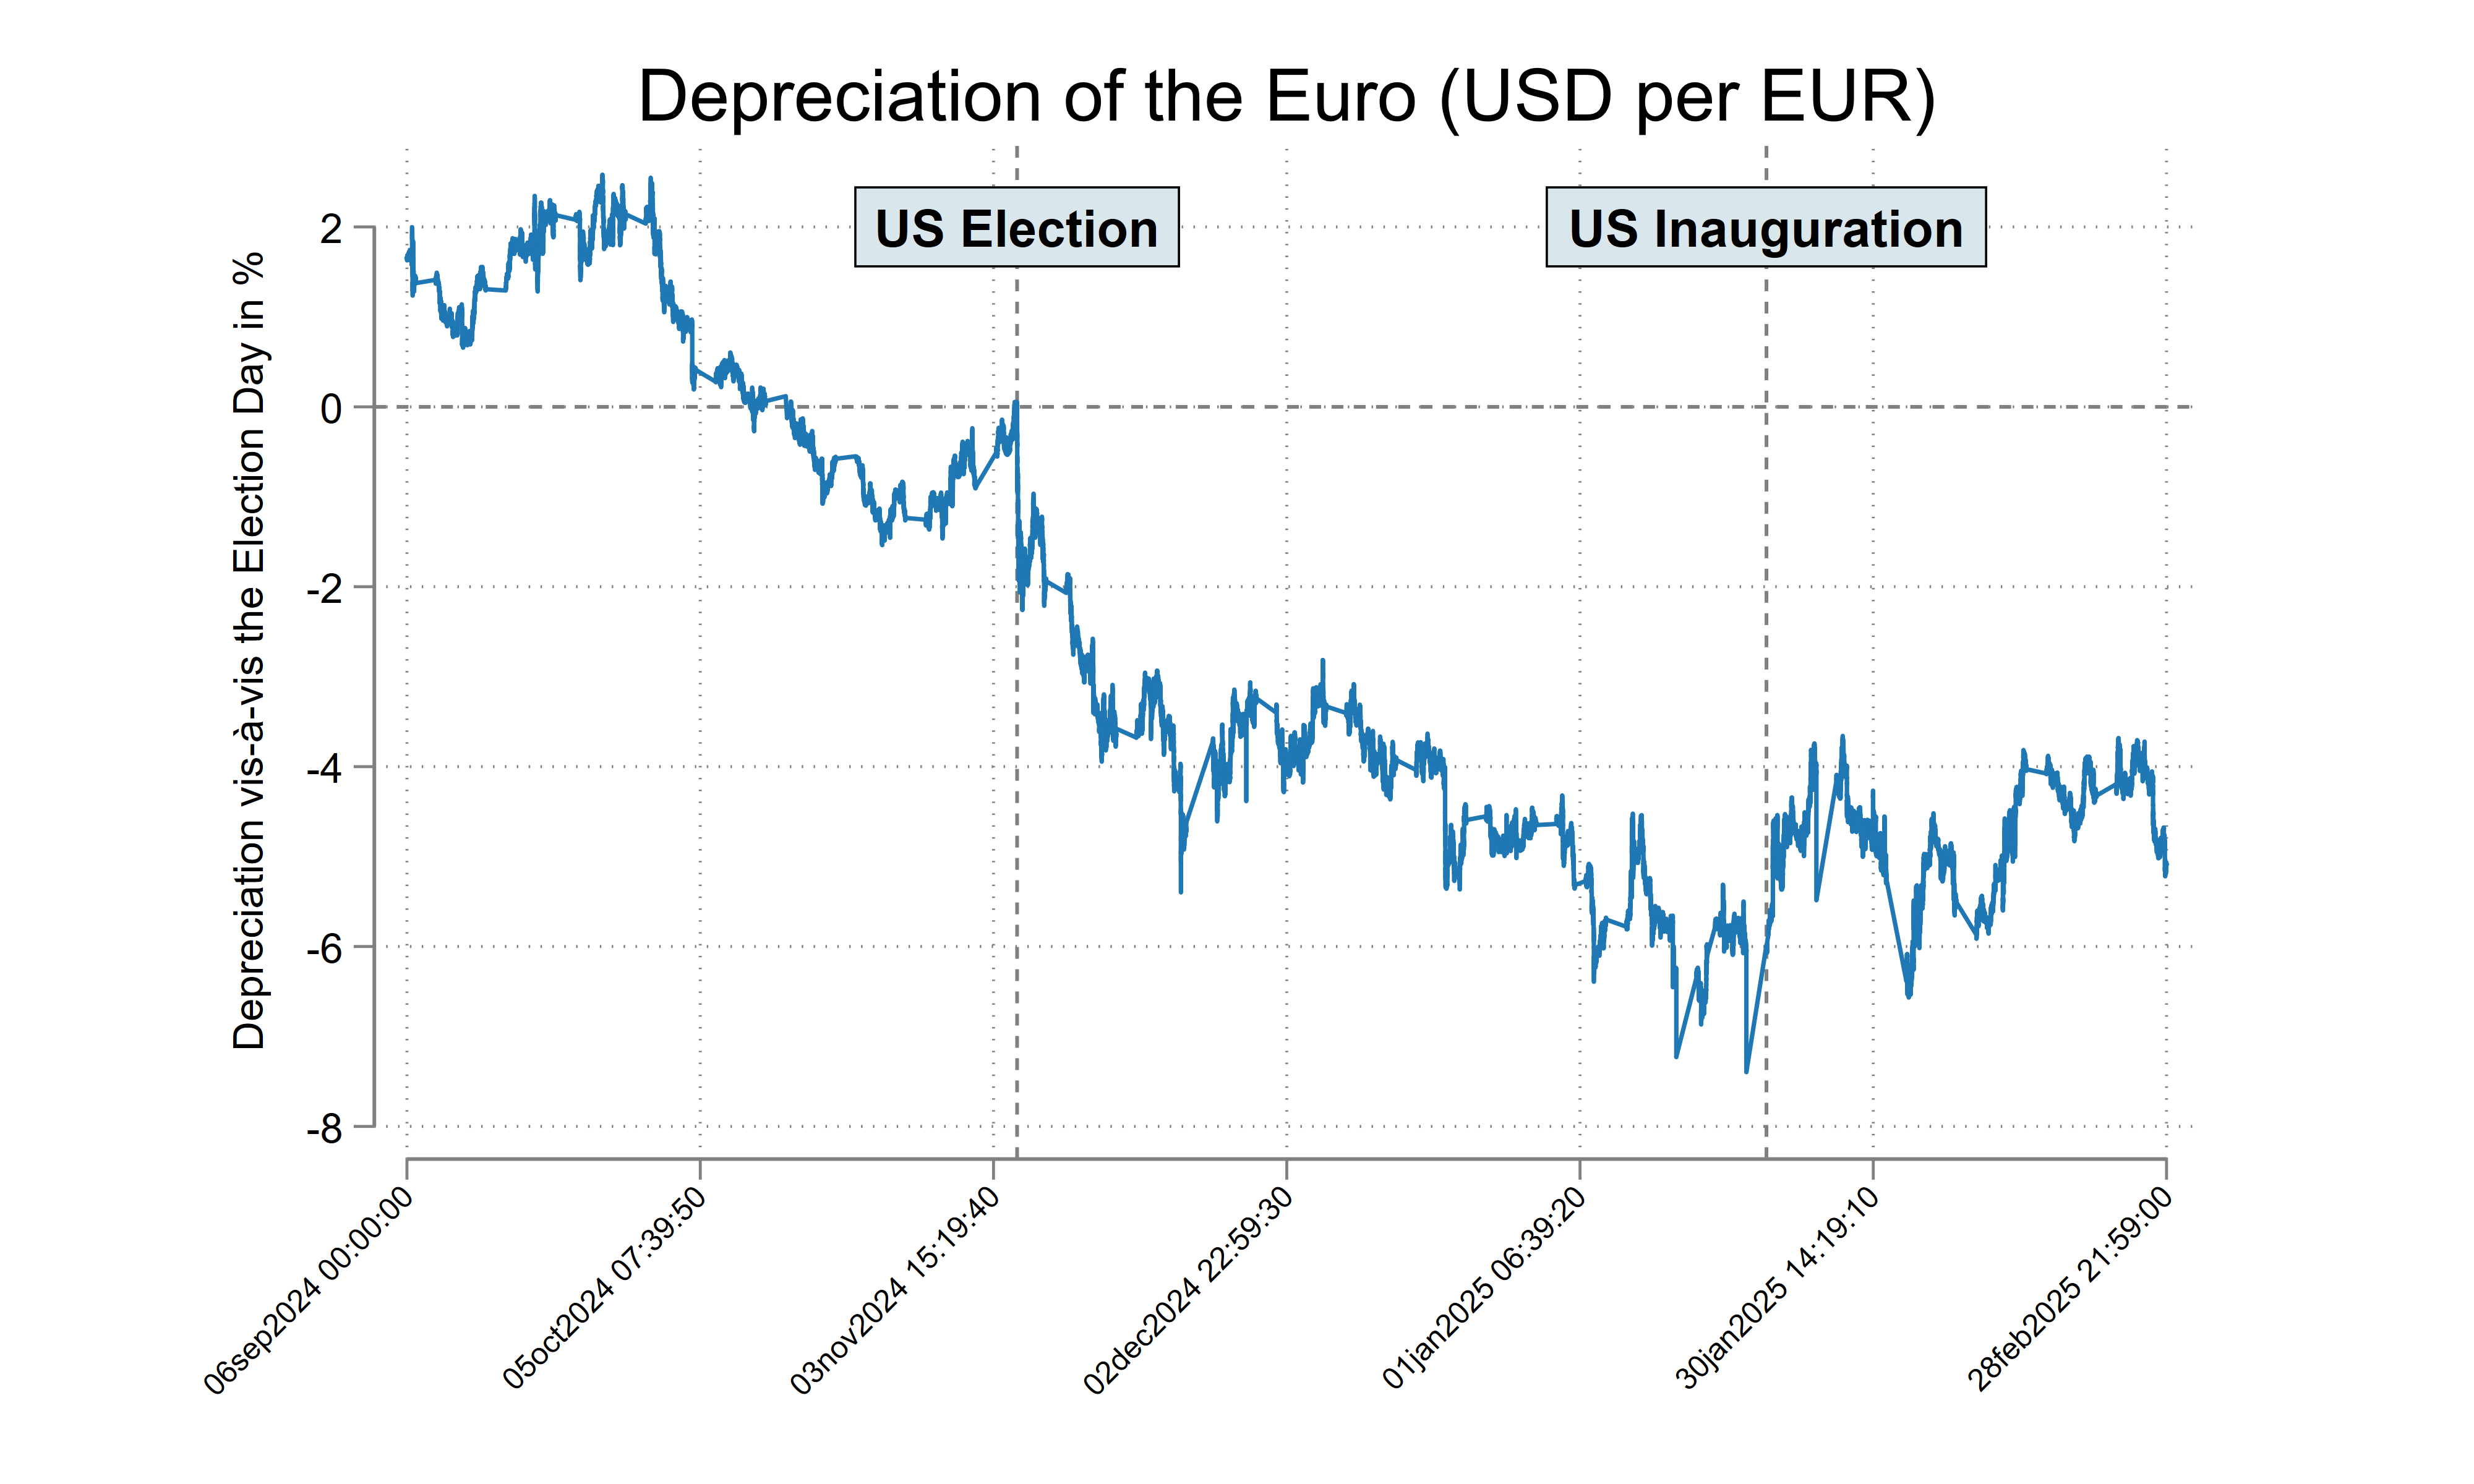
We are going to reproduce the following graph:
The part of the blog to download the data is in the Jupyter Notebook below. You only have to change the part in “” with your own API key from Polygon. We will get one-minute data from 2024-09-06 to 2025-03-01 for the EUR/USD currency pair:
Once you get your Excel file with the data, you have to apply the following operations to get the data in a format that Stata will easily read.
First, get the day using the ‘timestamp’:
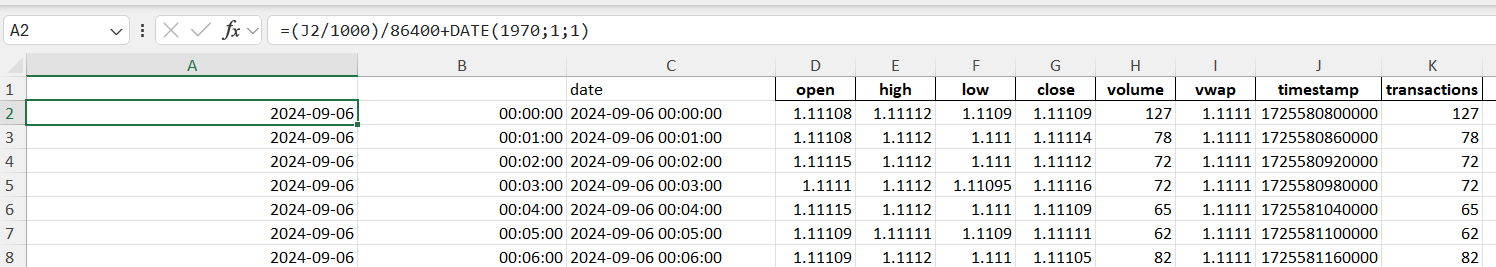
Second, get the hour using the ‘timestamp’:
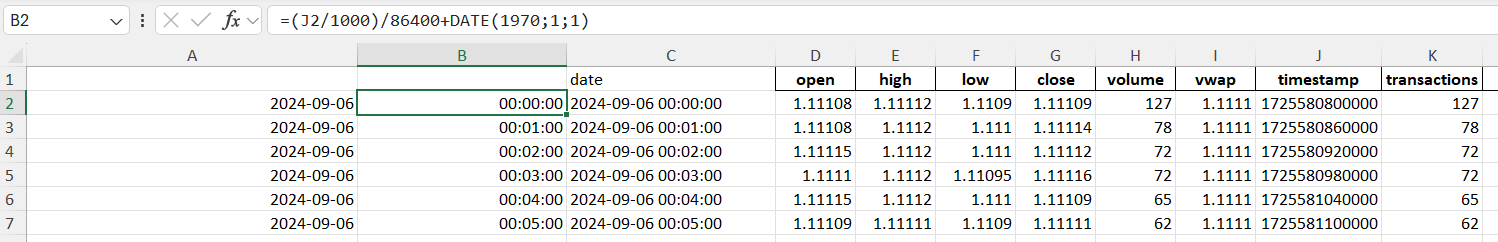
Third, prepare the date string using the CONCAT and TEXT functions:
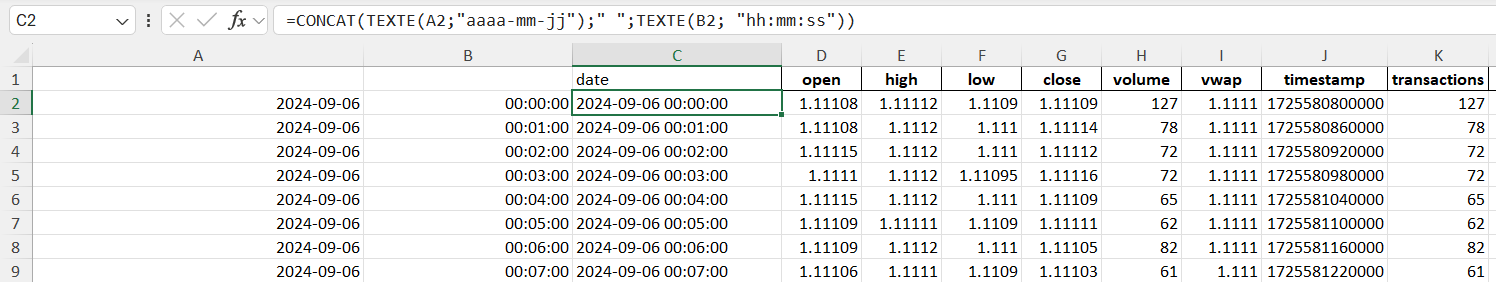
Now, everything is ready to go to Stata. Each is commented below:
**# Import and visualize high-frequency data

// Set the current directory
cd "C:\Users\jamel\Dropbox\Latex\PROJECTS\"
cd "24-11-xr-trump-election\Data-HFD"

// Import the data and select
import excel "EURUSD_data_1march2025.xlsx", ///
 sheet("Sheet1") cellrange(C1:K175021) firstrow clear

// Because %tc values can be so large,
// whenever you use the function clock(),
// you must store the results in a double, as we do below:
// https://www.stata.com/manuals13/u24.pdf

gen double date2 = clock(date, "YMDhms")
gen double date3 = clock(date, "YMDhms")

// Format the variable to see all the digits in browser mode
format %100.0g date3

// Format the date variable
format %tc date2

// Declare the time series
tsset date2

// Rename the closing value C_EURUSD
rename close C_EURUSD

// Create deviation from the Election Day
cap drop dFX
gen dFX=100*((C_EURUSD[_n]-C_EURUSD[60950])/C_EURUSD[60950])

// Create an artifical time variable
gen time = _n-1

// Choose a nice scheme
set scheme white_tableau

// Make a graph
twoway ///
 (tsline dFX, ///
  title("Depreciation of the Euro (USD per EUR)") ///
  xlabel(2041200000000(2533190000)2056399140000, ///
  angle(45) labsize(vsmall)) ///
  ytitle("Depreciation vis-à-vis the Election Day in %") ///
  tlabel(, grid) ysize(6) xline(2046470400000 ///
  2052943200000) xsize(10) xti("") ///
  text(2 2046470400000 "{bf:US Election}", box ///
       margin(l+1 t+1 b+1 r+1)) ///
  text(2 2052943200000 "{bf:US Inauguration}", box ///
       margin(l+1 t+1 b+1 r+1)) ///
  graphregion(margin(l+10 r+15)) yline(0) ///
  , name(EURUSD, replace))
graph export EURUSD.pdf, replace
graph export EURUSD.tif, width(4000) replace

// Save the data
save EURUSD_data_1march2025.dta, replace

**# End of program
I obtain the following graph. On the election day, the huge depreciation of the euro, 2% in a few minutes, indicates that the news of the election of Donald was an unexpected information shock.

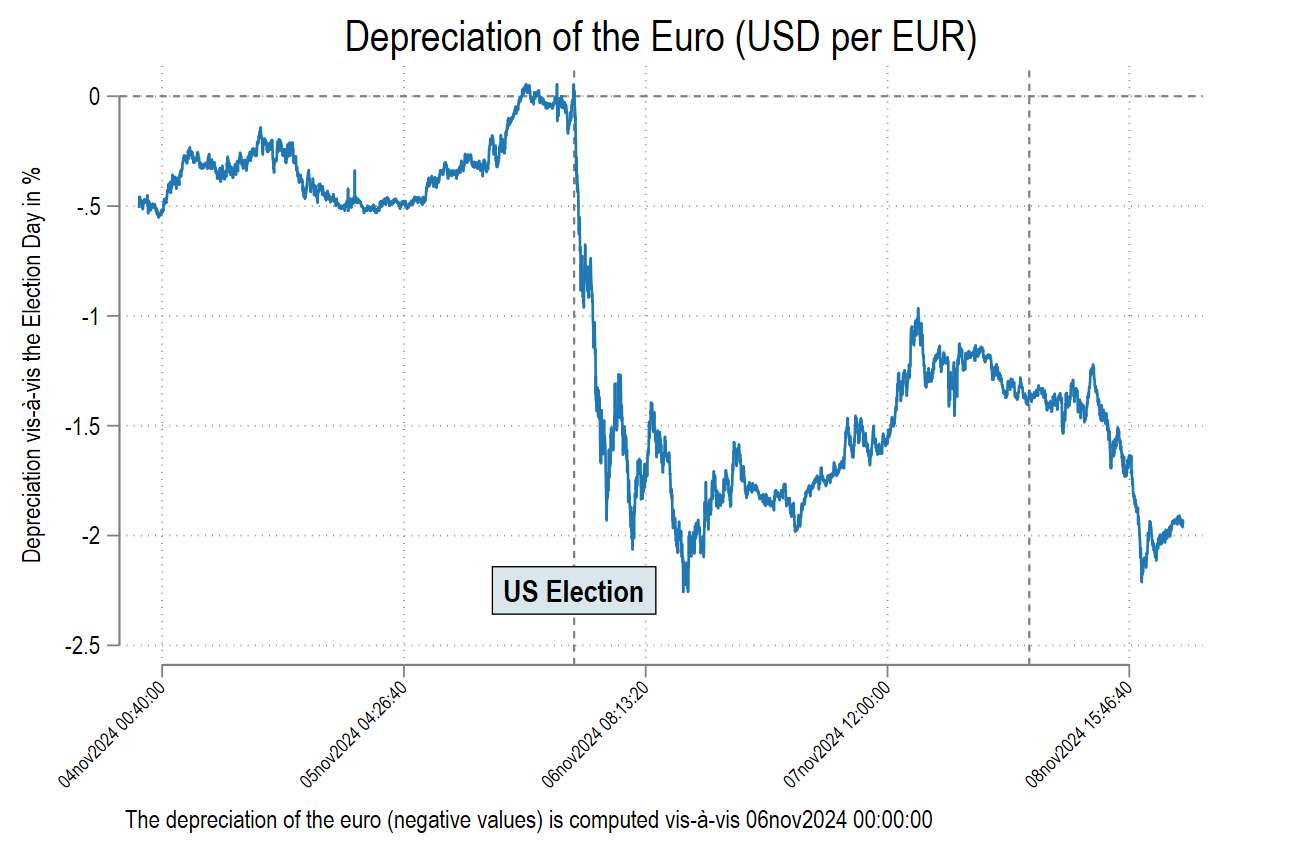
We can even ZOOM in the picture is the following code snippet:
// Find a specific date
scalar a = tc(03nov2024 22:00:00)
di %100.0g scalar(a)
scalar b = tc(08nov2024 21:59:00)
di %100.0g scalar(b)

// Make a more in-depth graph
twoway ///
 (tsline dFX if date3>2046290400000 & date3<2046722340000, ///
  title("Depreciation of the Euro (USD per EUR)") ///
  xlabel(, ///
  angle(45) labsize(vsmall)) ///
  ytitle("Depreciation vis-à-vis the Election Day in %") ///
  tlabel(, grid) ysize(6) xline(2046470400000 ///
  2052943200000) xsize(10) xti("") ///
  text(-2.25 2046470400000 "{bf:US Election}", box ///
       margin(l+1 t+1 b+1 r+1)) ///
  graphregion(margin(l+10 r+15)) yline(0) ///
  , name(EURUSDZOOM, replace) ///
  note(The depreciation of the euro (negative values) is computed vis-à-vis 06nov2024 00:00:00))
graph export EURUSDZOOM.pdf, replace
graph export EURUSDZOOM.tif, width(4000) replace