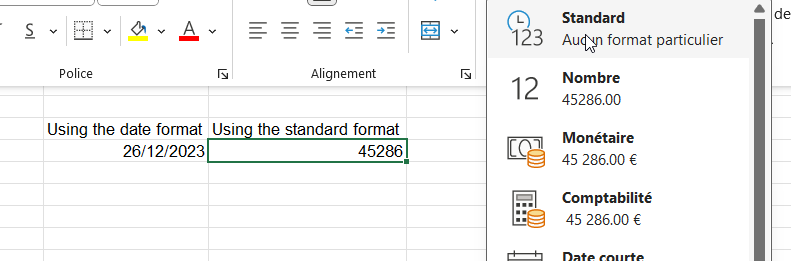
Usually in Statistics, time is a continuous quantitative variable that uses the interval scale when we are looking at dates (the ratio scale when we elaborate on duration, see https://www.statology.org/is-time-interval-or-ratio/). So we need a starting point in Excel and in Stata when we are working with dates. The starting point is 1 January 1900 in most versions of Excel, so each dates in Excel will count the number of days elapsed since the 1 January 1900. For example, today, the 26 December 2023 will be expressed as 45286 (a nice calculator: https://economictimes.indiatimes.com/news/date-calculator, note that 1900 is not a leap year).
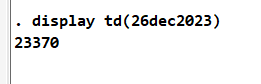
In Stata, the beginning of time is set to January 1, 1960, thus the same date will be expressed as the numbers of days elapsed since the starting point. We can see below that the number of days between, January 1, 1960, and December, 26, 2023 is equal to 23370 days:
In this blog, I will show how to convert Excel dates to Stata dates in a few simple steps:
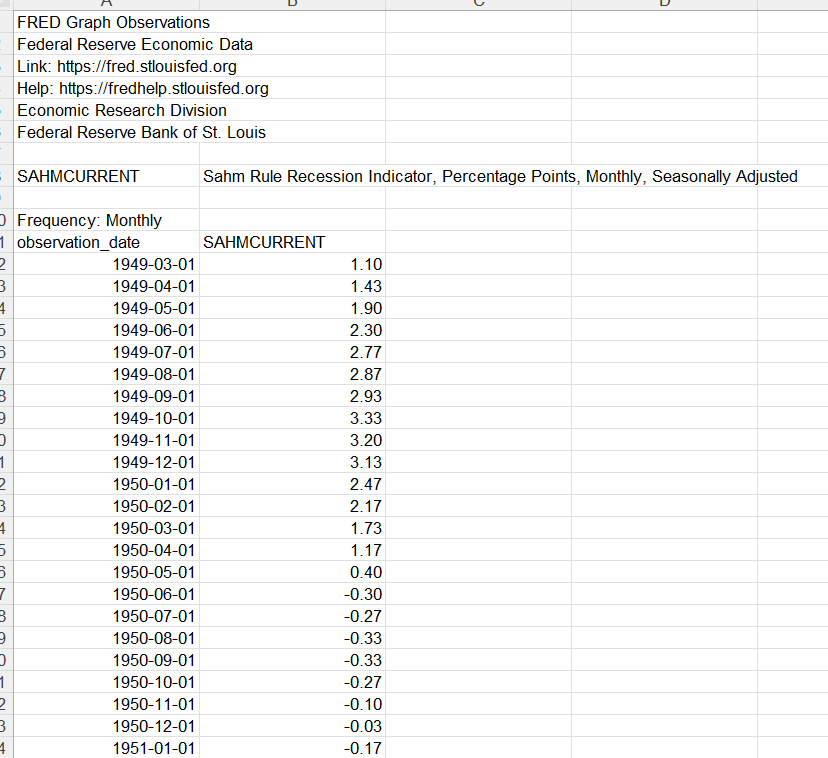
(Step A) Use a series with dates with Excel. You can download the series on FRED, for example, we will use the Sahm rule this time, https://fred.stlouisfed.org/series/SAHMCURRENT:
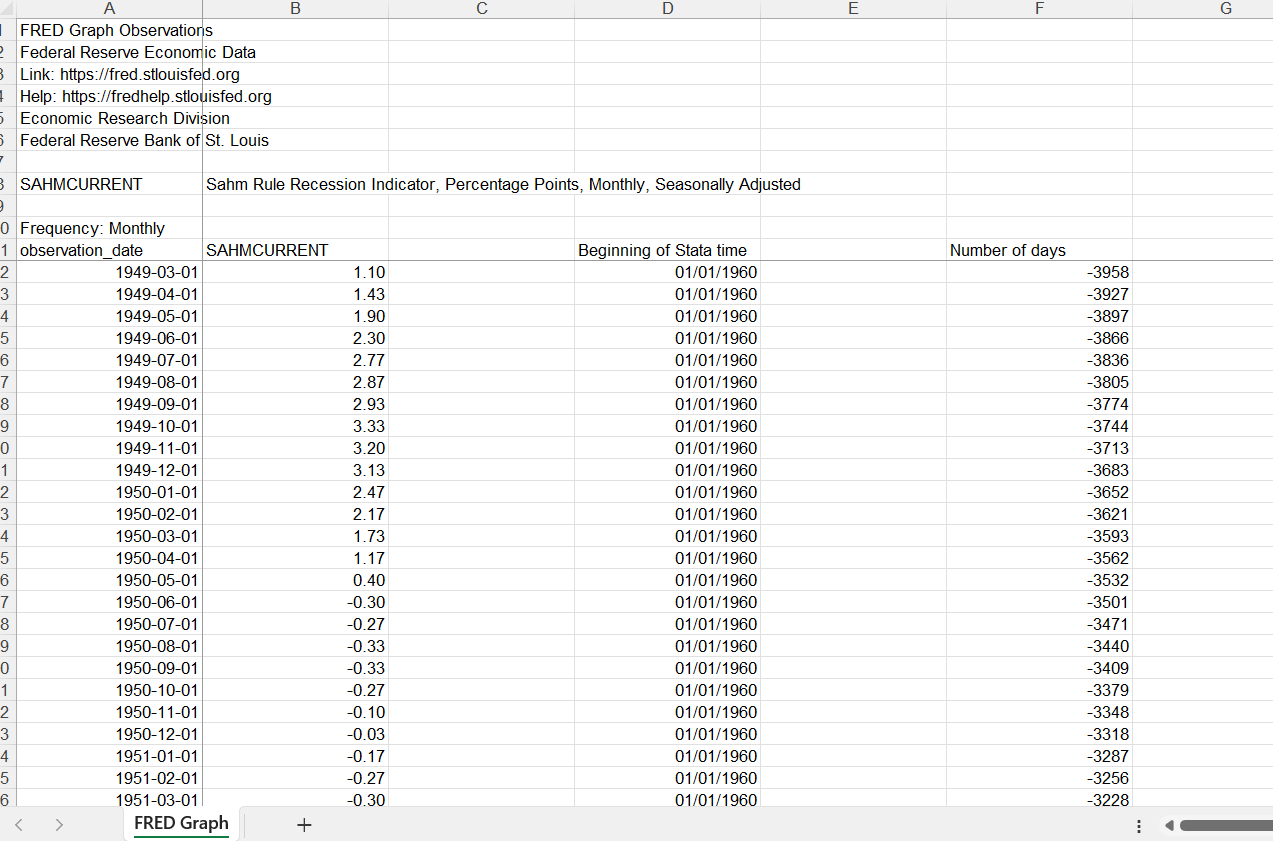
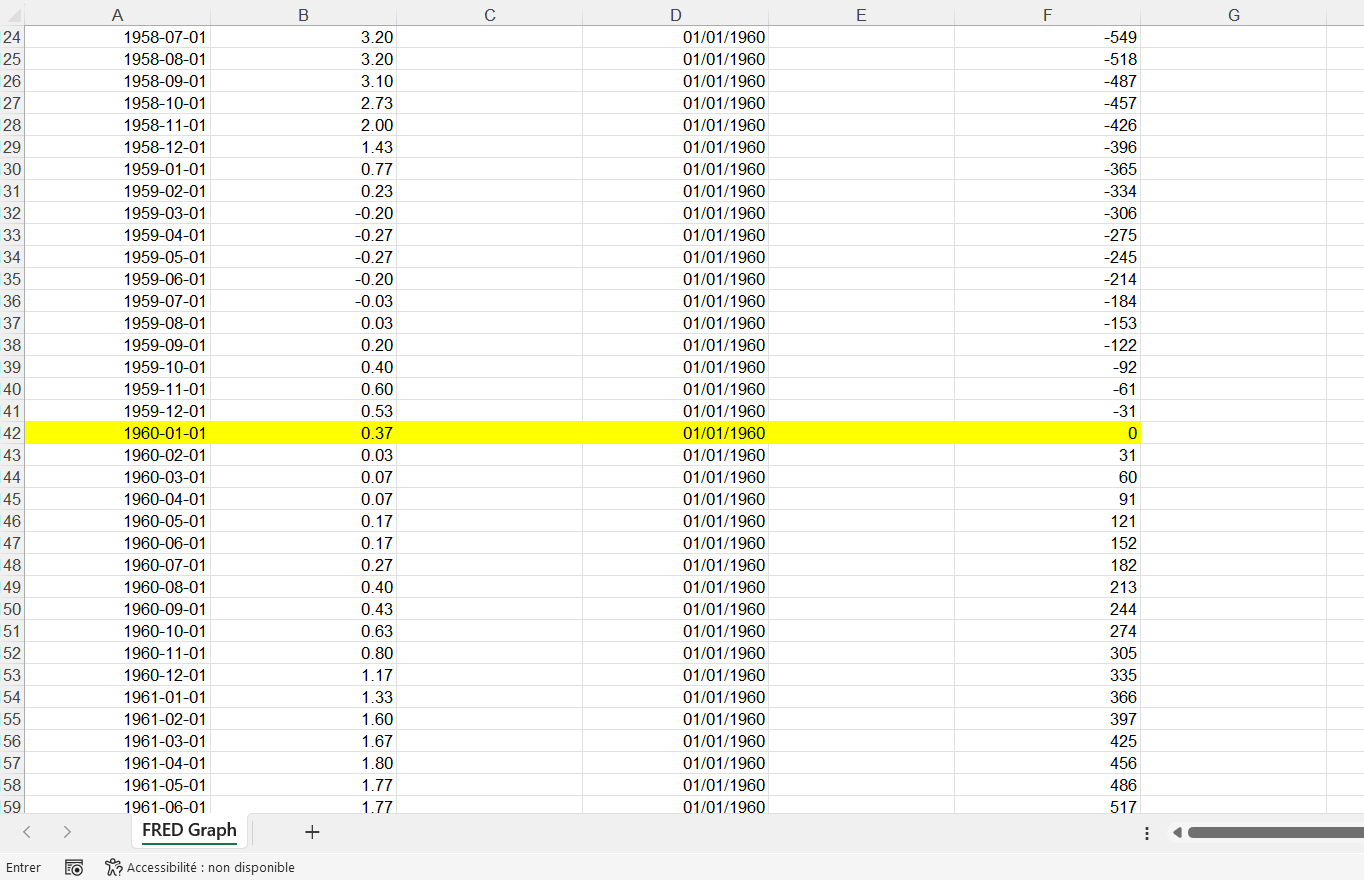
(Step B) I create a column with the starting point of Stata’s dates, 01/01/1960, and I make the difference between the column A and this new column. I will have the number of days elapsed since 01/01/1960:
(Step C) For pedagogical purposes, I can check that the beginning of time for Stata is indeed January 1, 1960:
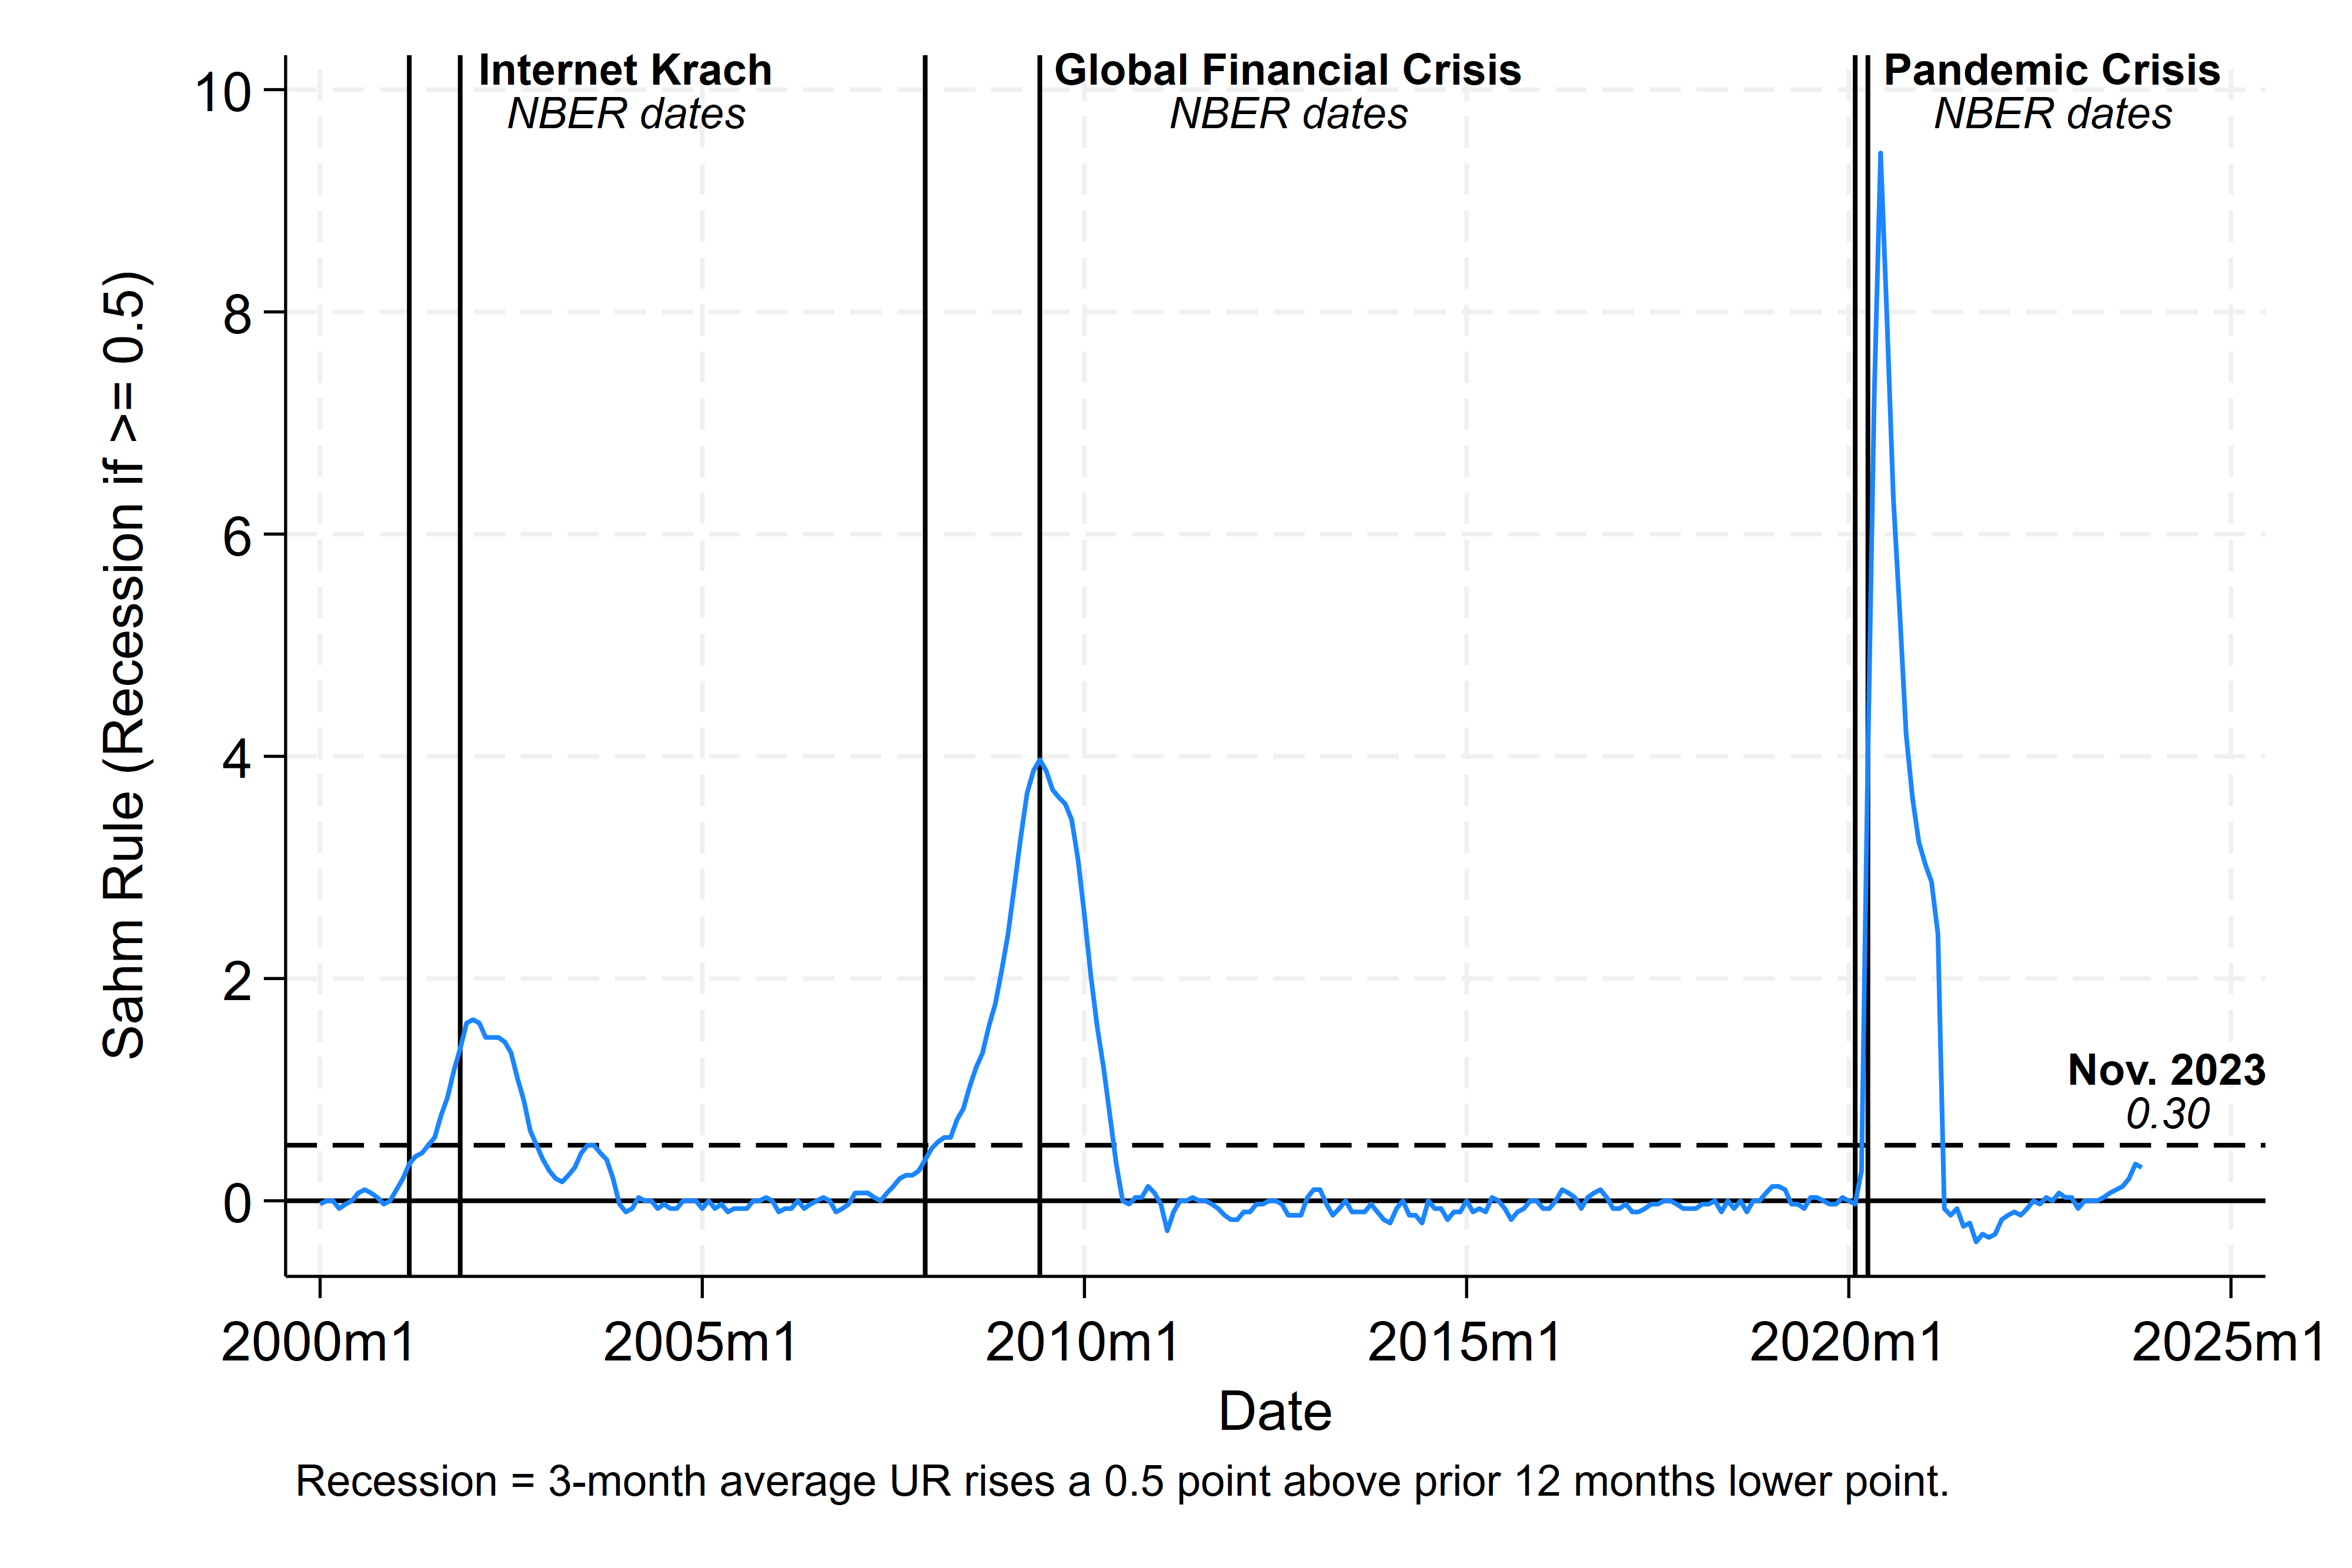
(Step D) Finally, I can draw the Sahm rule to think about a bit about the probability of a recession in the US in 2024:
**# ** Dates and time on Excel and Stata ***********************

// Download: https://fred.stlouisfed.org/series/SAHMCURRENT

// Prepare the Excel file with two columns

// Launch the Do file from the directory and import the Data

import excel SAHMCURRENT.xls, sheet("FRED Graph") ///
 cellrange(A11:F908) firstrow clear

// Drop unnecessary columns

drop C E

// Generate the month of the data with a Stata function

gen      month = mofd(Numberofdays)

*See: https://sscc.wisc.edu/sscc/pubs/stata_dates.html

// Format the month of the day

format   %tm month

// Keep the desired series

keep SAHMCURRENT month
order month SAHMCURRENT

// Declare time series

tsset month

// Draw a time series graph

format SAHMCURRENT %4.2f

label variable SAHMCURRENT "Sahm Rule (Recession if >= 0.5)"
label variable month "Date"

* Recession dates
display tm(2001m3)
display tm(2001m11)
display tm(2007m12)
display tm(2009m6)
display tm(2020m2)
display tm(2020m4)

tsline SAHMCURRENT if month>=tm(2000m1), yline(0.5) ///
 yline(0, lpattern(solid)) ///
 xline(494 502 575 593 721 723, lpattern(solid)) ///
 ylabel(,format(%4.0fc)) ///
 text(10 528 "{bf:Internet Krach}" "{it:NBER dates}", ///
  size(small)) ///
 text(10 632 "{bf:Global Financial Crisis}" "{it:NBER dates}", ///
  size(small)) ///
 text(10 752 "{bf:Pandemic Crisis}" "{it:NBER dates}", ///
  size(small)) ///
 text(1 770 "{bf:Nov. 2023}""{it:0.30}", size(small)) ///
 note("Recession = 3-month average UR rises a 0.5 point above prior 12 months lower point.", size(small)) ///
 graphregion(margin(l+2 r+2))

// Export the graph in two different formats

graph export figures\sahmrule.png, as(png) ///
 width(4000) replace
graph export figures\sahmrule.pdf, as(pdf) ///
 replace

// Save data

save sahmrule.dta, replace

**# ** The end of program **************************************
As we have seen in this blog, it is possible to switch back and forth between Excel and Stata dates in some simple steps. The files for replicating the results in this blog are available on my GitHub.
2 Comments
[…] addition to creating a time variable in Stata format (see this post), I will drop the second column and the second row […]
[…] = -3 and x = 551. 551 corresponds to the 551 months after the start of the time for Stata, see this blog for more […]