In this blog, I will show you that it is simple to switch back and forth between panel data and time series with the Stata command reshape. I will use the database built with the packages dbnomics and kountry in a previous blog of mine. The series used here is the IMF’s Financial Development Index (https://db.nomics.world/IMF/FDI) described here.
(Step A) We start by importing the series from an Excel File and preparing them for the reshape:
**# ********* Panel Data to Time series ************************
cd C:\Users\jamel\Documents\GitHub\
cd EconMacroBlog\Panel_Data_to_Time_Series_with_Stata
import excel data\Merged-Database.xls, sheet("Sheet1") ///
firstrow clear
encode ref_area, gen(ISO2)
drop if ISO2==.
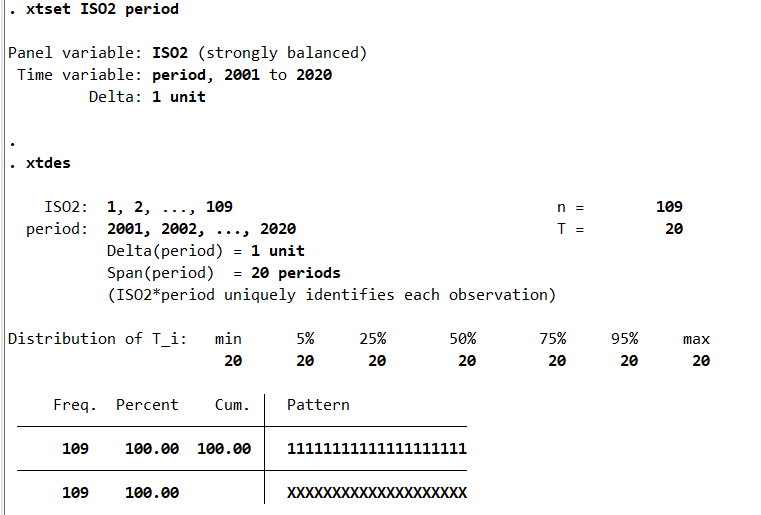
xtset ISO2 period
xtdes
by ISO2: gen period_abs = 0 + _n
keep period ref_area fd // Keep the variables for the merge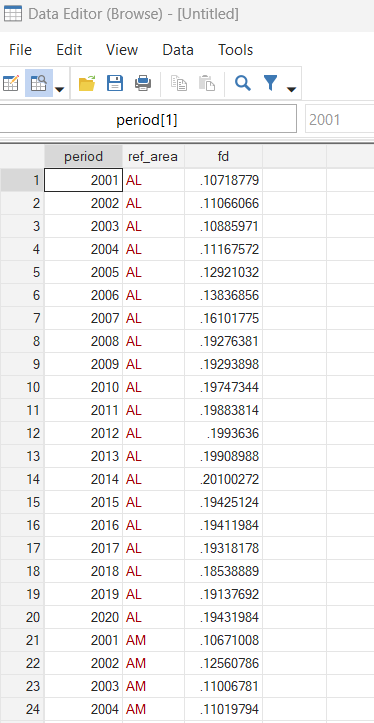
We have a panel of 109 individual countries and 20 yearly observations for each countries.
(Step B) Reshape the data with the i, the period, and the j, the countries’ ISO codes stored in the “ref_area” string to obtain 109 individual times series:
reshape wide fd, i(period) j(ref_area) string

tsset period

save fd_timeseries.dta, replace

export excel fd_timeseries.xlsx, firstrow(variables) ///
 keepcellfmt replace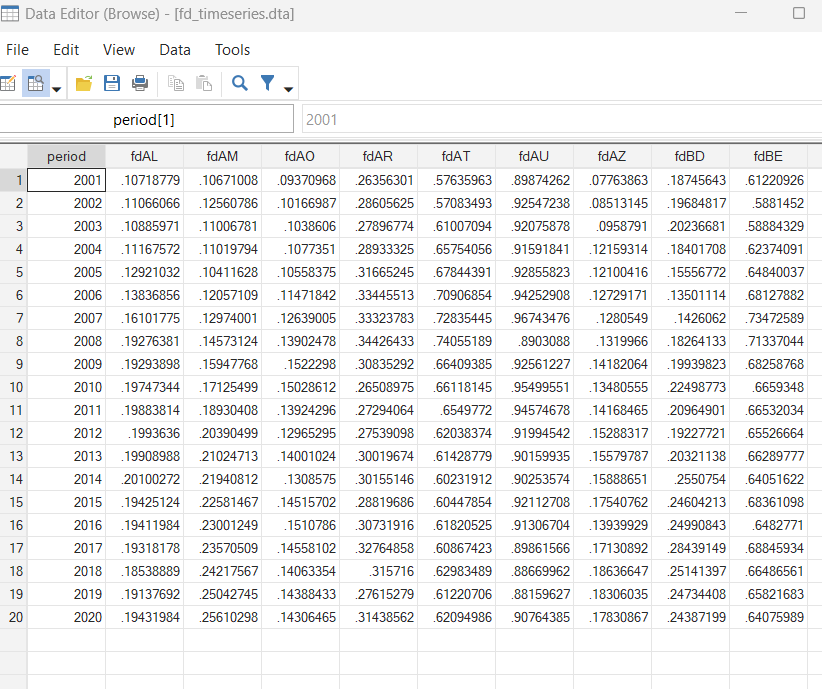
The number of observations is now 20 (2180 rows in the panel dataset divided by 109 countries). Besides, the number of variables moved from 3 (the date, period, the country identifier, ref area, and the Financial Development index, fd) to 110 (the year and 109 individual series). Add the option string if the country identifier is stored as a string. The original fd series has been split into 109 individual series thanks to the information in the country identifier series.
\mathbf{fd} \quad \rightarrow \quad \mathbf{fd}\text{AL} \quad \mathbf{fd}\text{AM} \ldots \mathbf{fd}\text{ZM}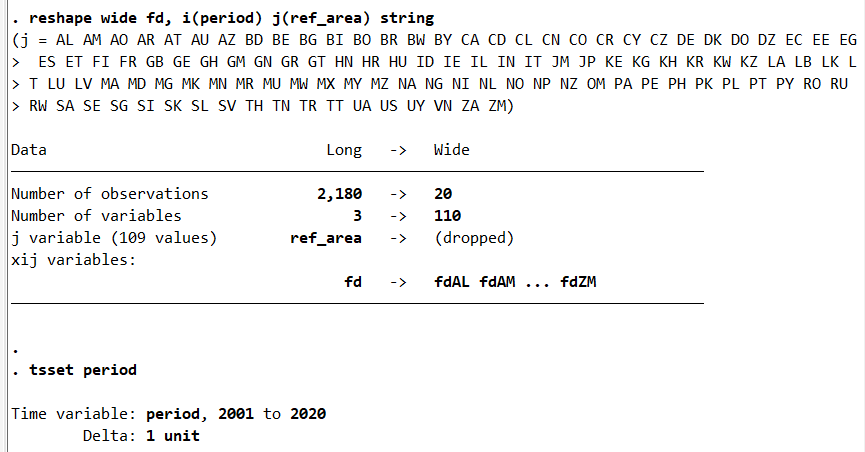
(Step C) You can go back to the initial panel dataset with 3 variables and 2180 (=109×20) observations:
reshape long fd, i(period) j(ref_area) string

encode(ref_area), generate(ISO2)

xtset ISO2 period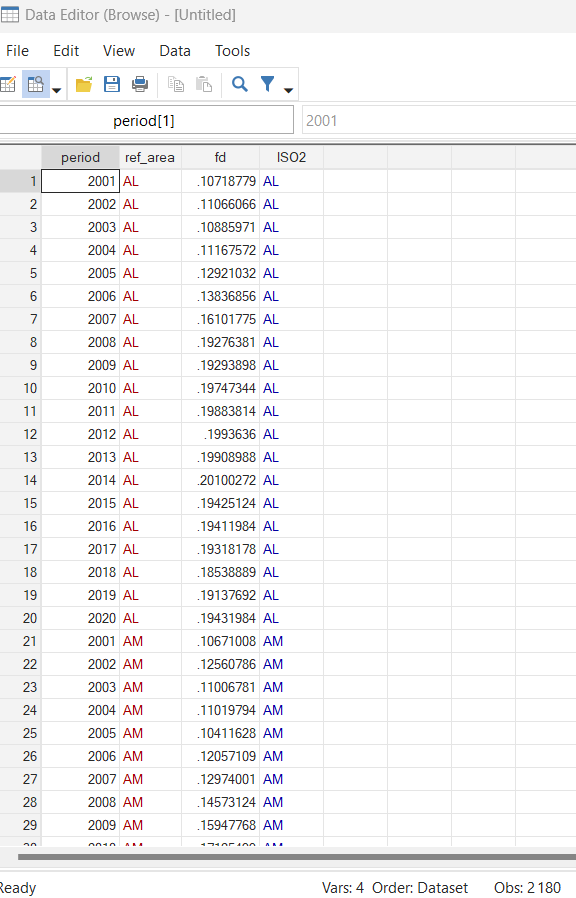
The number of observations is now, 2180 (20 rows in the panel dataset multiplied by 109 countries). Besides, the number of variables moved from 110 (the period and 109 individual series) to 3 (the period, the country identifier, ref area, and the Financial Development index, fd). Add the option string if the country identifier is stored as a string. The 109 individual series have been stacked to recover the original fd series, and, hence, rebuild the country identifier series, ref area.
\mathbf{fd}\text{AL} \quad \mathbf{fd}\text{AM} \ldots \mathbf{fd}\text{ZM} \quad \rightarrow \quad \mathbf{fd}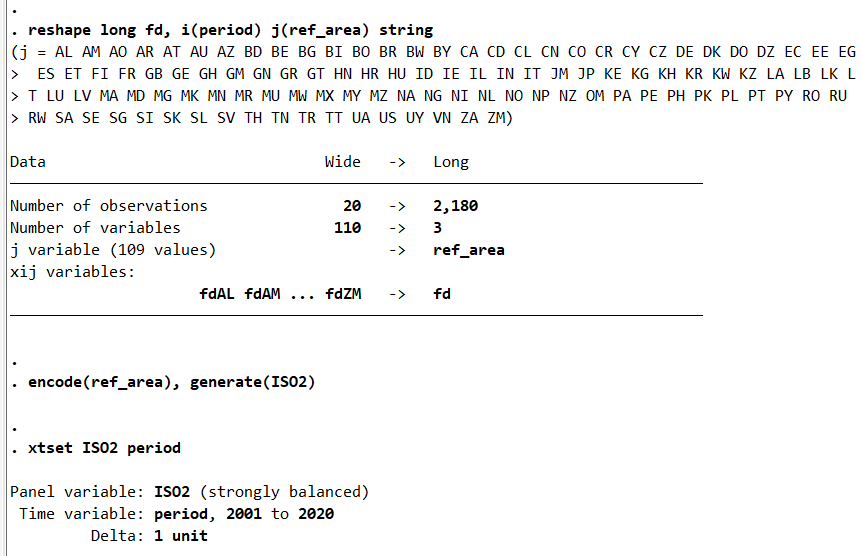
Finally, the full code below is provided for illustrative and pedagogical purposes:
**# ********* Panel Data to Time series ************************

cd C:\Users\jamel\Documents\GitHub\

cd EconMacroBlog\Panel_Data_to_Time_Series_with_Stata

import excel data\Merged-Database.xls, sheet("Sheet1") ///
 firstrow clear

encode ref_area, gen(ISO2)

drop if ISO2==.

xtset ISO2 period

xtdes

by ISO2: gen period_abs = 0 + _n

keep period ref_area fd // Keep the variables for the merge

reshape wide fd, i(period) j(ref_area) string

tsset period

save fd_timeseries.dta, replace

export excel fd_timeseries.xlsx, firstrow(variables) ///
 keepcellfmt replace


reshape long fd, i(period) j(ref_area) string

encode(ref_area), generate(ISO2)

xtset ISO2 period

**#************ The end of program *****************************
As we have seen in this blog, it is possible to switch back and forth between Times Series and Panel Data in some simple steps. The files for replicating the results in this blog are available on my GitHub.
1 Comment
[…] From panel data to time series with Stata [Updated] […]