In Stata, you can write long commands over several lines. You have basically three choices: first, change the end-of-line delimiter to ‘;’ with the following commands : “delimit ;” some commands “delimit cr”; second, you can comment out the line break by using /* */ comment delimiters; third, you can use the symbols /// to tell Stata that the comment is continuing on the following line. More explanations can be found here. With loops, it may become a bit tricky. You have to follow this syntax:
# delimit ;
foreach v in ALB BLR BIH BGR CZE HRV EST HUN
LVA LTU MKD MDA MNE POL ROU RUS SRB SVK SVN
TUR UKR { ;
replace cesee = 1 if iso3 == "`v'" ;
} ;
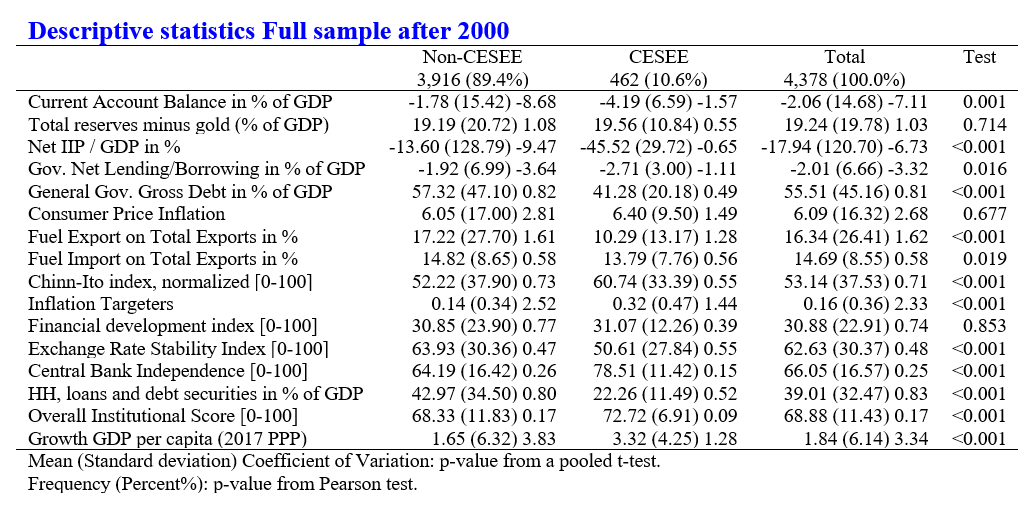
# delimit crThe first delimiter “;” has to be placed at the opening bracket “{“. Then, you have to add a second delimiter at the end of the command that will executed by the loop. Finally, you have to put a last delimiter at the place of the closing bracket. Let us look at the results of my previous post:
putdocx begin, font("Times New Roman", 9)

#delimit;
local variables "CAB RESGDP NIIP GDeficit GDebt CPI
FUELX FUELM ka_open IT FD ers cbie_index HH_LS inst
gGDP_PKPPP";

dtable `variables' if period>2000,
   by(cesee, totals tests)
   column(by(hide))
   sample(, place(seplabels))
   title(Descriptive statistics
   Full sample after 2000)
   titlestyles(font(, size(12) color(blue) bold))
   nformat(%6.0fc frequency)
   nformat(%6.2f  mean sd cv)
   continuous(, statistic(mean sd cv))
   halign(right)
   note(Mean (Standard deviation)
   Coefficient of Variation:
   p-value from a pooled t-test.)
   note(Frequency (Percent%):
   p-value from Pearson test.);

collect style putdocx, halign(center)
  layout(autofitcontents);

putdocx collect;

putdocx save ds_cesee_30july.docx, replace;

#delimit cr
We reproduce the same results with a more clear code. This book explains why you should not use long lines of codes. Ulrich Kohler and Frauke Kreuter recommend using a line length of about 60–65 lines.
2 Comments
[…] intact. In the loop, I use the pound delimiter ” ; “, which has been covered in this blog. After the regression, I use “mat b=e(b)” and “mat v=e(V)” to store the […]
[…] In the second part of the blog, we use financial data gathered for an ADB project and merge them with the Fed fund rates. We keep the US with keep imfcode == 111 and focus on cycles after 2004 with keep if period>=tm(2004m1). With the tsline command, I plot a time-series graph of the Wu-Xia shadow rate and the Fed funds. I also used tlabel option with the sub-option format to get a nice format for the date. The use of the pound delimiter ; is covered in this blog. […]