Let me show you how to use DBnomics to access a subcomponent of ND GAIN scores. I recommend you to consult my blog series on DBnomics before delving into this blog.
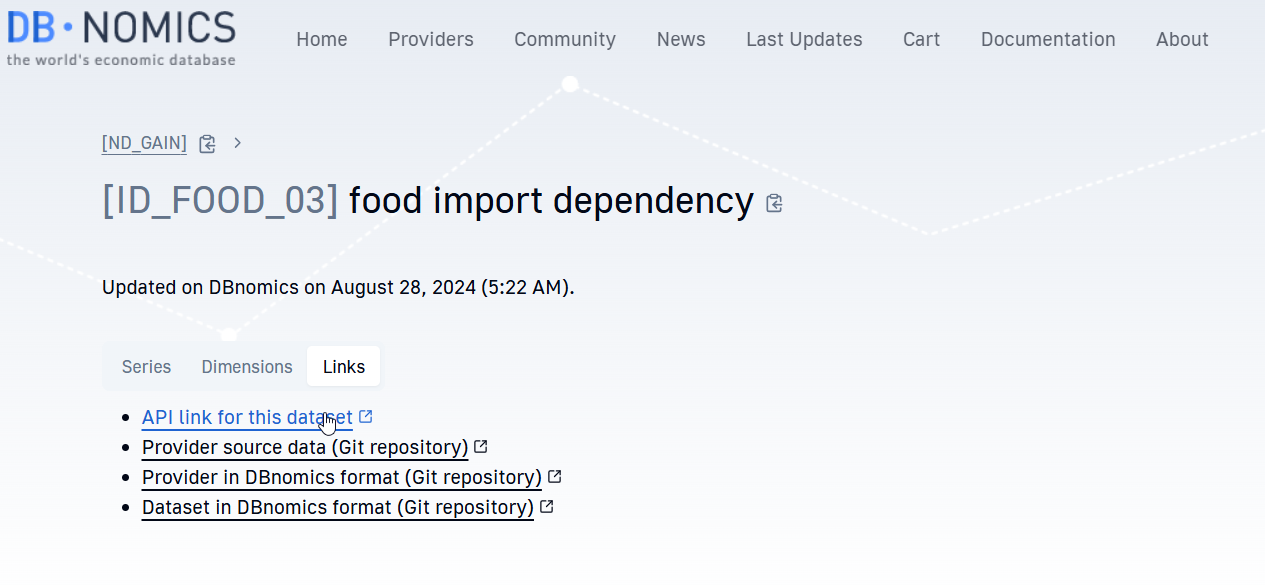
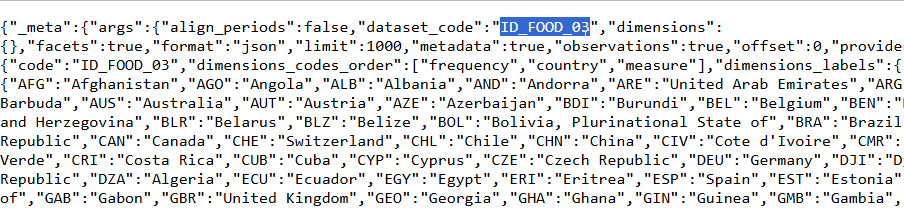
First, you have to choose the subcomponent of the ND GAIN scores that you want to select on the DBnomics website. Let us try the subcomponent ‘food import dependency’ which has the identifier [ID_FOOD_03]. A word of caution here, I recommend clicking on the API link and copying and pasting the identifier:
cd C:\Users\jamel\Dropbox\Latex\PROJECTS\24-03-emft-adb\data

dbnomics import, provider(ND_GAIN) ///
 dataset(ID_FOOD_03) clear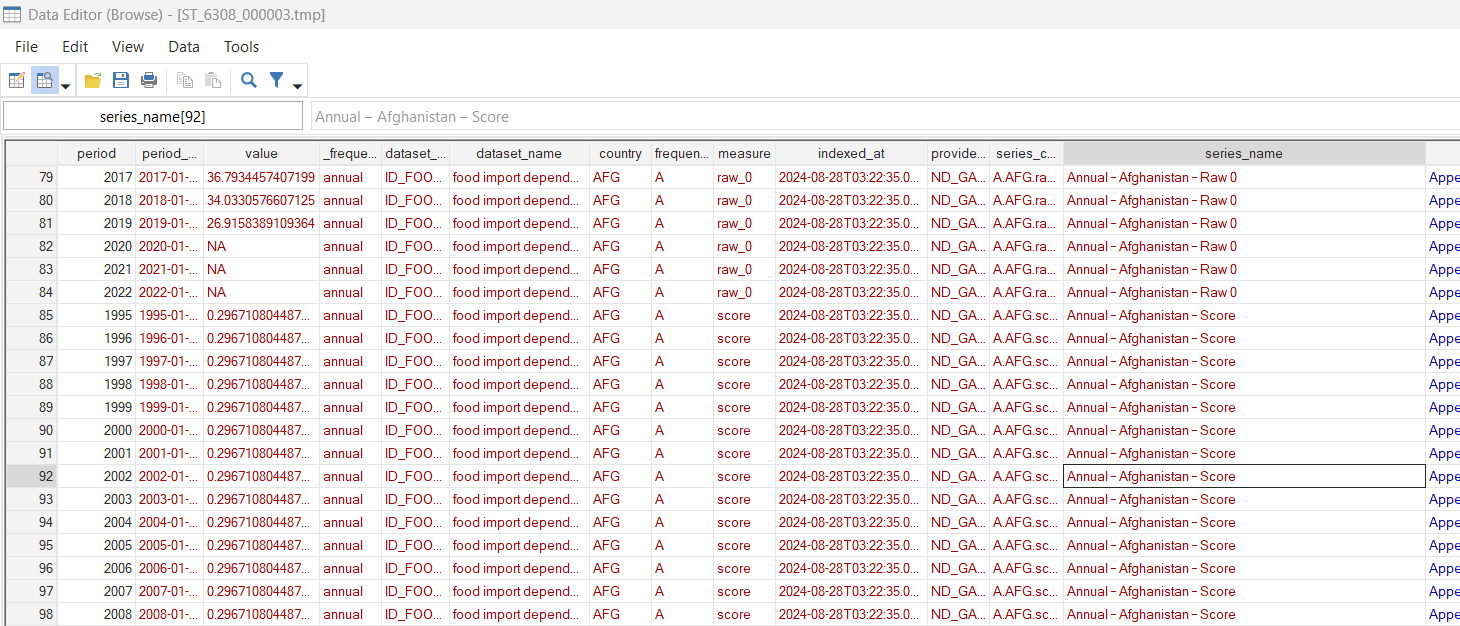
Then, you have to select the “Score” for this subcomponent with the following code (see the documentation for the country index). Again, a small word of attention here, look at the space before the word Score in the code.
split    series_name, parse(–)

keep if series_name3 ==" Score"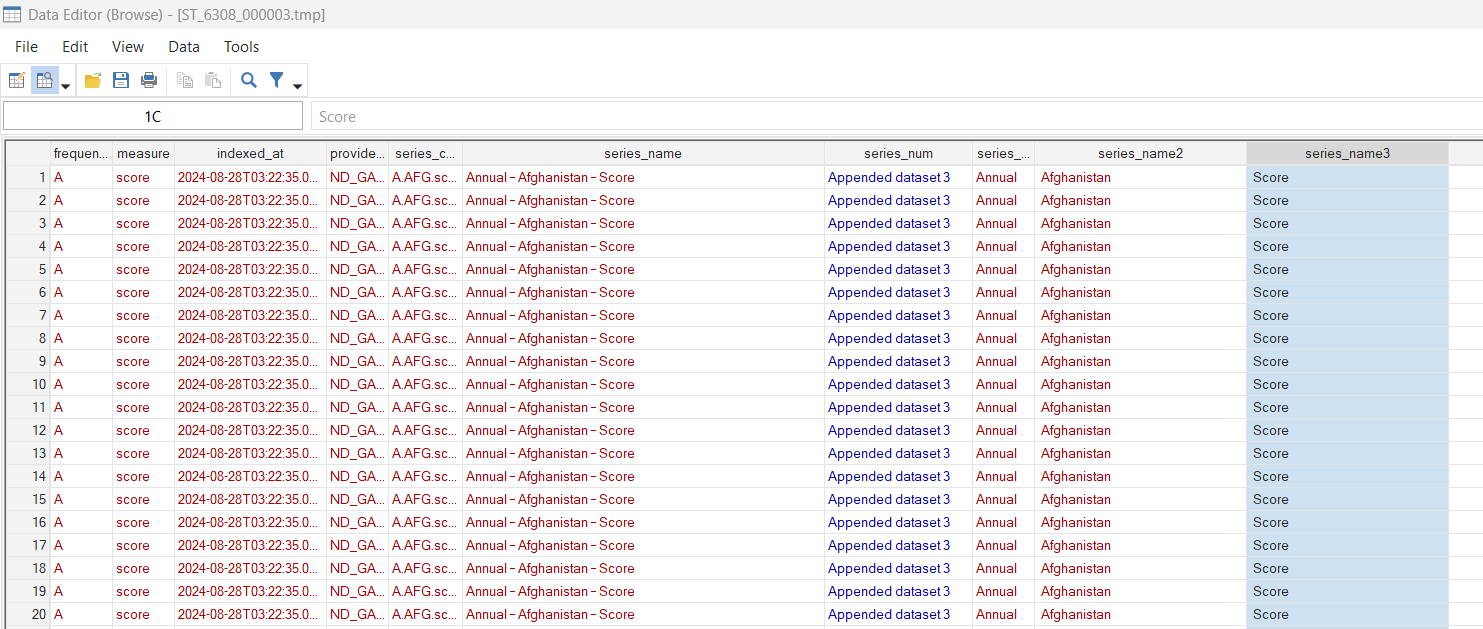
Then, apply a bunch of code presented in my series of blogs on DBnomics to have a panel dataset and save the data:
rename   value FOOD_03
destring FOOD_03, replace force
encode   series_name2, generate(cn)
*keep     cn country period FOOD_03
order    cn country period FOOD_03

kountry  country, from(iso3c) to(imfn) m
list     cn country _IMFN_ MARKER ///
         if period == 2020 & MARKER == 0
drop     if MARKER == 0
drop     NAMES_STD MARKER
rename   _IMFN_ imfcode
order    cn country imfcode period
keep     cn country imfcode period FOOD_03
drop     if imfcode==.

xtset    imfcode period
xtdes

save     FOOD_03_ND.dta, replace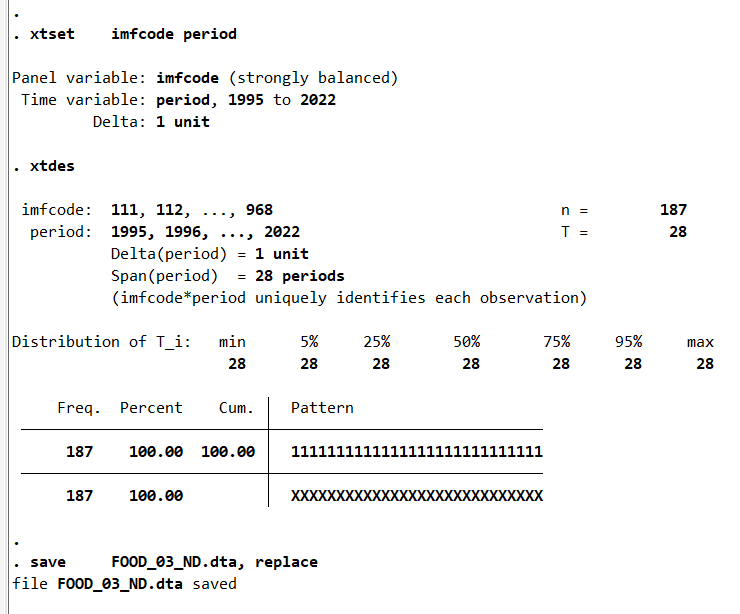
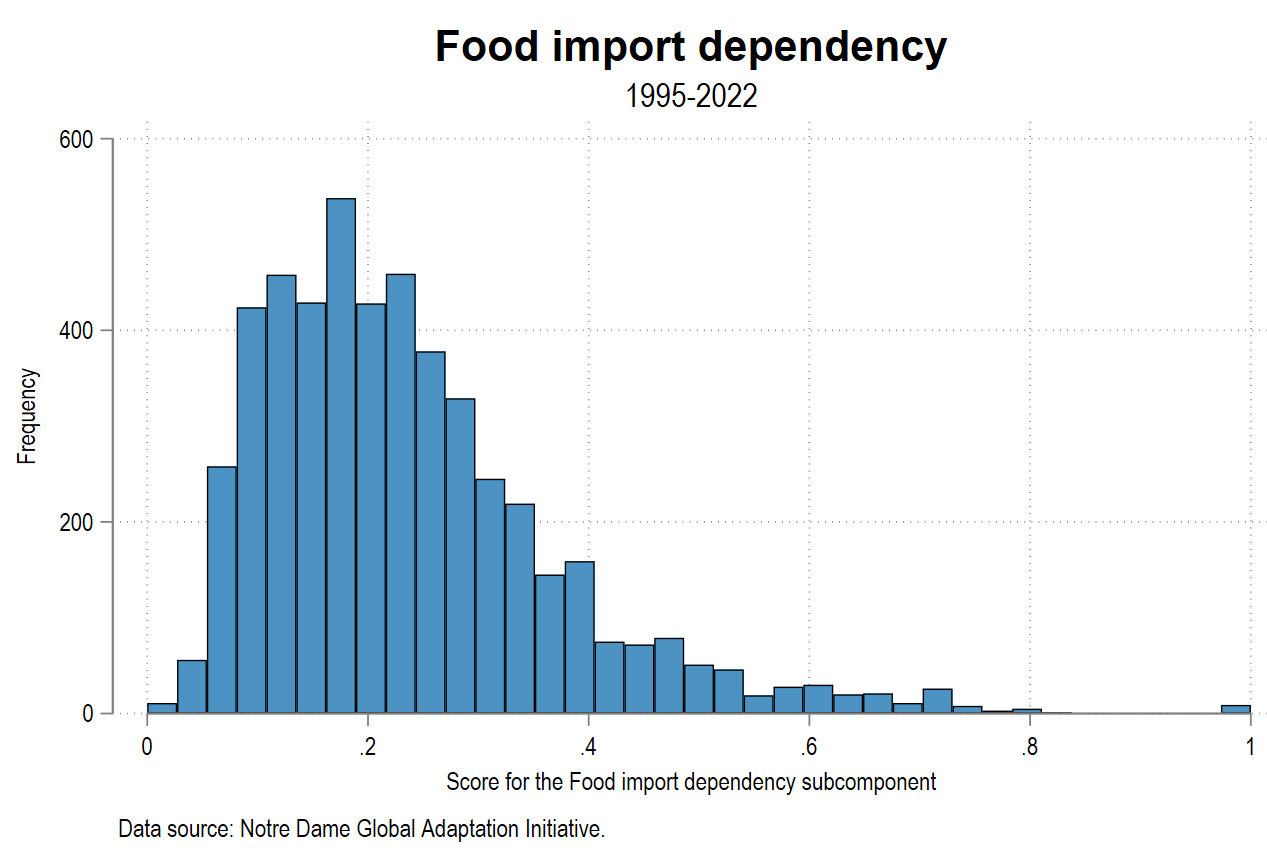
To conclude, you can visualize the distribution of the data with a histogram:
set scheme white_tableau
graph set window fontface "Arial Narrow"

histogram FOOD_03, frequency ///
 title("{fontface Arial Bold:Food import dependency}") ///
 subtitle("1995-2002") ///
 xtitle("Score for the Food import dependency subcomponent") ///
 note("Data source: Notre Dame Global Adaptation Initiative." ///
 , size(small))