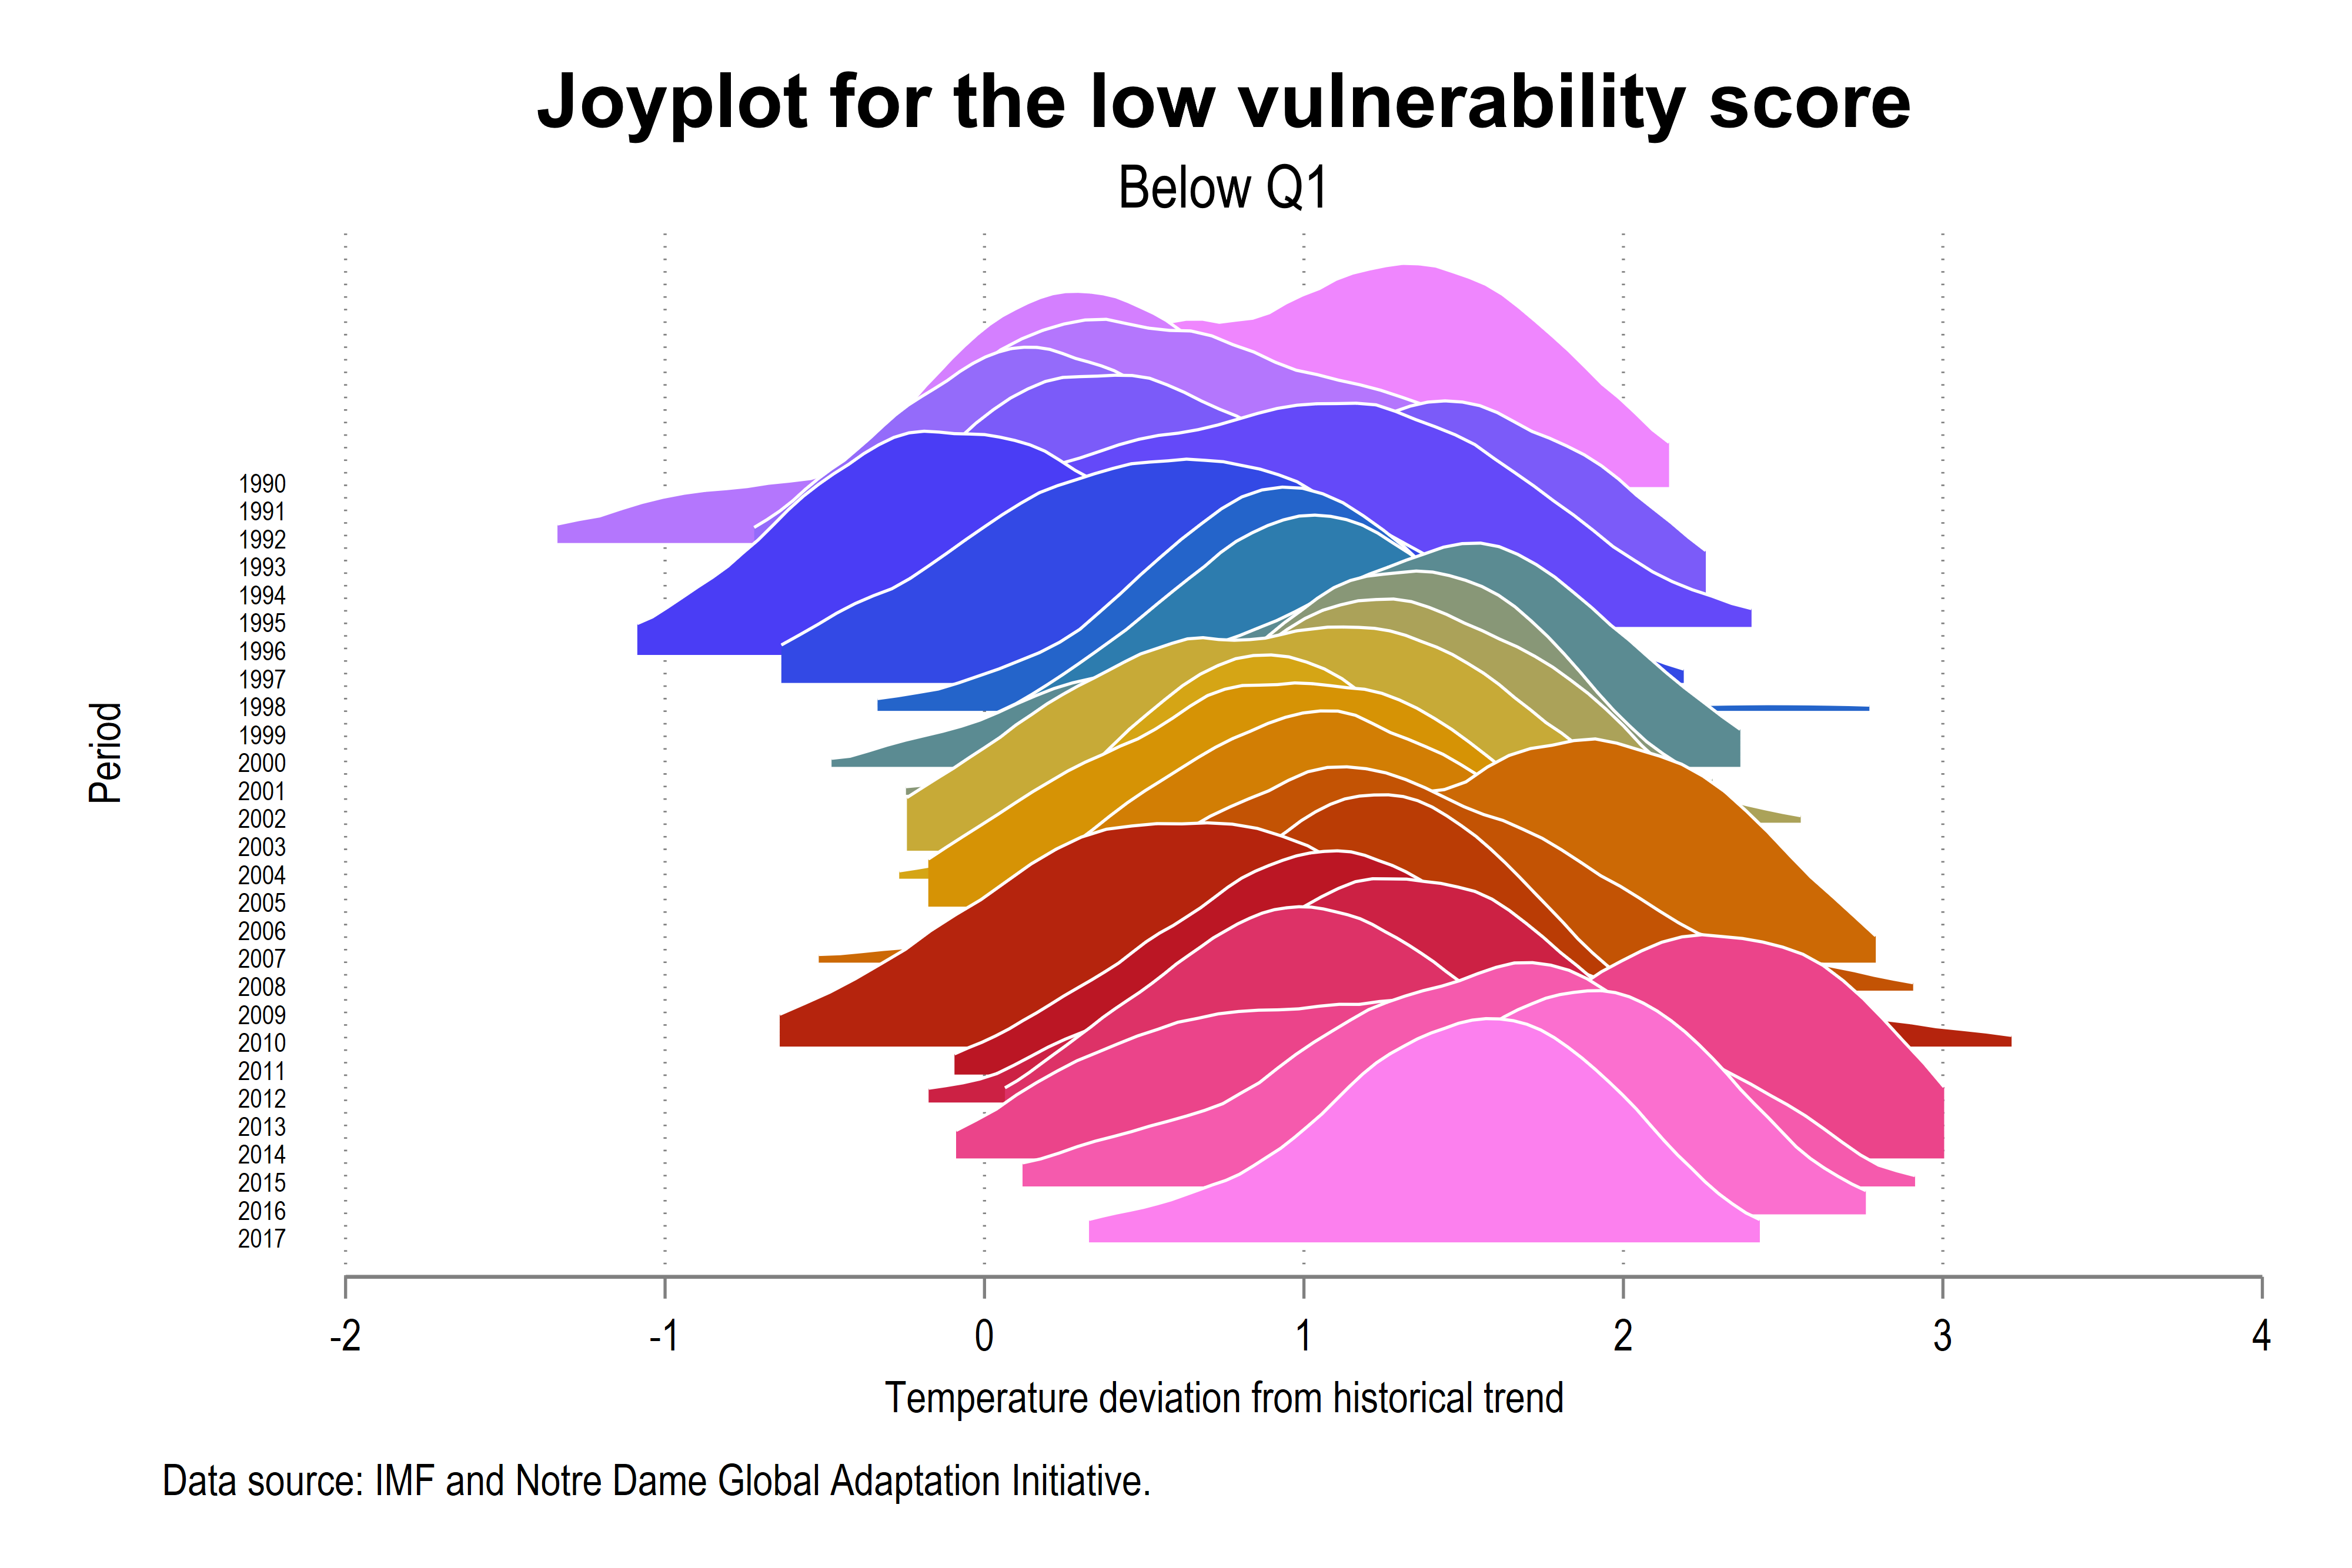
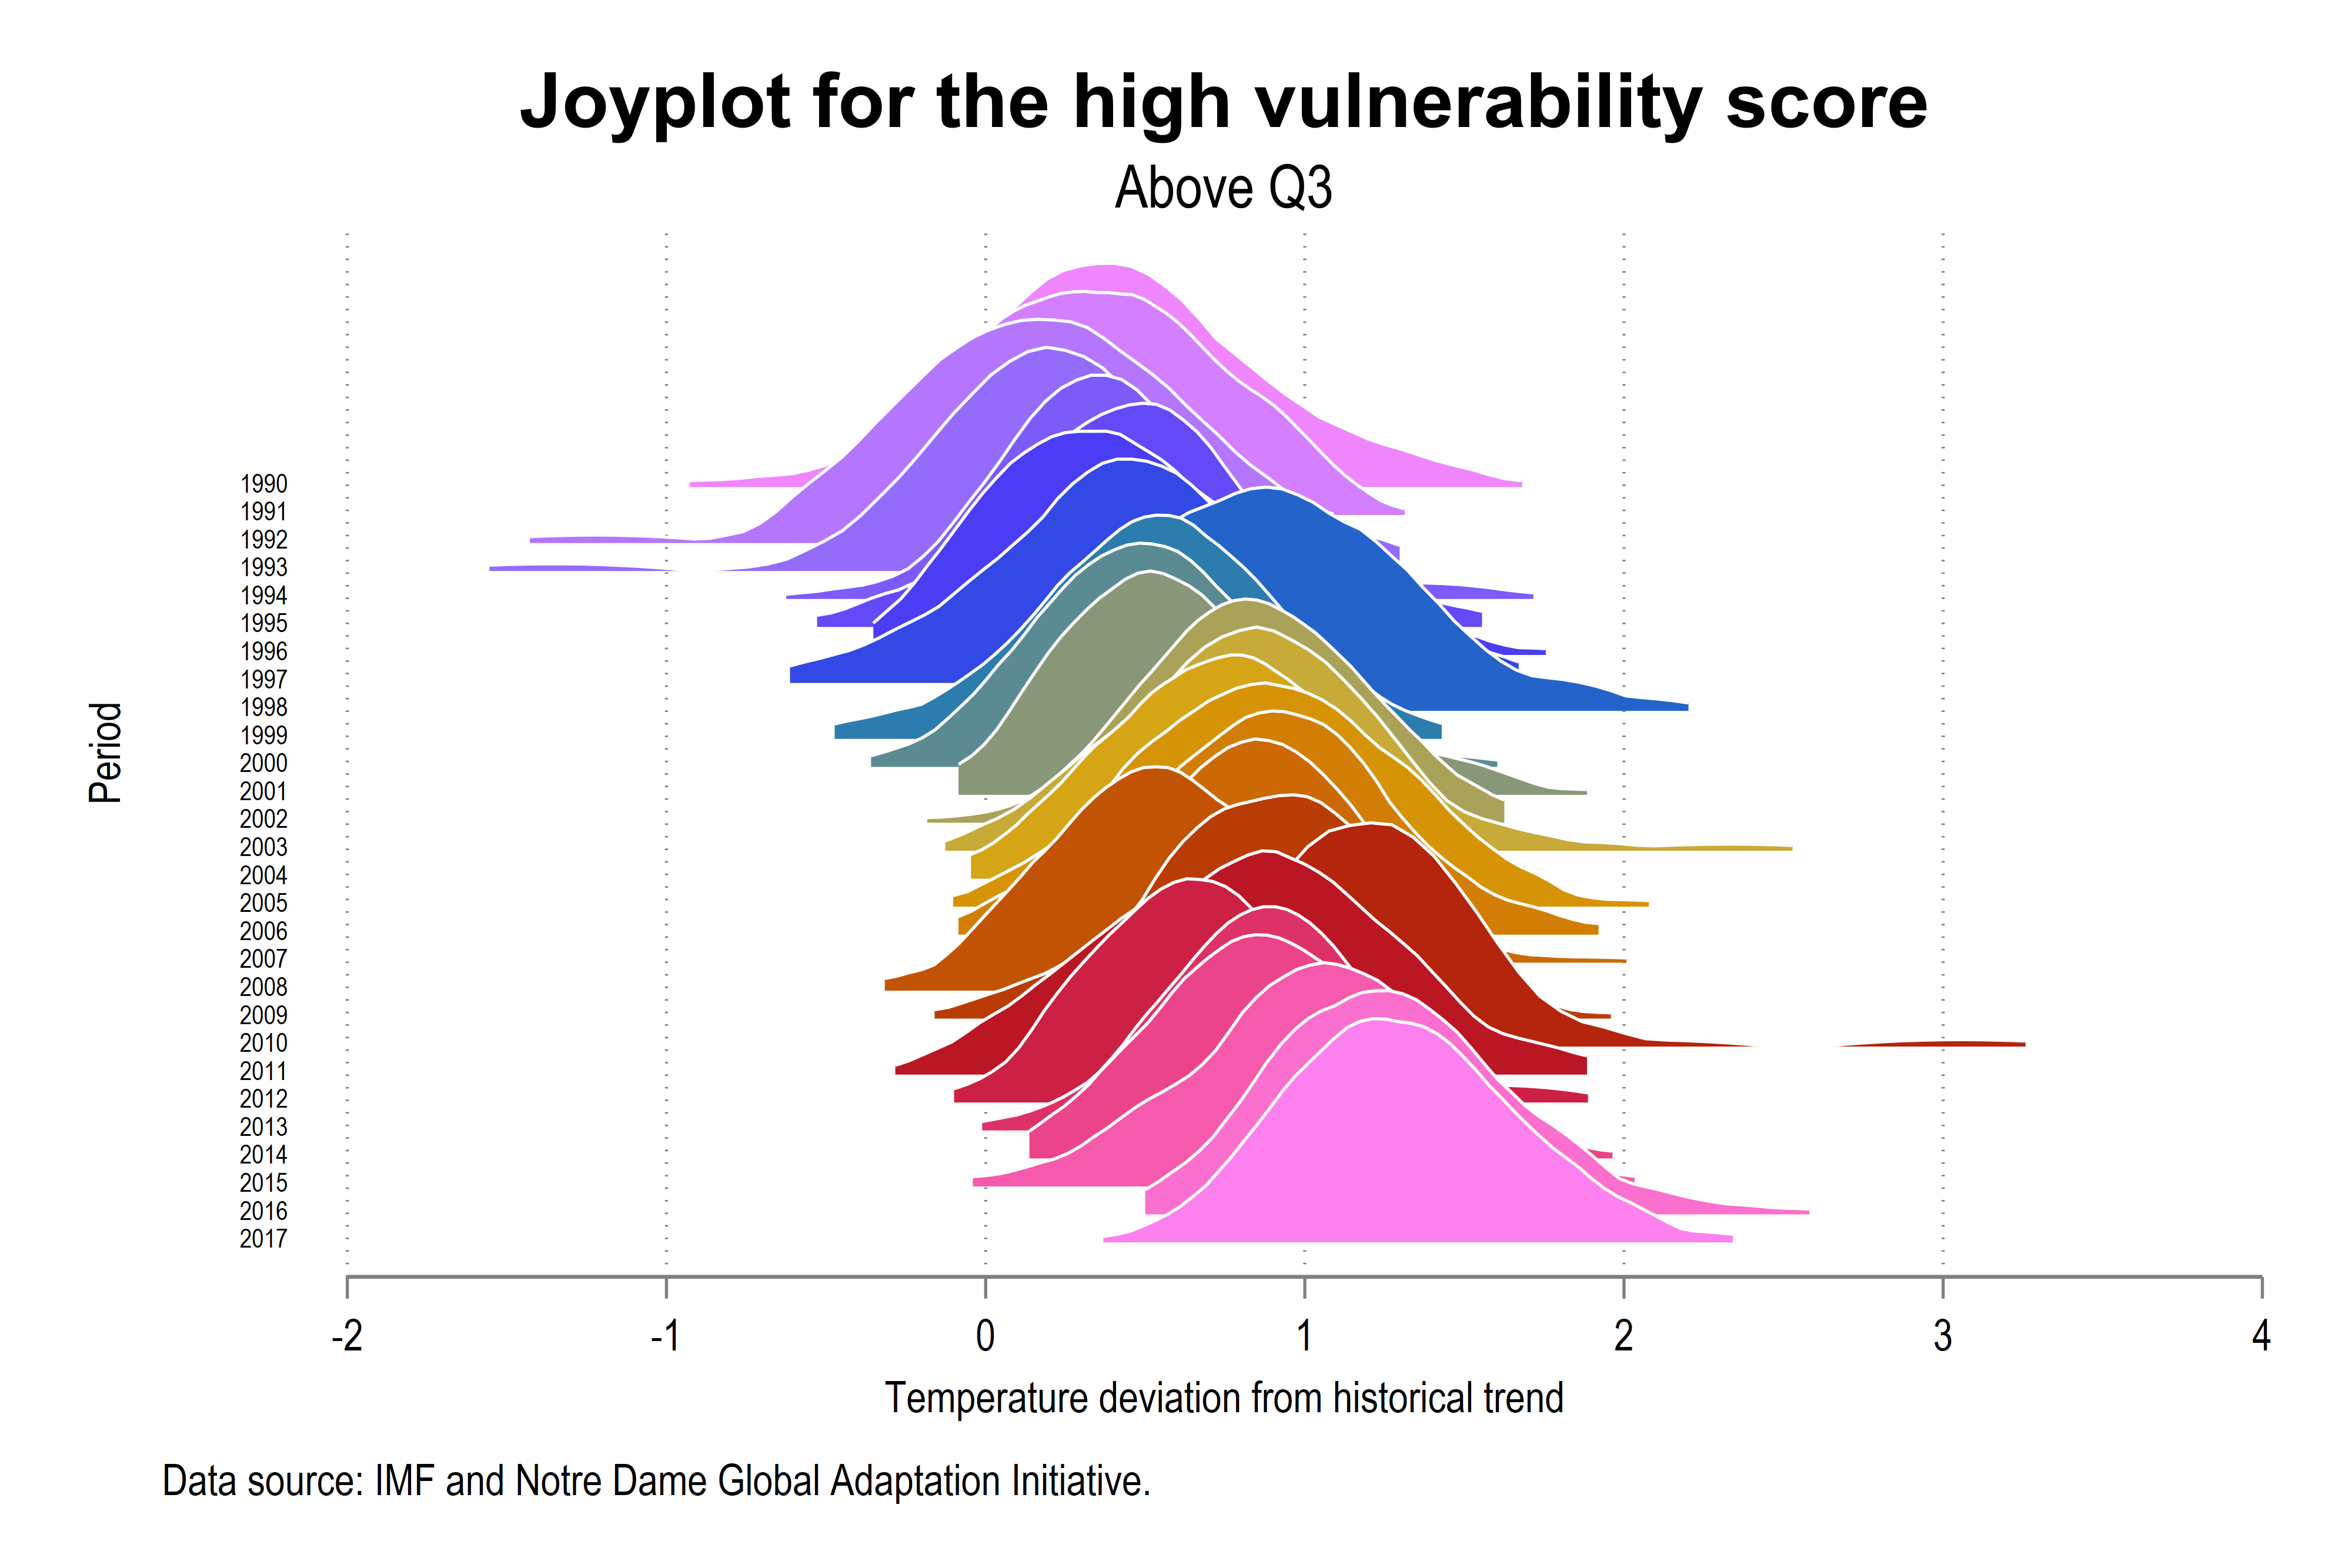
In the last version of my working paper on the impact of climate risk on fiscal space, we use Joyplots to visualize the distribution of the ND-GAINS vulnerability scores across time.
Thanks to Asjad Naqvi, we can produce Joyplots with Stata. I produce a Joyplot to visualize the distribution of temperature deviation from historical trend (International Monetary Fund) for two different groups of vulnerable countries (University of Notre-Dame). I thank William Ginn for sending me the temperature data.
// Joyplots

set scheme white_tableau
graph set window fontface "Arial Narrow"

joyplot TEMP if mean_vul< .3722011 & period<2018, by(period) name(JoyplotTEMPQ1, replace) ///
 overlap(8) bwid(0.3) palette(CET C1) alpha(100) ///
 lc(white) lw(0.2) xlabel(-2(1)4) off(-0.5) norm(local) ///
 xtitle("Temperature deviation from historical trend") ytitle("Period") ///
 title("{fontface Arial Bold:Joyplot for the low vulnerability score}") ///
 subtitle("Below Q1")  ///
 note("Data source: IMF Notre Dame Global Adaptation Initiative.", size(small))
graph export joyTEMPQ1.png, as(png) width(4000) replace

joyplot TEMP if mean_vul> .5174853 & period<2018, by(period) name(JoyplotTEMPQ3, replace) ///
 overlap(8) bwid(0.2) palette(CET C1) alpha(100) ///
 lc(white) lw(0.2) xlabel(-2(1)4) off(-0.25) norm(local) ///
 xtitle("Temperature deviation from historical trend") ytitle("Period") ///
 title("{fontface Arial Bold:Joyplot for the high vulnerability score}") ///
 subtitle("Above Q3")  ///
 note("Data source: IMF and Notre Dame Global Adaptation Initiative.", size(small))
graph export joyTEMPQ3.png, as(png) width(4000) replace
The name ‘joyplot’ “refers to the classic 1979 Joy Division “Unknown Pleasures” album cover, which was in actuality a joyplot of radio intensities from the first known pulsar. The album cover reproduced the design from a 1971 Scientific American article about pulsars.”

This joint work is written with John Beirne, Donghyun Park and Gazi Salah Uddin: SSRN.
Our causal identification relies on the fact that government bond yields and sovereign ratings on foreign currency debt do not influence changes in the ND-GAIN vulnerability scores at any horizon.
Key results:
– Political stability reduces the fiscal impact of climate vulnerability risks
– Financial development also limits the climate risk premium
– The most vulnerable economies face the largest climate-related fiscal risks
Religious tensions are the most impactful form of political instability
– State-dependence confirms subsample analyses
– Stable politics and strong markets together mitigate fiscal risks