I wisely started with a map, and made the story fit (generally with meticulous care for distances).
J. R. R. Tolkien (1954)
In this blog, I will show that it is quite simple to draw maps with Stata. I am inspired by the fantastic blogs of Friedrich Huebler and Anders Sundell.
(A) Firstly, you need to install the following packages made by Maurizio Pisati and Kevin Crow. You need to install the packages only once:
ssc install spmap

ssc install shp2dta

ssc install mif2dta
(B) Then, you convert shapefile to Stata format. You have to select and download only once the freely usable maps that you want to use on the following website
http://www.naturalearthdata.com/
capture shp2dta using ne_10m_admin_0_countries, data(worlddata) ///
coor(worldcoor) genid(id)
(C) You can now draw maps with Stata:
use worlddata.dta, replace
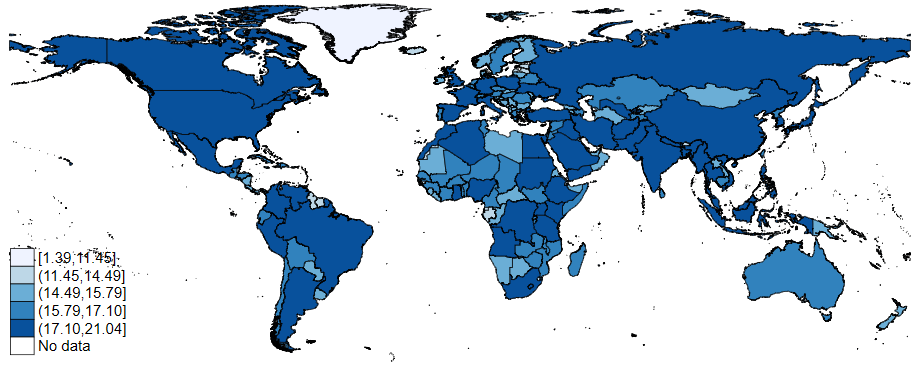
generate LPOP = ln(POP_EST)
format LPOP %4.2f
order id LPOP REGION_UN, first
spmap LPOP using worldcoor.dta if ADMIN!="Antarctica", id(id) ///
fcolor(Blues) clnumber(5) legend(symy(*2) symx(*2) size(*2)) legorder(lohi)
capture graph rename Graph map_world, replace
capture graph export map_world.png, replace
capture graph export map_world.pdf, replaceI get the following map which represents the log of the estimated population:
(D) Now, I will show how to draw regional maps. You have to download (only once) the ID file and the maps with the coordinates, which are available on the following website
I will draw a map with the length of the countries’ names:
use idfile.dta, replace

generate length = length(ADMIN)

spmap length using "coord_mercator_europe.dta", id(na_id_world) fcolor(RdYlGn) ///
osize(vvthin vvthin vvthin vvthin) ndsize(vvthin) ndfcolor(gray) ///
title("length")

capture graph rename Graph map_euro, replace
capture graph export map_euro.png, replace
capture graph export map_euro.pdf, replace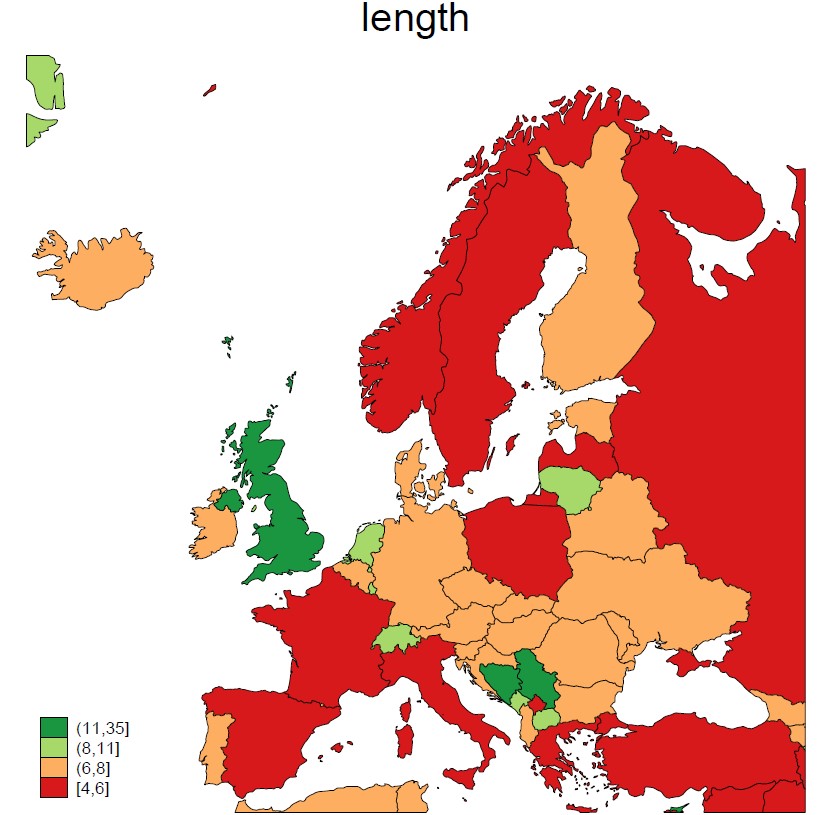
(E) Now, I will download some political data (source, you need to request the data to the University of Gothenburg’s varieties of Democracy Institute) and merge it with the file containing the identifiers (IDfile.dta) to draw a map with some data:
use "C:\Users\jamel\stata\maps\V-Dem-CY-Core-v11.1.dta", clear
keep if year==2018
merge 1:m country_id using "idfile.dta", nogenerate

spmap v2x_libdem using "coord_mercator_europe.dta", id(na_id_world) ///
fcolor(RdYlGn) osize(vvthin vvthin vvthin vvthin) ndsize(vvthin)   ///
title("V-Dem Liberal democracy index")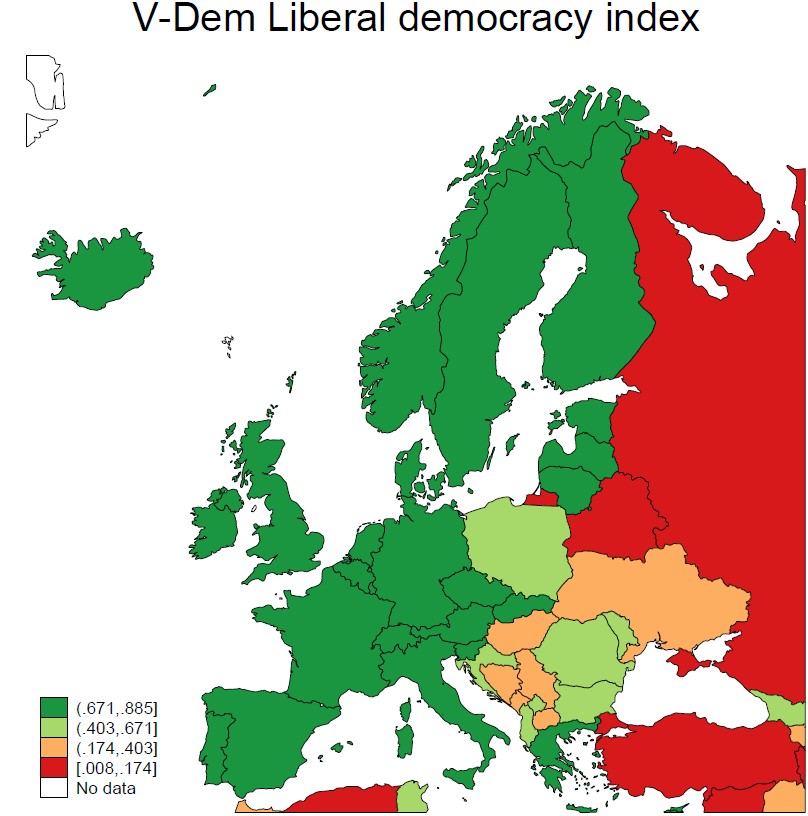
(E) Now, I will download some economic data directly from the World Bank (It takes times, you need a good internet connexion) and merge it with the file containing the identifiers (IDfile.dta) to draw a map with some data:
ssc install wbopendata // Only once

wbopendata, language(en - English) country() topics(3 - Economy & Growth) ///
indicator() long clear

// Save the data
save ///
"C:\...\wb_topics_3.dta", ///
replace
I downloaded the data from the World Bank, I can now draw of a map for the current income per capita expressed in US dollars. I change the name of three countries, because they have not the same form in the IDfile and in the World Bank data (Russia is Russian Federation in the World Bank database, for example):
use wb_topics_3, replace

keep if year==2016
keep if indic==178

rename countryname country_name

replace country_name = "Russia" in 201

replace country_name = "Slovakia" in 213

replace country_name = "Macedonia" in 179

merge 1:m country_name using "idfile.dta", nogenerate

format value %5.0f

spmap value using "coord_mercator_europe.dta", id(na_id_world) ///
fcolor(RdYlGn) osize(vvthin vvthin vvthin vvthin vvthin vvthin) ///
ndsize(vvthin) clmethod(quantile) clnumber(6) ///
title("Income per capita (Current USD)")

capture graph rename Graph map_euro_wb, replace
capture graph export map_euro_wb.png, replace
capture graph export map_euro_wb.pdf, replace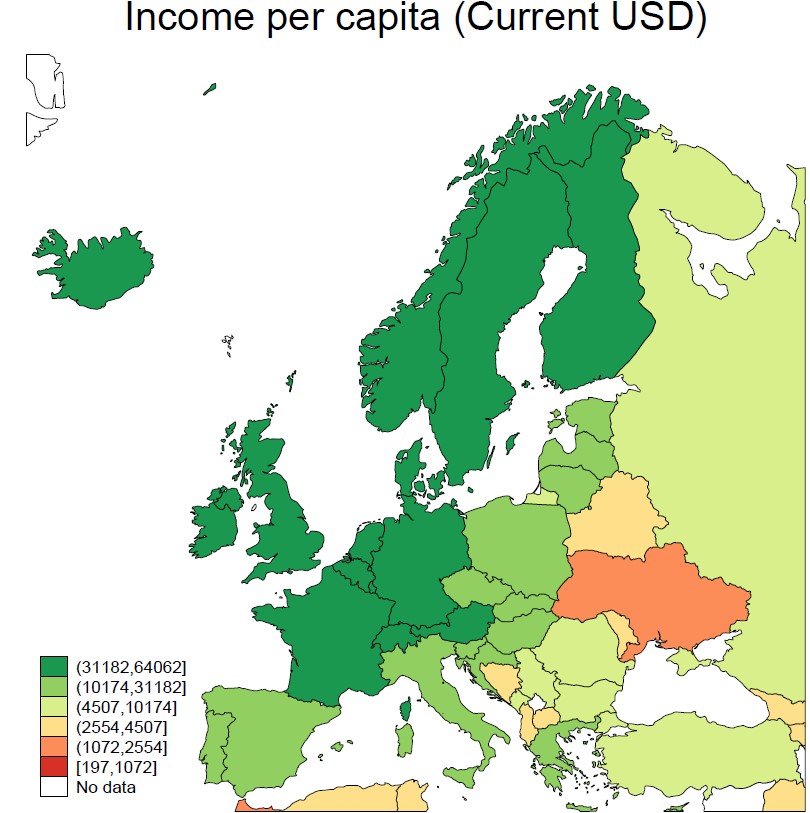
In five simple steps, you will manage to draw nice and interesting maps with Stata.
*Drawing maps with stata
*-------------------------------------------------------------------------

version 16.1
set more off
cd "C:\...\maps" // Set the directory
capture log close
log using maps.smcl, replace


// Required packages to draw maps (only once)

*ssc install spmap

*ssc install shp2dta

*ssc install mif2dta

// Step 1: Convert shapefile to Stata format
*https://huebler.blogspot.com/2012/08/stata-maps.html

// Download maps (Admin 0 - Countries) (Only once)
*http://www.naturalearthdata.com/downloads/10m-cultural-vectors/

capture shp2dta using ne_10m_admin_0_countries, data(worlddata) ///
coor(worldcoor) genid(id)

// Step 2: Draw map with Stata

use worlddata.dta, replace

generate LPOP = ln(POP_EST)

format LPOP %4.2f

order id LPOP REGION_UN, first

spmap LPOP using worldcoor.dta if ADMIN!="Antarctica", id(id) ///
fcolor(Blues) clnumber(5) legend(symy(*2) symx(*2) size(*2)) legorder(lohi)

capture graph rename Graph map_world, replace
capture graph export map_world.png, replace
capture graph export map_world.pdf, replace

// Regional maps
*https://www.stathelp.se/en/spmap_world_en.html

use idfile.dta, replace

generate length = length(ADMIN)

spmap length using "coord_mercator_world.dta", id(na_id_world) fcolor(RdYlGn)

spmap length using "coord_mercator_world.dta", id(na_id_world) ///
fcolor(RdYlGn) osize(vvthin vvthin vvthin vvthin) ndsize(vvthin)   ///
title("Length")

spmap length using "coord_lambert_europe.dta", id(na_id_world) fcolor(RdYlGn) ///
osize(vvthin vvthin vvthin vvthin) ndsize(vvthin) ndfcolor(gray) ///
title("length")

spmap length using "coord_mercator_europe.dta", id(na_id_world) fcolor(RdYlGn) ///
osize(vvthin vvthin vvthin vvthin) ndsize(vvthin) ndfcolor(gray) ///
title("length")

capture graph rename Graph map_euro, replace
capture graph export map_euro.png, replace
capture graph export map_euro.pdf, replace

// Democracy index
*https://www.v-dem.net/en/data/data/v-dem-dataset-v111/

use "C:\Users\jamel\stata\maps\V-Dem-CY-Core-v11.1.dta", clear
keep if year==2018
merge 1:m country_id using "idfile.dta", nogenerate           //-> Note 1

spmap v2x_libdem using "coord_mercator_world.dta", id(na_id_world) ///
fcolor(RdYlGn) osize(vvthin vvthin vvthin vvthin) ndsize(vvthin)   ///
title("V-Dem Liberal democracy index")

spmap v2x_libdem using "coord_mercator_europe.dta", id(na_id_world) ///
fcolor(RdYlGn) osize(vvthin vvthin vvthin vvthin) ndsize(vvthin)   ///
title("V-Dem Liberal democracy index")

capture graph rename Graph map_euro_demo, replace
capture graph export map_euro_demo.png, replace
capture graph export map_euro_demo.pdf, replace

*https://datahelpdesk.worldbank.org/knowledgebase/articles/889464
*-wbopendata-stata-module-to-access-world-bank-data

*ssc install wbopendata // Only once

*db wbopendata

*Only once

*wbopendata, language(en - English) country() topics(3 - Economy & Growth) ///
*indicator() long clear

*Only once

/*
// Save the data
save ///
"C:\...\wb_topics_3.dta", ///                   //-> Note 2
replace
*/

use wb_topics_3, replace

keep if year==2016
keep if indic==178

rename countryname country_name

replace country_name = "Russia" in 201

replace country_name = "Slovakia" in 213

replace country_name = "Macedonia" in 179

merge 1:m country_name using "idfile.dta", nogenerate

format value %5.0f

spmap value using "coord_mercator_europe.dta", id(na_id_world) ///
fcolor(RdYlGn) osize(vvthin vvthin vvthin vvthin vvthin vvthin) ///
ndsize(vvthin) clmethod(quantile) clnumber(6) ///
title("Income per capita (Current USD)")

capture graph rename Graph map_euro_wb, replace
capture graph export map_euro_wb.png, replace
capture graph export map_euro_wb.pdf, replace

// Save the data
save ///
"C:\...\maps.dta", ///
replace

log close
exit

Description
-----------

This file aims at drawing maps with stata.

Notes :
-------

1) The QoG data can also act as a key if you want to add data from other
sources; it for instance includes World Bank country codes. Use merge to
add more data.

2) Replace ... with you own directory path.
6 Comments
[…] Drawing Maps with Stata Drawing maps with Stata for the NUTS regions […]
Assalamalikum
I am looking for this data, see below, please.
use worlddata.dta, replace
Thanks
Naqeeb ur Rehman
Dear Naqeeb,
The file is available on my GitHub.
Regards,
Jamel
[…] Drawing Maps with Stata Burgernomics: clearly explained! Unbiased estimator for population variance: clearly explained! […]
[…] of the European Commission (The Statistical Atlas) and a second one on how to draw maps with Stata (Drawing Maps With Stata), in this blog, I will show you how to draw maps with Stata for the NUTS regions. The acronym NUTS […]
The next step will be to draw maps for the NUTS regions: https://www.jamelsaadaoui.com/the-statistical-atlas/