After a first blog about the Statistical Atlas of the European Commission (The Statistical Atlas) and a second one on how to draw maps with Stata (Drawing Maps With Stata), in this blog, I will show you how to draw maps with Stata for the NUTS regions. The acronym NUTS is for the French, Nomenclature des Unités Territoriales Statistiques (NUTS).
I am inspired by the work of Asjad Naqvi (medRxiv.org) and his code (COUNTRY_GIS_setup.do). I am grateful to him. In the following video, you will see the result of my simplified Stata Code.
Before moving to the Stata code to draw the maps, we have to download (only once), the maps on the GISCO website: https://gisco-services.ec.europa.eu/distribution/v2/nuts/. I use the following maps (be careful the code does not work with all the maps). You have to unzip the file in your own current directory:
- NUTS_RG_03M_2021_4326_LEVL_0.shp.zip
- NUTS_RG_03M_2021_4326_LEVL_1.shp.zip
- NUTS_RG_03M_2021_4326_LEVL_2.shp.zip
- NUTS_RG_03M_2021_4326_LEVL_3.shp.zip
NUTS 0
We start with highest level of aggregation, namely, the countries. First, you have to decode the data and prepare the coordinates:
spshape2dta NUTS_RG_03M_2021_4326_LEVL_0, replace saving(nuts0)

use nuts0, clear
ren NUTS_ID nuts0_id
cap ren NAME_LATN nuts0_name
cap ren NUTS_NAME nuts0_name
drop if CNTR_CODE=="TR" // Drop Turkey for now
compress
sort _ID
save, replace

use nuts0_shp, clear
merge m:1 _ID using nuts0
drop if _m!=3
*drop if _ID==75 // Remove Svalbard
keep _ID _X _Y
keep if _X > -25 & _Y >30 // Get rid of the small islands
geo2xy _Y _X, proj (lambert_sphere) replace
sort _ID
save, replace
Then, you can draw a map with the length of the countries’ names for the NUTS 0 level. I choose the Lambert projection since it does not give a disportionate size for Scandinavia:
// Draw a map

use nuts0, clear

generate length = length(NUTS_NAME)

spmap length using nuts0_shp, id(_ID) fcolor(RdYlGn)

capture graph rename Graph map_nuts0, replace
capture graph export map_nuts0.png, replace
capture graph export map_nuts0.pdf, replace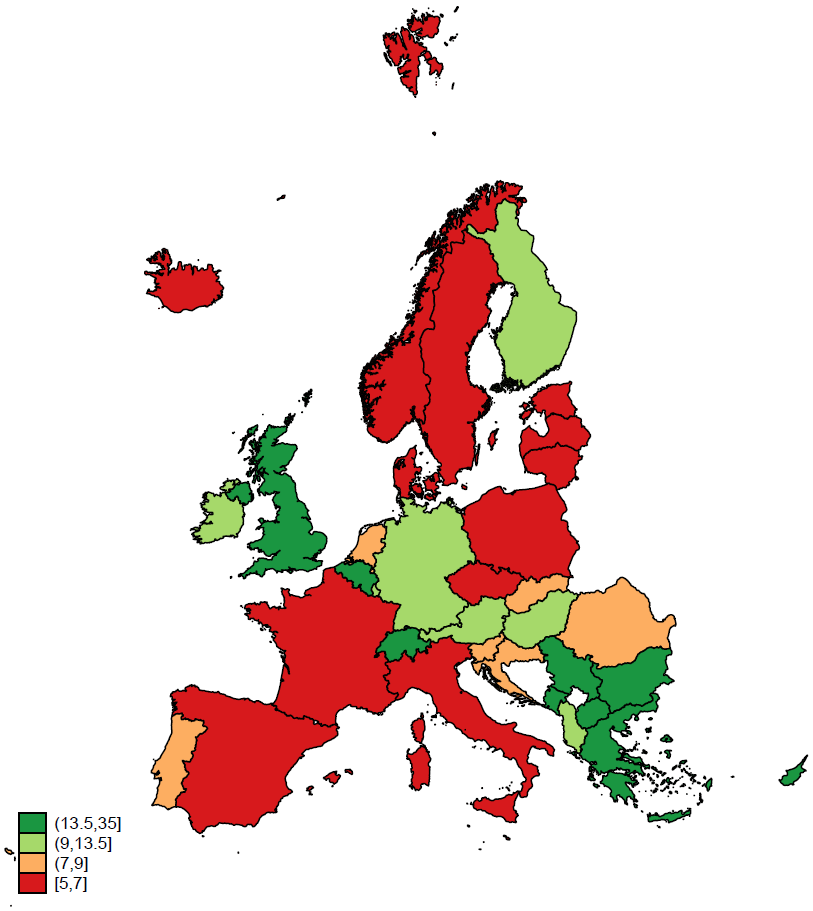
NUTS 1
We continue with the second-highest level of aggregation, namely, the NUTS 1 regions. First, you have to decode the data and prepare the coordinates:
spshape2dta NUTS_RG_03M_2021_4326_LEVL_1, replace saving(nuts1)

use nuts1, clear
ren NUTS_ID nuts1_id
cap ren NAME_LATN nuts1_name
cap ren NUTS_NAME nuts1_name
drop if CNTR_CODE=="TR" // Drop Turkey for now
compress
sort _ID
save, replace

use nuts1_shp, clear
merge m:1 _ID using nuts1
drop if _m!=3
*drop if _ID==75 // Remove Svalbard
keep _ID _X _Y
keep if _X > -25 & _Y >30 // Get rid of the small islands
geo2xy _Y _X, proj (lambert_sphere) replace
sort _ID
save, replace
Then, you can draw a map with the length of the countries’ names for the NUTS 1 level. Again, I choose the Lambert projection since it does not give a disproportionate size for Scandinavia:
// Draw a map

use nuts1, clear

generate length = length(NUTS_NAME)

spmap length using nuts1_shp, id(_ID) fcolor(RdYlGn)

capture graph rename Graph map_nuts1, replace
capture graph export map_nuts1.png, replace
capture graph export map_nuts1.pdf, replace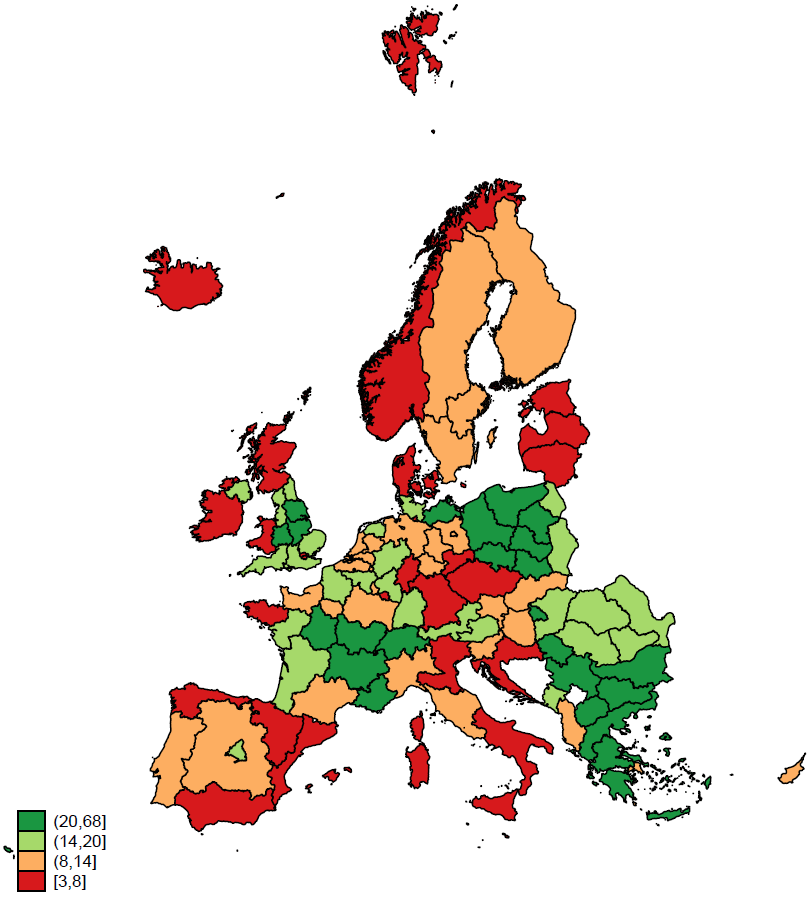
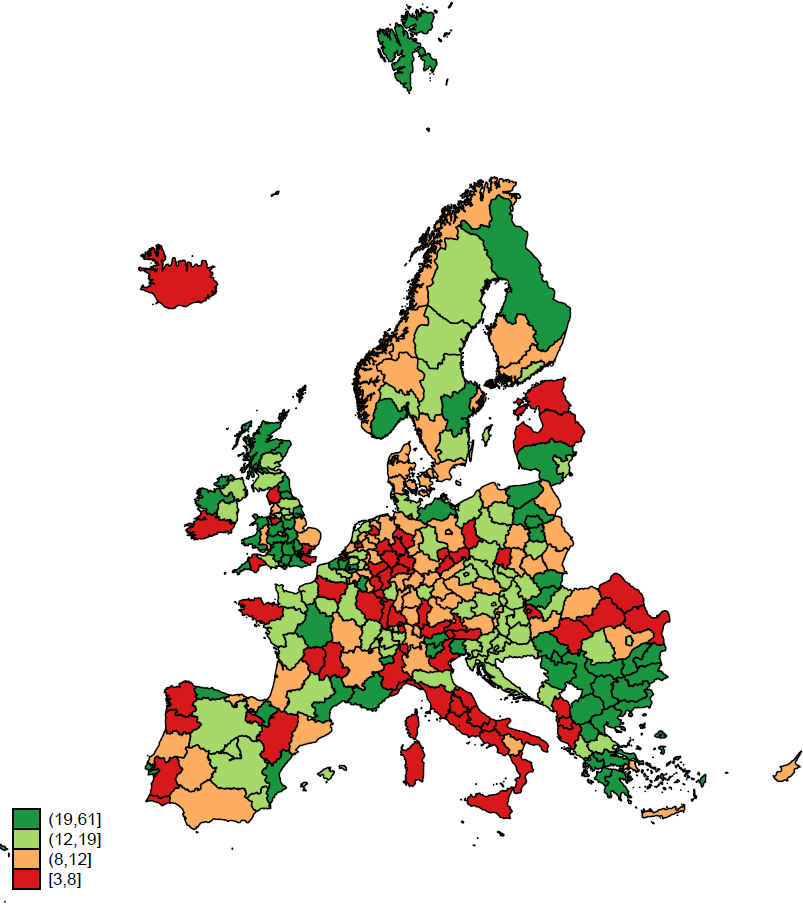
NUTS 2
We continue with the third-highest level of aggregation, namely, the NUTS 2 regions. First, you have to decode the data and prepare the coordinates:
spshape2dta NUTS_RG_03M_2021_4326_LEVL_2, replace saving(nuts2)

use nuts2, clear
ren NUTS_ID nuts2_id
cap ren NAME_LATN nuts2_name
cap ren NUTS_NAME nuts2_name
drop if CNTR_CODE=="TR" // Drop Turkey for now
compress
sort _ID
save, replace

use nuts2_shp, clear
merge m:1 _ID using nuts2
drop if _m!=3
*drop if _ID==75 // Remove Svalbard
keep _ID _X _Y
keep if _X > -25 & _Y >30 // Get rid of the small islands
geo2xy _Y _X, proj (lambert_sphere) replace
sort _ID
save, replace
Then, you can draw a map with the length of the countries’ names for the NUTS 2 level. Again, I choose the Lambert projection since it does not give a disproportionate size for Scandinavia:
// Draw a map

use nuts2, clear

generate length = length(NUTS_NAME)

spmap length using nuts2_shp, id(_ID) fcolor(RdYlGn)

capture graph rename Graph map_nuts2, replace
capture graph export map_nuts2.png, replace
capture graph export map_nuts2.pdf, replace
NUTS 3
We conclude with the lowest level of aggregation, namely, the NUTS 3 regions. First, you have to decode the data and prepare the coordinates:
spshape2dta NUTS_RG_03M_2021_4326_LEVL_3, replace saving(nuts3)

use nuts3, clear
ren NUTS_ID nuts3_id
cap ren NAME_LATN nuts3_name
cap ren NUTS_NAME nuts3_name
drop if CNTR_CODE=="TR" // Drop Turkey for now
compress
sort _ID
save, replace

use nuts3_shp, clear
merge m:1 _ID using nuts3
drop if _m!=3
*drop if _ID==75 // Remove Svalbard
keep _ID _X _Y
keep if _X > -25 & _Y >30 // Get rid of the small islands
geo2xy _Y _X, proj (lambert_sphere) replace
sort _ID
save, replace
Then, you can draw a map with the length of the countries’ names for the NUTS 3 level. Again, I choose the Lambert projection since it does not give a disproportionate size for Scandinavia:
// Draw a map

use nuts3, clear

generate length = length(NUTS_NAME)

spmap length using nuts3_shp, id(_ID) fcolor(RdYlGn)

capture graph rename Graph map_nuts3, replace
capture graph export map_nuts3.png, replace
capture graph export map_nuts3.pdf, replace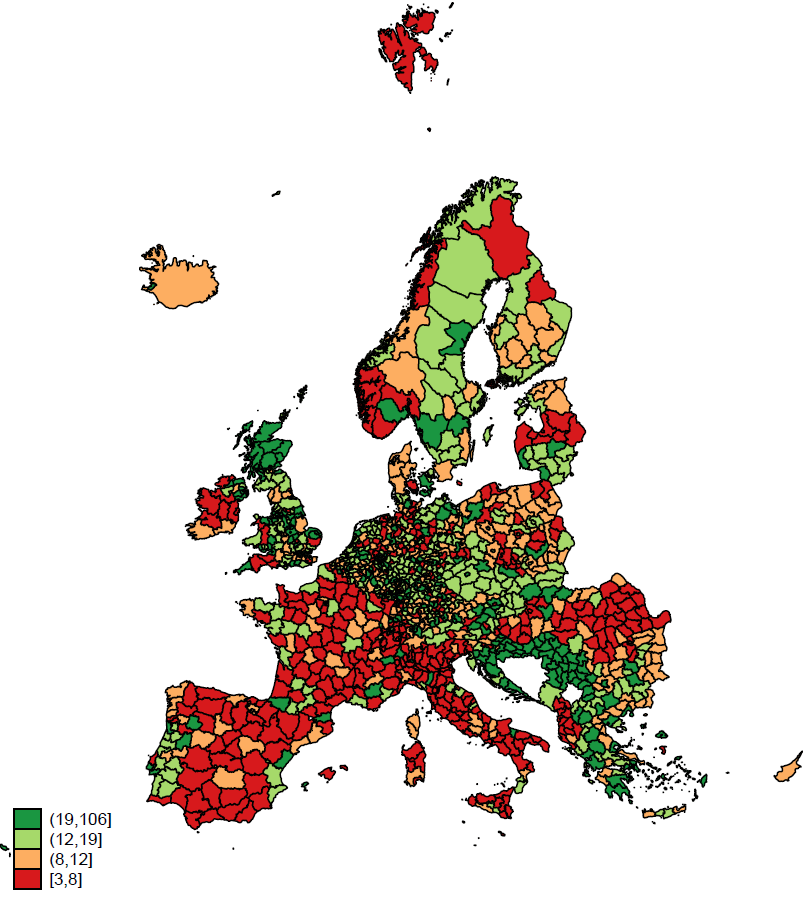
*Drawing maps with Stata for the NUTS regions
*-------------------------------------------------------------------------

version 16.1
set more off
cd "C:\...\maps-nuts" // Set the directory
capture log close
log using maps_nuts_1.smcl, replace

// Original Sources

*https://www.medrxiv.org/content/10.1101/2021.02.15.21251788v1.full

*https://github.com/asjadnaqvi/COVID19-European-Regional-Tracker/
*blob/master/02_dofiles/COUNTRY_GIS_setup.do

*https://ec.europa.eu/eurostat/fr/web/gisco/geodata/reference-data/
*administrative-units-statistical-units/countries

*** NUTS0
spshape2dta NUTS_RG_03M_2021_4326_LEVL_0, replace saving(nuts0)

use nuts0, clear
ren NUTS_ID nuts0_id
cap ren NAME_LATN nuts0_name
cap ren NUTS_NAME nuts0_name
drop if CNTR_CODE=="TR" // drop Turkey for now
compress
sort _ID
save, replace

use nuts0_shp, clear
merge m:1 _ID using nuts0
drop if _m!=3
*drop if _ID==75 // Remove Svalbard
keep _ID _X _Y
keep if _X > -25 & _Y >30 // get rid of the small islands
geo2xy _Y _X, proj (lambert_sphere) replace
sort _ID
save, replace

// Draw a map

use nuts0, clear

generate length = length(NUTS_NAME)

spmap length using nuts0_shp, id(_ID) fcolor(RdYlGn)

capture graph rename Graph map_nuts0, replace
capture graph export map_nuts0.png, replace
capture graph export map_nuts0.pdf, replace

*** NUTS1
spshape2dta NUTS_RG_03M_2021_4326_LEVL_1, replace saving(nuts1)

use nuts1, clear
ren NUTS_ID nuts1_id
cap ren NAME_LATN nuts1_name
cap ren NUTS_NAME nuts1_name
drop if CNTR_CODE=="TR" // drop Turkey for now
compress
sort _ID
save, replace

use nuts1_shp, clear
merge m:1 _ID using nuts1
drop if _m!=3
*drop if _ID==75 // Remove Svalbard
keep _ID _X _Y
keep if _X > -25 & _Y >30 // get rid of the small islands
geo2xy _Y _X, proj (lambert_sphere) replace
sort _ID
save, replace

// Draw a map

use nuts1, clear

generate length = length(NUTS_NAME)

spmap length using nuts1_shp, id(_ID) fcolor(RdYlGn)

capture graph rename Graph map_nuts1, replace
capture graph export map_nuts1.png, replace
capture graph export map_nuts1.pdf, replace

*** NUTS2
spshape2dta NUTS_RG_03M_2021_4326_LEVL_2, replace saving(nuts2)

use nuts2, clear
ren NUTS_ID nuts2_id
cap ren NAME_LATN nuts2_name
cap ren NUTS_NAME nuts2_name
drop if CNTR_CODE=="TR" // drop Turkey for now
compress
sort _ID
save, replace

use nuts2_shp, clear
merge m:1 _ID using nuts2
drop if _m!=3
*drop if _ID==75 // Remove Svalbard
keep _ID _X _Y
keep if _X > -25 & _Y >30 // get rid of the small islands
geo2xy _Y _X, proj (lambert_sphere) replace
sort _ID
save, replace

// Draw a map

use nuts2, clear

generate length = length(NUTS_NAME)

spmap length using nuts2_shp, id(_ID) fcolor(RdYlGn)

capture graph rename Graph map_nuts2, replace
capture graph export map_nuts2.png, replace
capture graph export map_nuts2.pdf, replace

*** NUTS3

spshape2dta NUTS_RG_03M_2021_4326_LEVL_3, replace saving(nuts3)

use nuts3, clear
ren NUTS_ID nuts3_id
cap ren NAME_LATN nuts3_name
cap ren NUTS_NAME nuts3_name
drop if CNTR_CODE=="TR" // drop Turkey for now
compress
sort _ID
save, replace

use nuts3_shp, clear
merge m:1 _ID using nuts3
drop if _m!=3
*drop if _ID==75 // Remove Svalbard
keep _ID _X _Y
keep if _X > -25 & _Y >30 // get rid of the small islands
geo2xy _Y _X, proj (lambert_sphere) replace
sort _ID
save, replace

// Draw a map

use nuts3, clear

generate length = length(NUTS_NAME)

spmap length using nuts3_shp, id(_ID) fcolor(RdYlGn)

capture graph rename Graph map_nuts3, replace
capture graph export map_nuts3.png, replace
capture graph export map_nuts3.pdf, replace

// Save the data
save ///
"C:\...\maps_nuts.dta", ///
replace

log close
exit

Description
-----------

This file aims at drawing maps with stata for the NUTS (0, 1, 2, 3) regions.

Notes :
-------

1) Replace ... with you own directory path.
10 Comments
Hi!
Thanks a lot for providing this great script! 🙂
Do you know how I should proceed when I want to plot a map consisting of regional Identifier on all 3 NUTS-Levels? I have >200 Regions, unfortunately there are not all NUTS2/3, I have 80% NUTS-2 Regions, 10% NUTS-3 and 10% NUTs-1.
Thanks!
Hi!
Thanks for your interest. Try to follow this blog:
NUTS Data with DBnomics on EconMacro
Then, tell me whether it worked.
Kind regards,
Jamel
[…] Drawing maps with Stata for the NUTS regions NUTS Data with DBnomics Drawing maps with Stata for the NUTS regions (Hourly Wages) […]
[…] Drawing maps with Stata for the NUTS regions (Hourly Wages) […]
Do you know if I can find the shape file disaggregated also for African Countries?
See this blog: https://www.jamelsaadaoui.com/
Select the countries that you need.
Kind regards,
Jamel
[…] Drawing maps with Stata for the NUTS regions […]
Hi,
I am in need of the following files: NUTS_RG_03M_2021_4326_LEVL_0.shp.zip
NUTS_RG_03M_2021_4326_LEVL_1.shp.zip
NUTS_RG_03M_2021_4326_LEVL_2.shp.zip
NUTS_RG_03M_2021_4326_LEVL_3.shp.zip
But they are no longer in the provided link. Could you please help me locate it? Your kind assistance is genuinely appreciated.
Hi, thanks for the interest. Try here: https://www.dropbox.com/
Kind regards,
Jamel
Hi,
I am in need of the following files: NUTS_RG_03M_2021_4326_LEVL_0.shp.zip
NUTS_RG_03M_2021_4326_LEVL_1.shp.zip
NUTS_RG_03M_2021_4326_LEVL_2.shp.zip
NUTS_RG_03M_2021_4326_LEVL_3.shp.zip
But they are no longer in the provided link. Could you please help me locate it? Your kind assistance is genuinely appreciated.