After a series of blogs on Maps, I will show how to use GADM data to draw maps for Austria at 4 different administrative levels. I thank Derek Wagner from Stata Corp for useful advice:
https://www.jamelsaadaoui.com/category/maps/
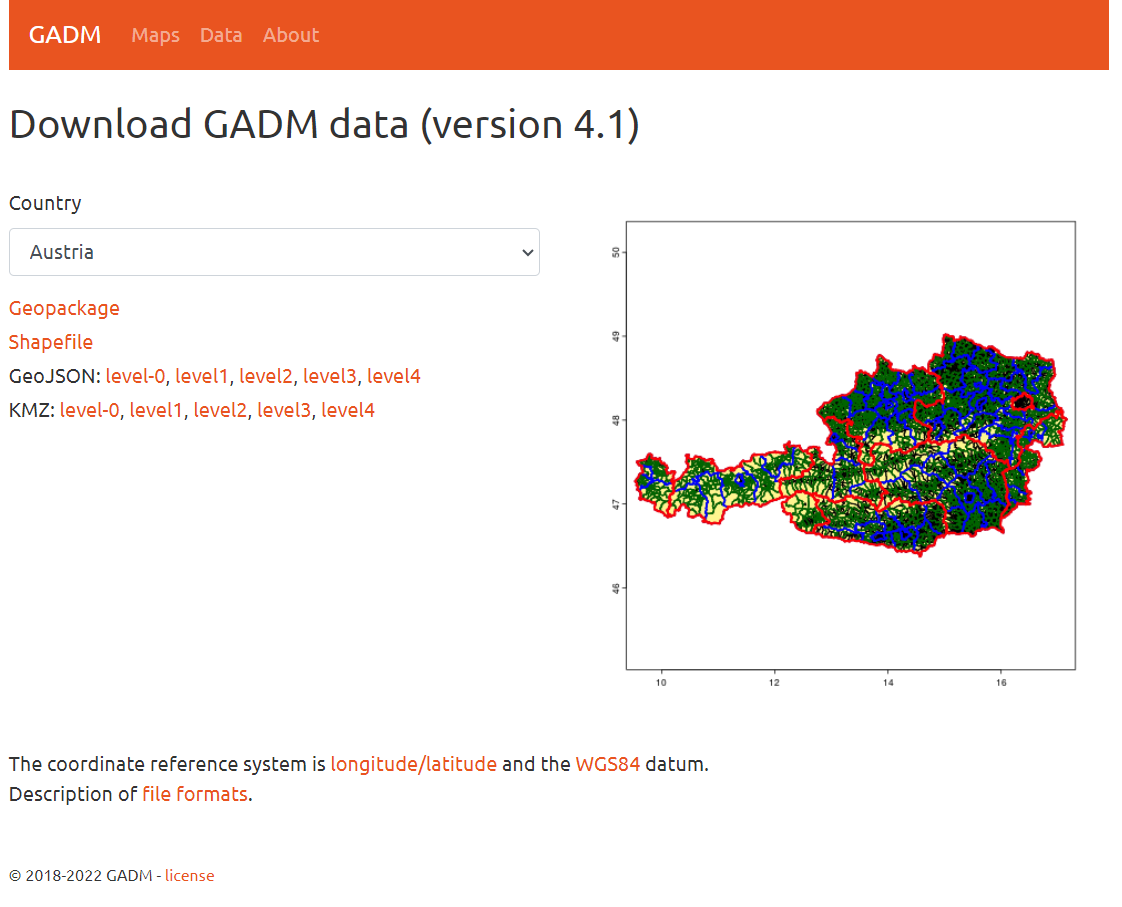
(Step A) I download the maps from the GADM website and I unzip the gadm41_AUT_shp.zip file in my data folder:
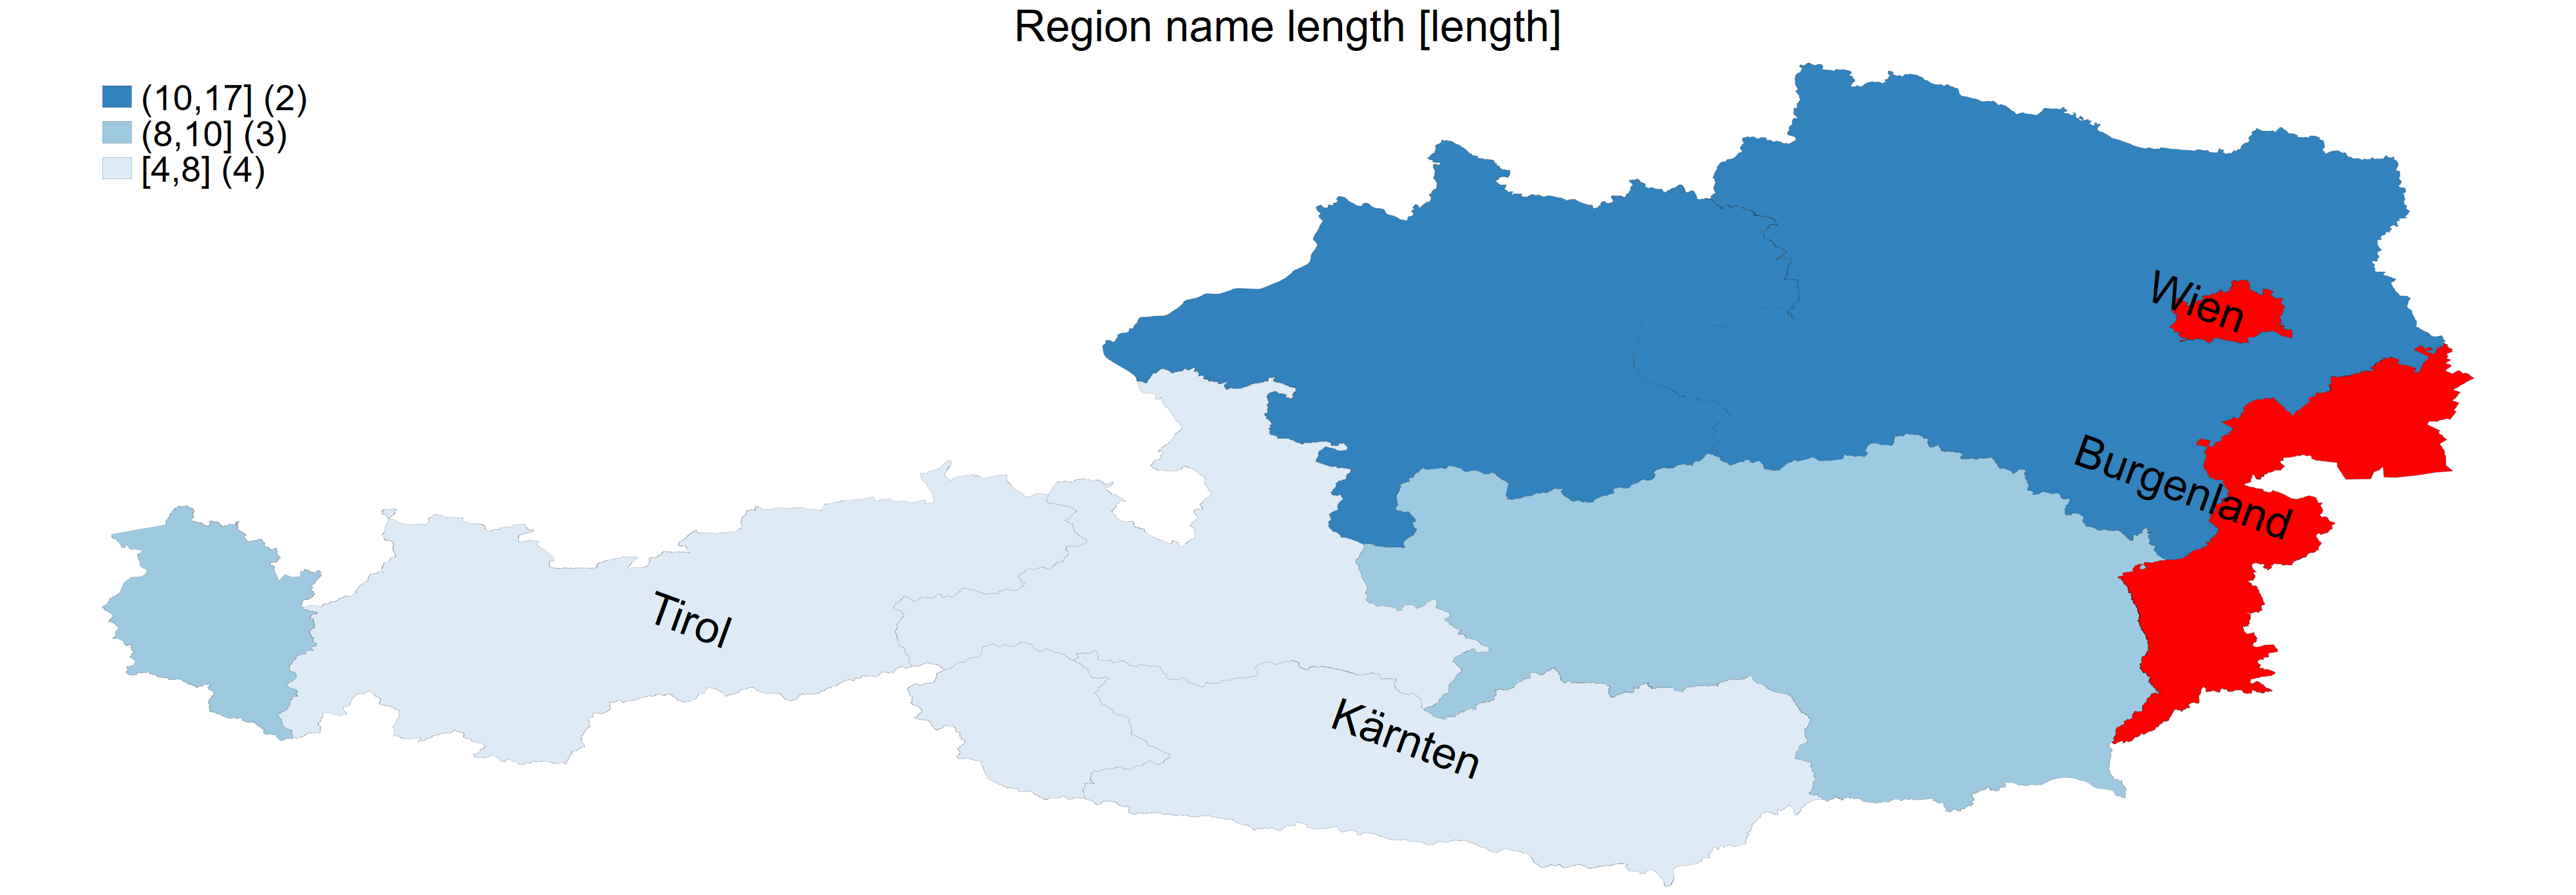
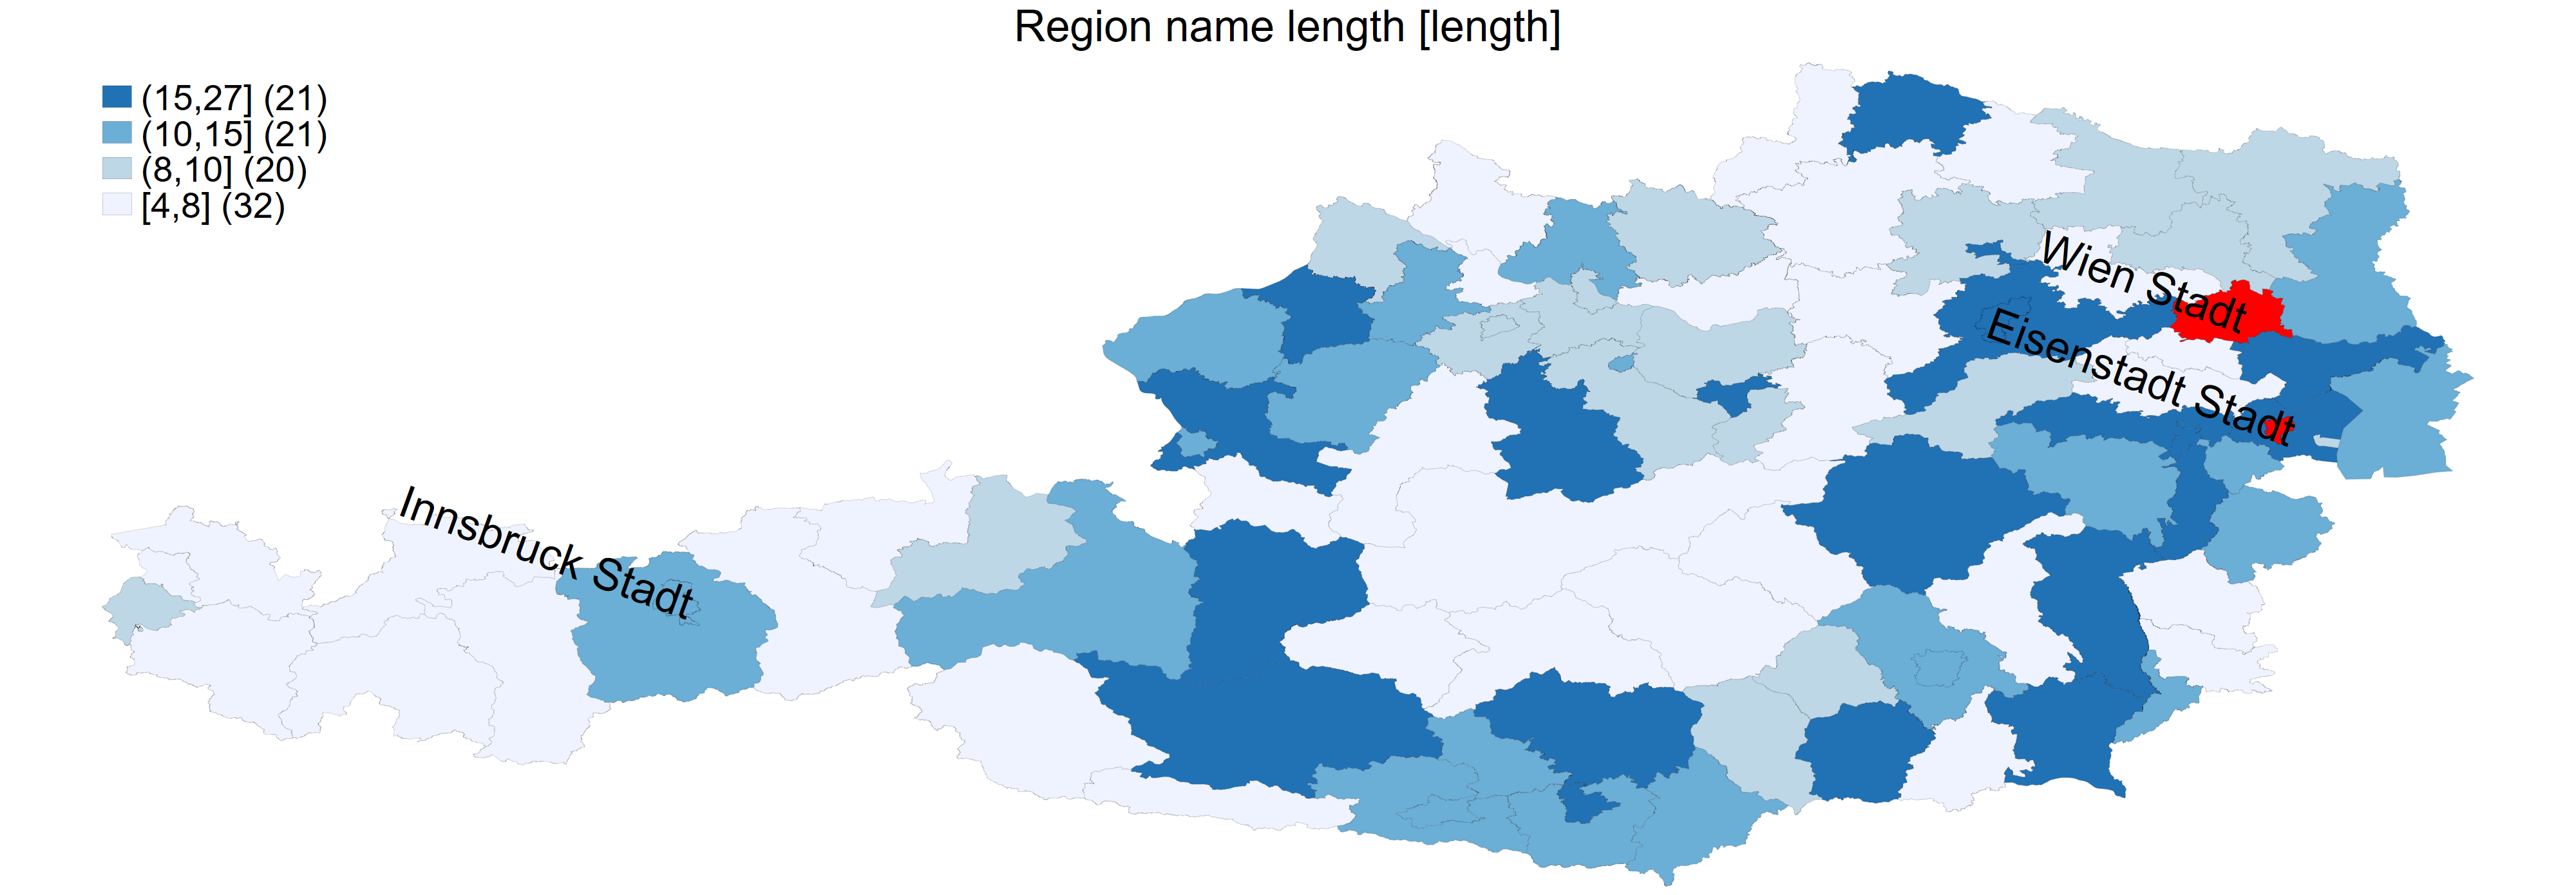
(Step B) I use the maps for the first administrative level in Austria:
/*
spshape2dta data\gadm41_AUT_shp\gadm41_AUT_1, ///
 saving(gadm41_AUT_1) replace

clear
*/

use gadm41_AUT_1.dta, clear

generate length = length(NAME_1)

grmap length using data\gadm41_AUT_1_shp.dta, id(_ID) ///
 fcolor(Blues)  ///
 ndfcolor(gray) clmethod(quantile) ///
  polygon(data(data\gadm41_AUT_1_shp.dta) select(keep if ///
  _ID==9 | _ID==1) fc(red) os(vvthin)) ///
 os(vvthin vvthin vvthin vvthin) ndsize(vvthin) //////
 title("Region name length [length]") ///
 label(xcoord(_CX) ycoord(_CY) select(keep if _ID==9 | ///
  _ID==1 |_ID==2 | _ID==7) ///
  label(NAME_1) size(5) length(22) pos(11) angle(340) ///
  gap(-3)) ///
 legend(pos(11) size(5)) legcount

graph rename Graph map_austria_1, replace
graph export figures\map_austria_1.png, as(png) ///
 width(4000) replace
graph export figures\map_austria_1.pdf, as(pdf) ///
 replace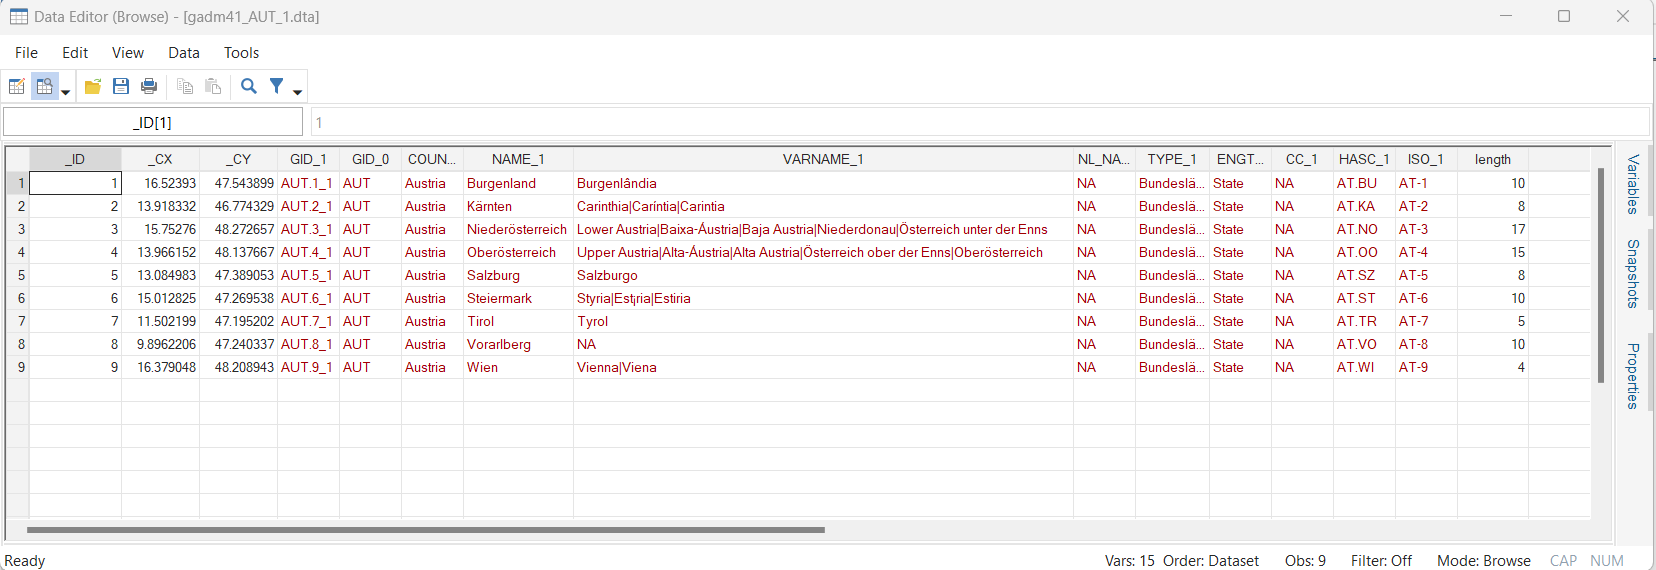
(Step B again) I use the maps for the second administrative level in Austria:
/*
spshape2dta data\gadm41_AUT_shp\gadm41_AUT_2, ///
 saving(gadm41_AUT_2) replace

clear
*/

use gadm41_AUT_2.dta, clear

generate length = length(NAME_2)

grmap length using data\gadm41_AUT_2_shp.dta, id(_ID) ///
 fcolor(Blues)  ///
 ndfcolor(gray) clmethod(quantile) ///
  polygon(data(data\gadm41_AUT_2_shp.dta) ///
   select(keep if _ID==94 | ///
  _ID==2) fc(red) os(vvthin)) ///
 os(vvthin vvthin vvthin vvthin) ndsize(vvthin) ///
 title("Region name length [length]") ///
 label(xcoord(_CX) ycoord(_CY) select(keep if _ID==94 | ///
  _ID==2 | _ID==83)  ///
  label(NAME_2) size(5) length(22) pos(11) angle(340) ///
  gap(-3)) ///
 legend(pos(11) size(5)) legcount

graph rename Graph map_austria_2, replace
graph export figures\map_austria_2.png, as(png) ///
 width(4000) replace
graph export figures\map_austria_2.pdf, as(pdf) ///
replace 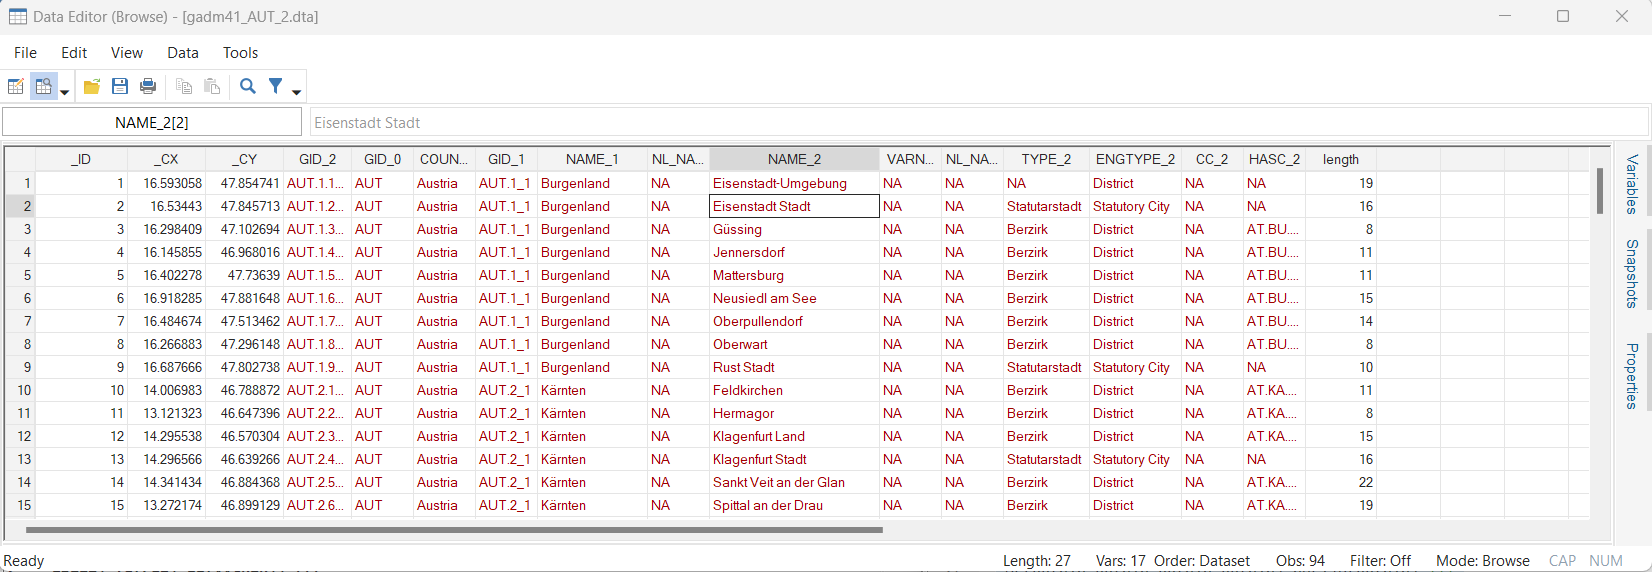
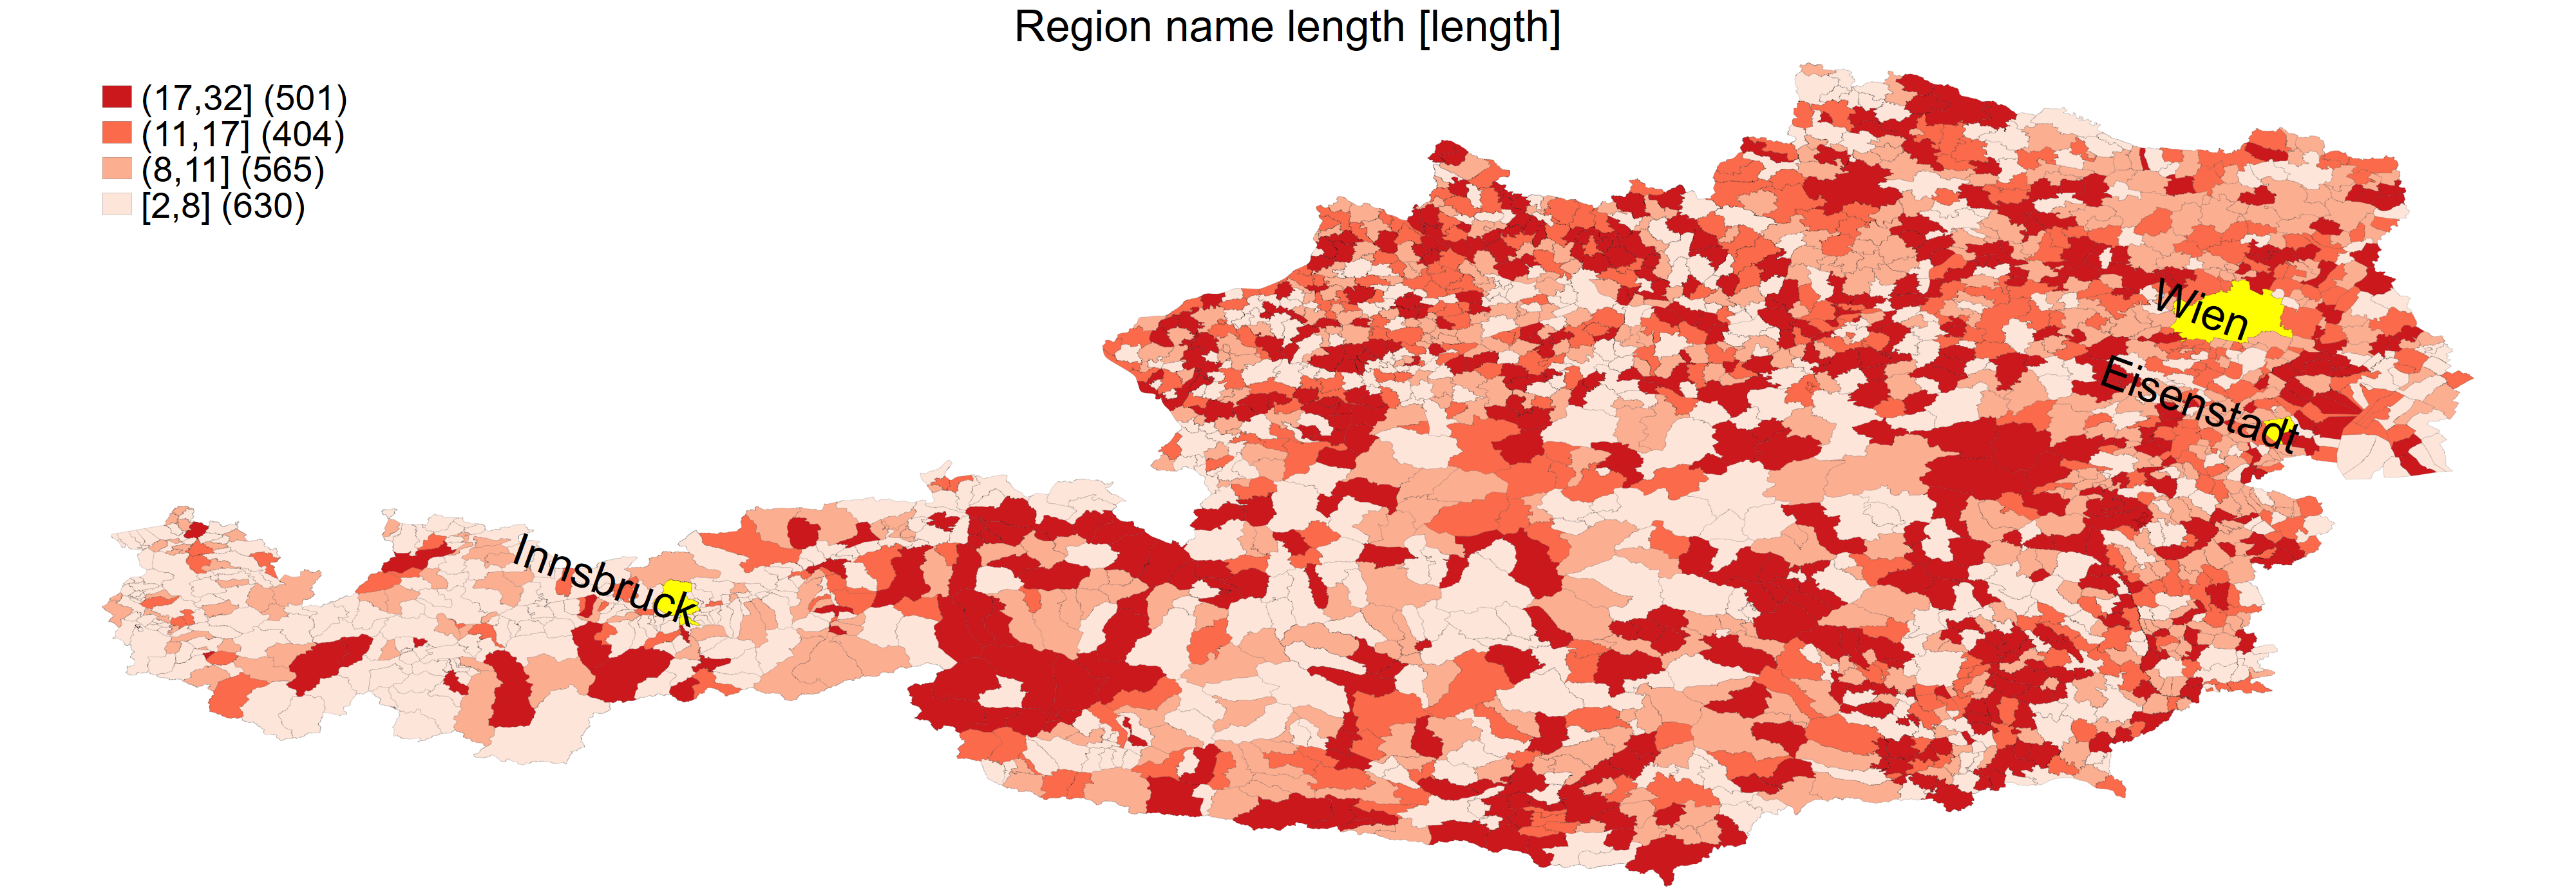
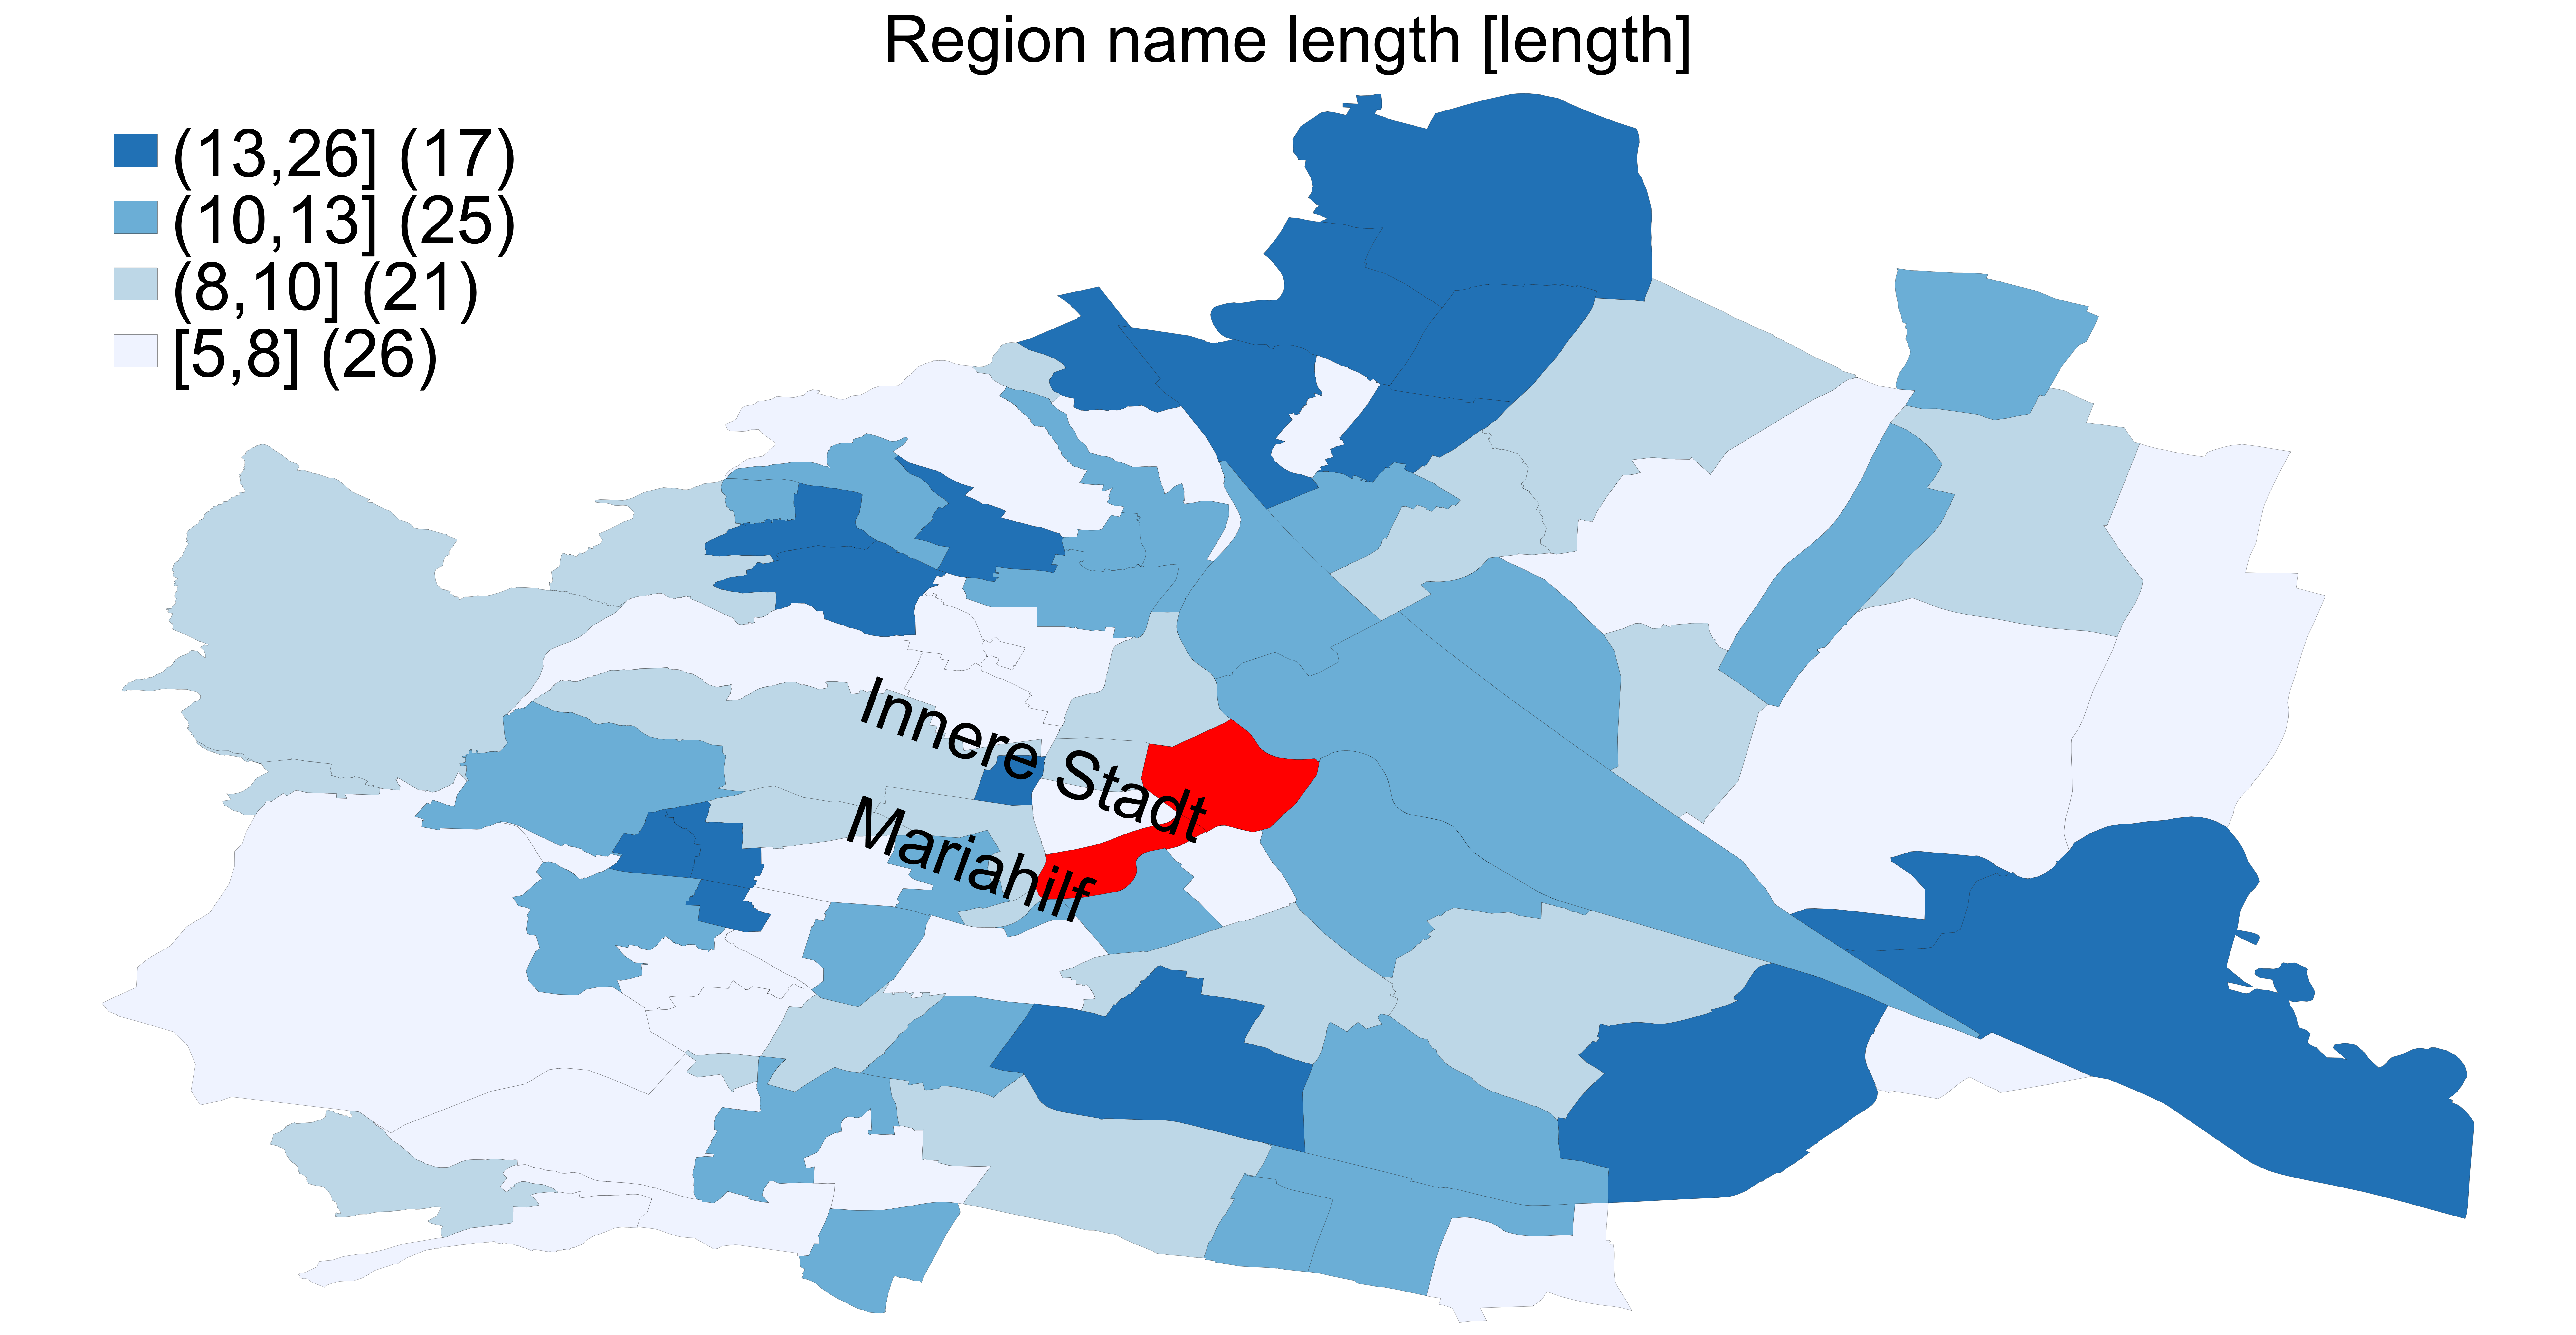
(Step B again and again) I use the maps for the third administrative level in Austria:
/*
spshape2dta data\gadm41_AUT_shp\gadm41_AUT_3, ///
 saving(gadm41_AUT_3) replace

clear
*/

use gadm41_AUT_3.dta, clear

generate length = length(NAME_3)

grmap length using data\gadm41_AUT_3_shp.dta, id(_ID) ///
 fcolor(Reds)  ///
 ndfcolor(gray) clmethod(quantile) ///
  polygon(data(data\gadm41_AUT_3_shp.dta) ///
   select(keep if _ID==24 | ///
  _ID==2100 | _ID==1814) fc(yellow) os(vvthin)) ///
 os(vvthin vvthin vvthin vvthin) ndsize(vvthin) ///
 title("Region name length [length]") ///
 label(xcoord(_CX) ycoord(_CY) select(keep if _ID==24 | ///
  _ID==2100 | _ID==1814) ///
 label(NAME_3) size(5) length(22) pos(11) angle(340) ///
  gap(-3)) ///
 legend(pos(11) size(5)) legcount

graph rename Graph map_austria_3, replace
graph export figures\map_austria_3.png, as(png) ///
 width(4000) replace
graph export figures\map_austria_3.pdf, as(pdf) ///
 replace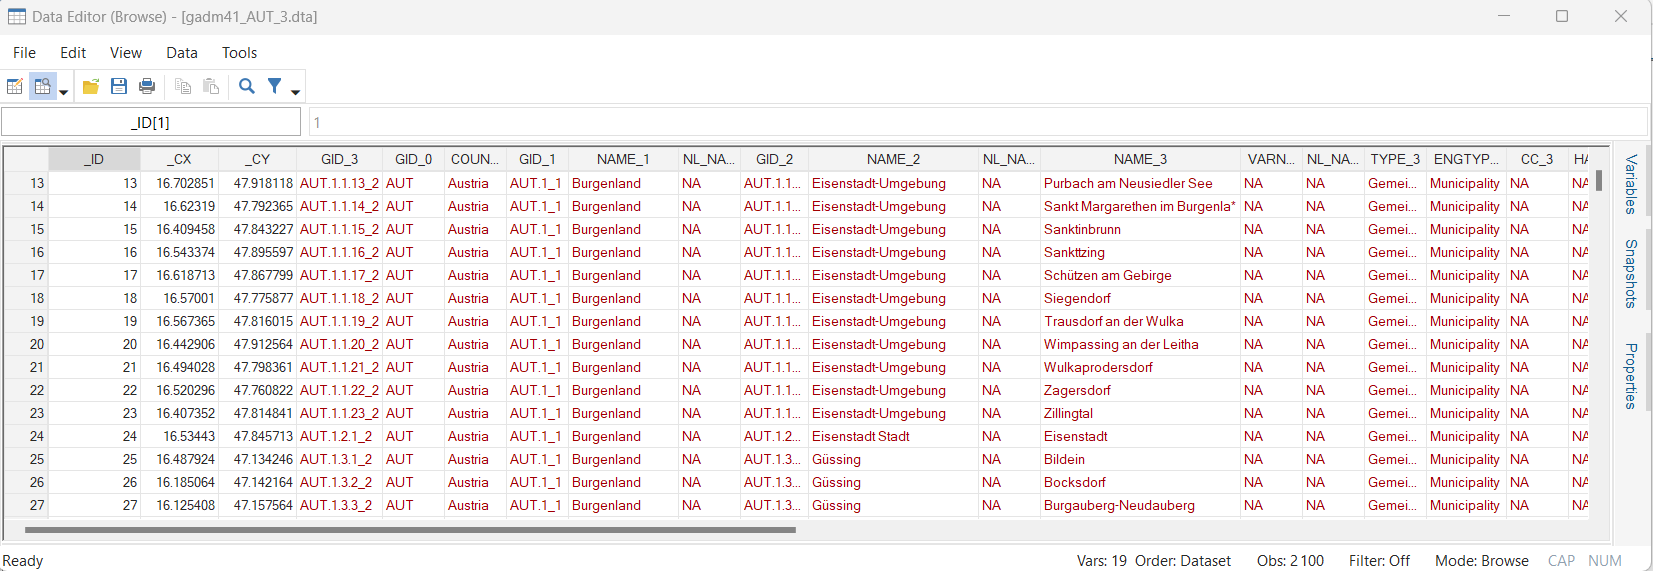
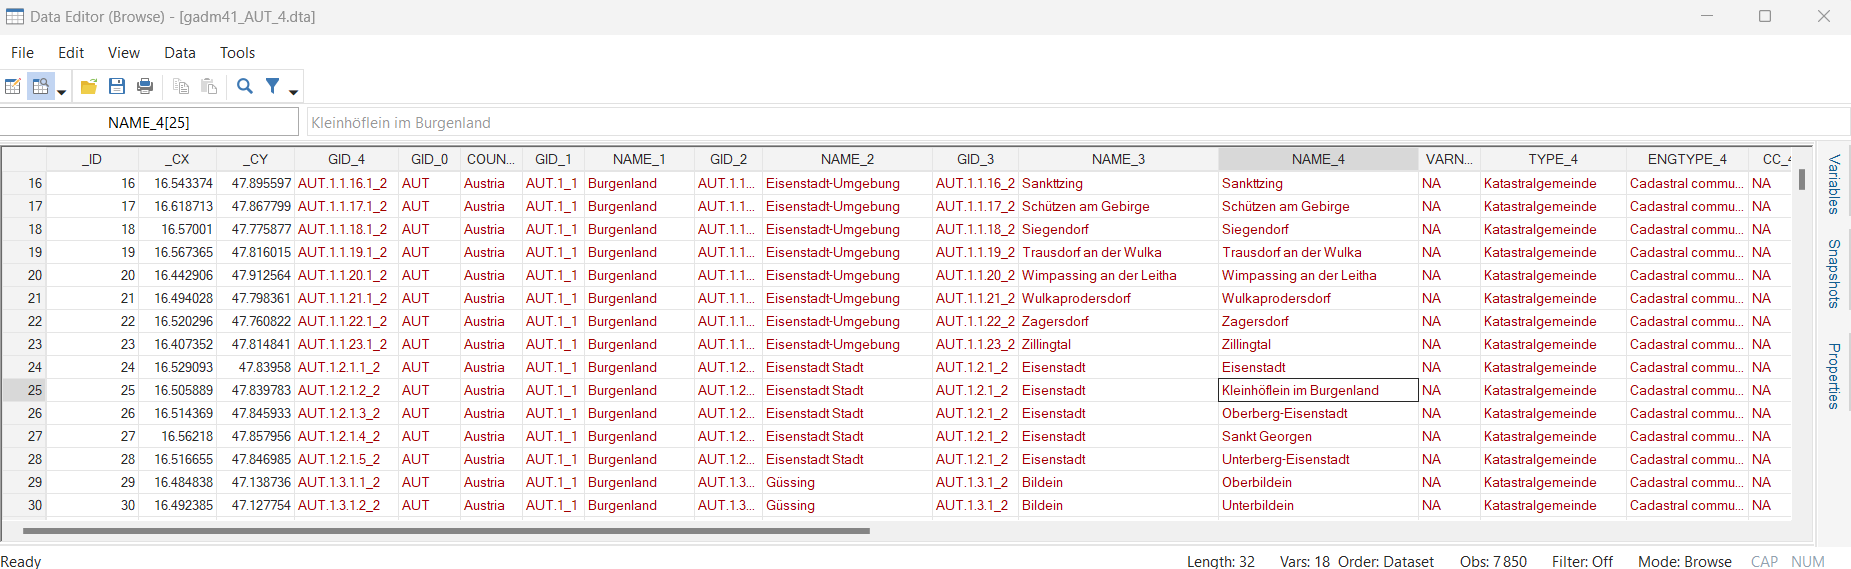
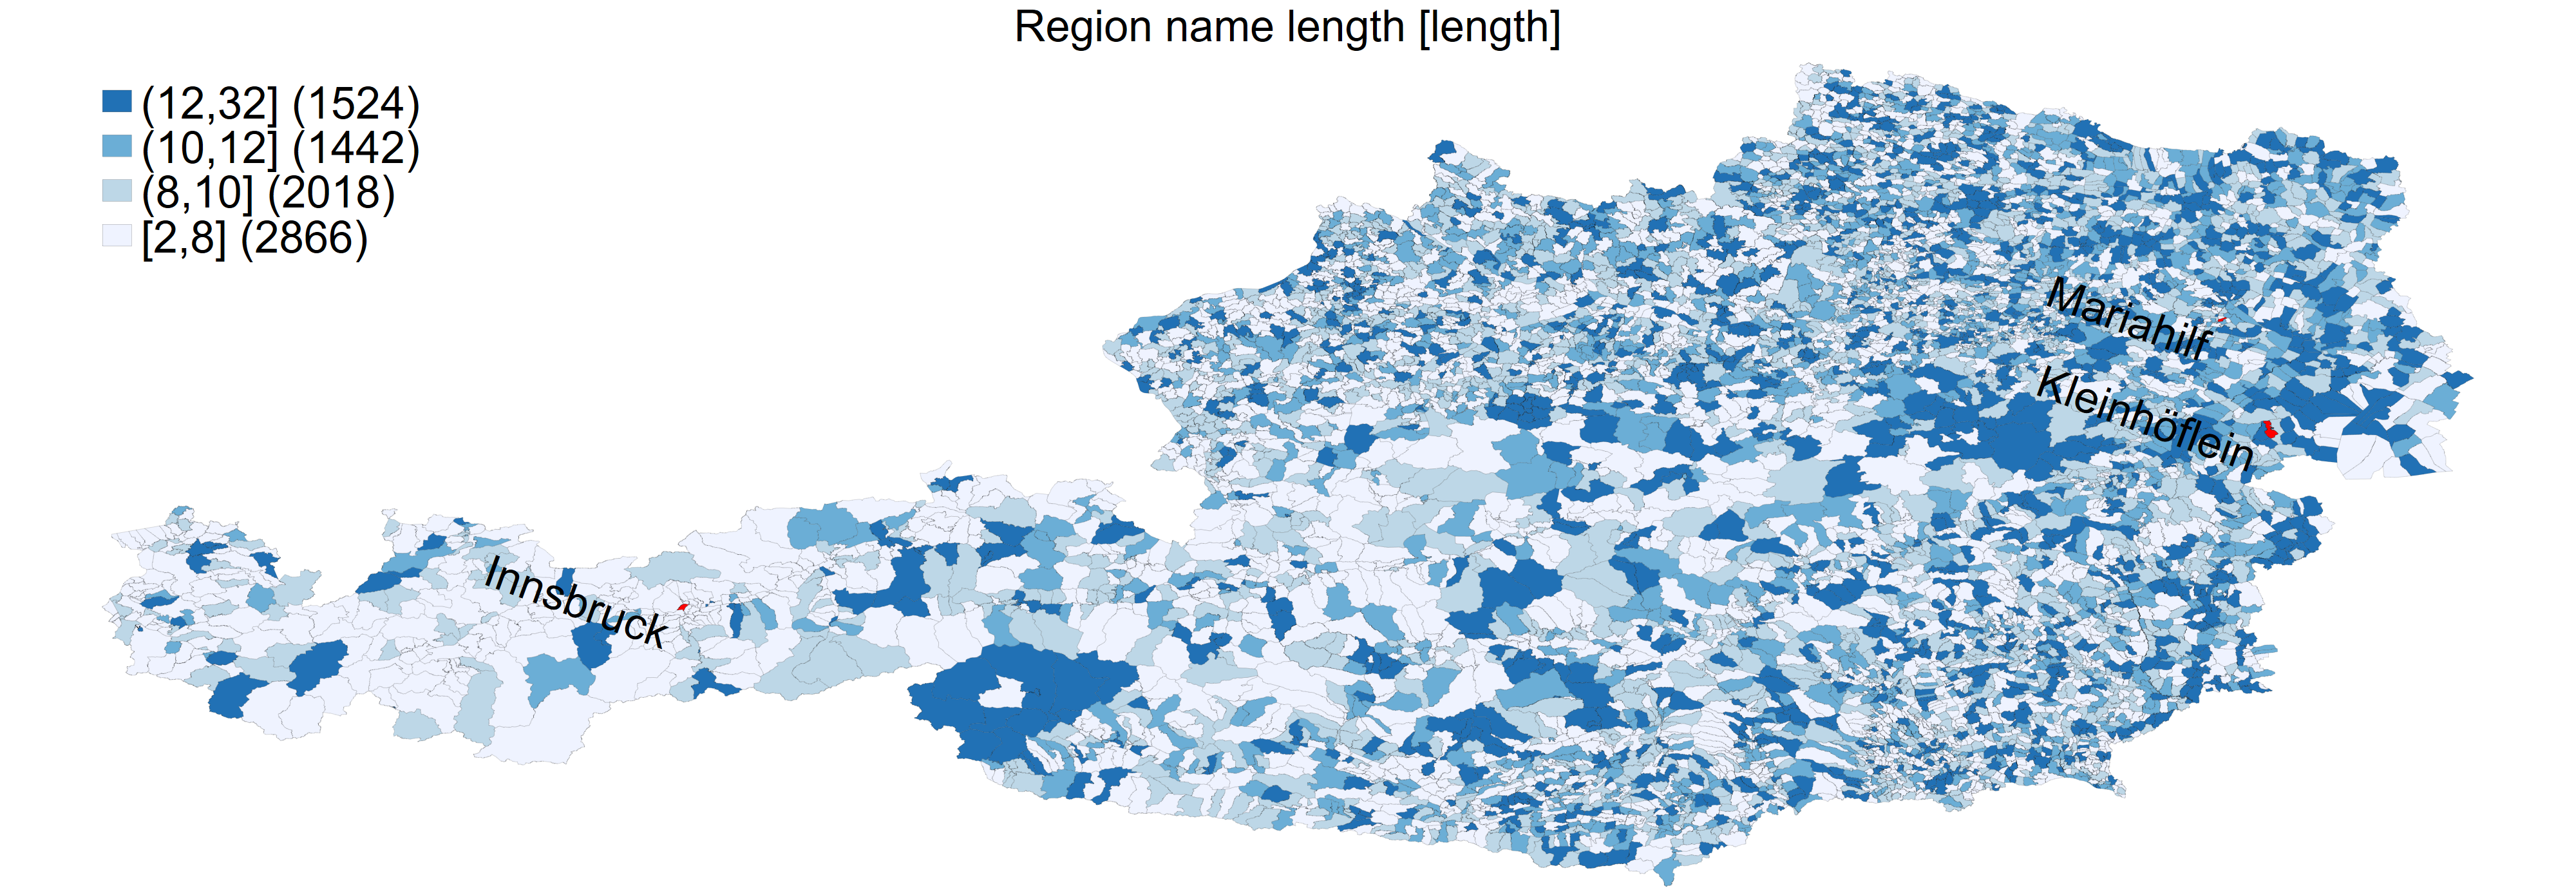
(Step B again, again and again) I use the maps for the fourth administrative level in Austria:
/*
spshape2dta data\gadm41_AUT_shp\gadm41_AUT_4, ///
saving(gadm41_AUT_4) replace
clear
*/
use gadm41_AUT_4.dta, clear
generate length = length(NAME_4)
grmap length using data\gadm41_AUT_4_shp.dta, id(_ID) ///
fcolor(Blues) ///
ndfcolor(gray) clmethod(quantile) ///
polygon(data(data\gadm41_AUT_4_shp.dta) select(keep if ///
_ID==7810 | _ID==25 | _ID==7406) fc(red) os(vvthin)) ///
os(vvthin vvthin vvthin vvthin) ndsize(vvthin) //////
title("Region name length [length]") ///
label(xcoord(_CX) ycoord(_CY) select(keep if _ID==7810 | ///
_ID==7810 | _ID==25 | _ID==7406) ///
label(NAME_4) size(5) length(13) pos(8) angle(340) ///
gap(0) color(black)) ///
legend(pos(11) size(5)) legcount
graph rename Graph map_austria_4, replace
graph export figures\map_austria_4.png, as(png) ///
width(4000) replace
graph export figures\map_austria_4.pdf, as(pdf) ///
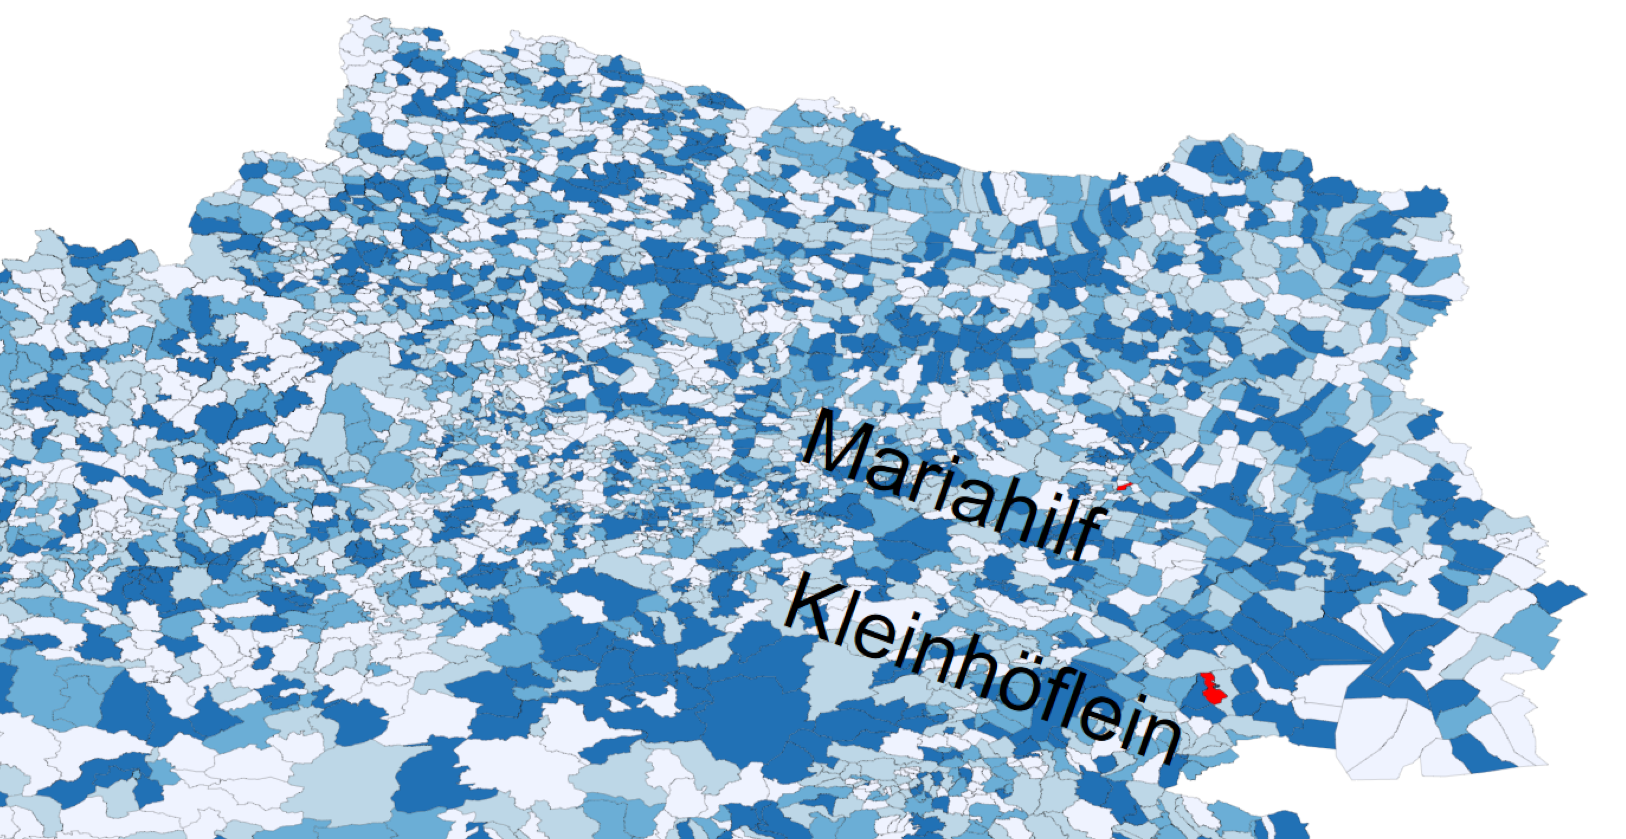
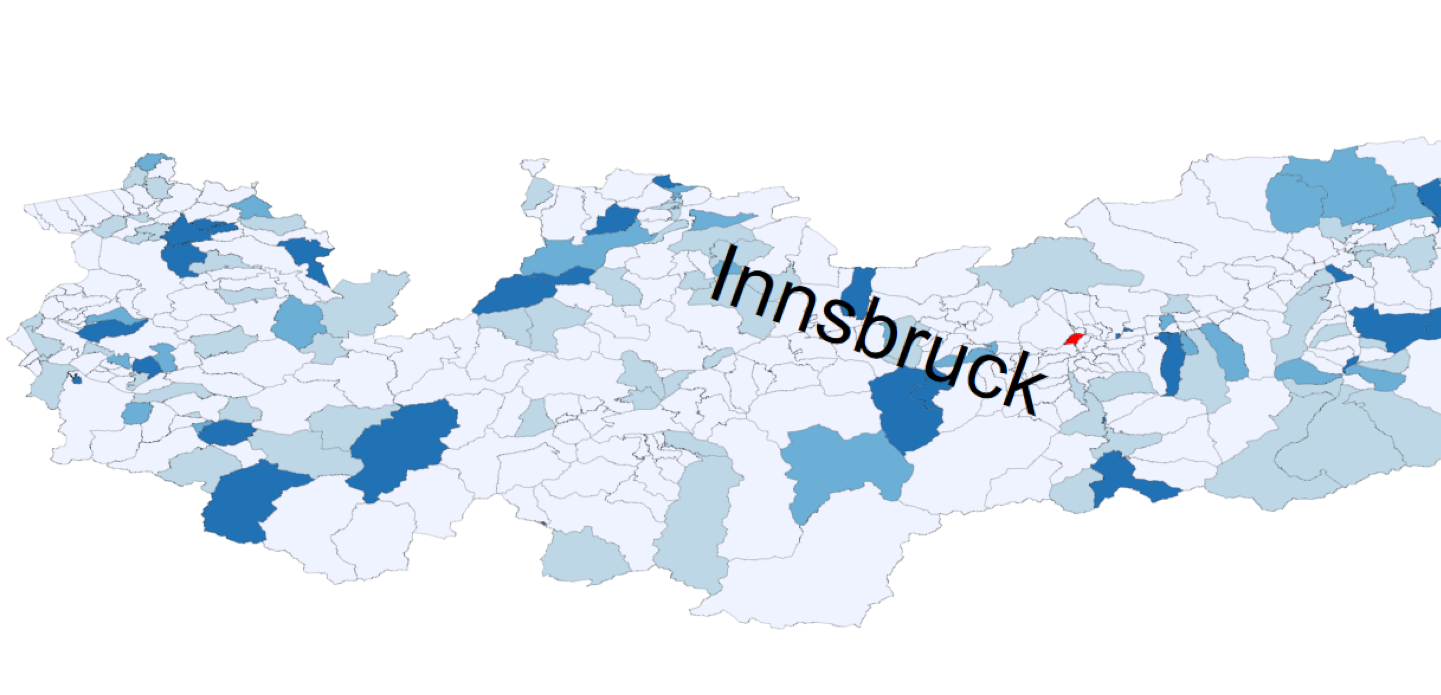
replaceWith a few more efforts, I can zoom into a specific region:
As we have seen in this blog, it is possible to draw maps in Stata in some simple steps at different administrative levels with the GADM data. The files for replicating the results in this blog are available on my GitHub.