If words are not things, or maps are not the actual territory, then, obviously, the only possible link between the objective world and the linguistic world is found in structure, and structure alone.
Alfred Korzybski (1958).
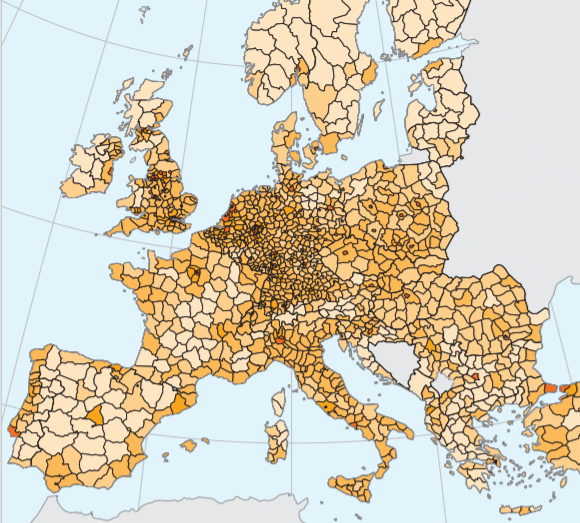
The Statistical Atlas is an interactive map viewer for statistical and topographical maps. Users can combine geographical layers of information from various ‘base maps’, such as the borders of NUTS regions or Urban Audit cities, with statistical maps. The available statistical maps are based on:
- several years of the printed version of Eurostat regional yearbooks,
- the LUCAS dataset on the Land use/Land cover survey,
- the CENSUS 2011 survey visualizing data on population and housing censuses.
Various functions are available to users viewing the details of the map display:
- zooming in and out on Europe and its outermost regions,
- changing the transparency settings of the map layers,
- retrieving the code, geographical label and statistical value of a specific NUTS region or Urban Audit city.
Interactive maps: https://ec.europa.eu/eurostat/statistical-atlas/gis/viewer/
Documentation: https://ec.europa.eu/eurostat/web/gisco/gisco-activities/statistical-atlas
1 Comment
[…] a first blog about the Statistical Atlas of the European Commission (The Statistical Atlas) and a second one on how to draw maps with Stata (Drawing Maps With Stata), in this blog, I will […]