The temptation to form premature theories upon insufficient data is the bane of our profession.
Sherlock Holmes.
The Valley of Fear, Sir Arthur Conan Doyle (1915).
In this blog, I will show you that if it is very simple to use FRED data (about) directly from STATA. As they described in their front page, you will be able to download, graph, and track 793,000 US and international time series from 103 sources.
(A) First, you need to create an account on the FRED website
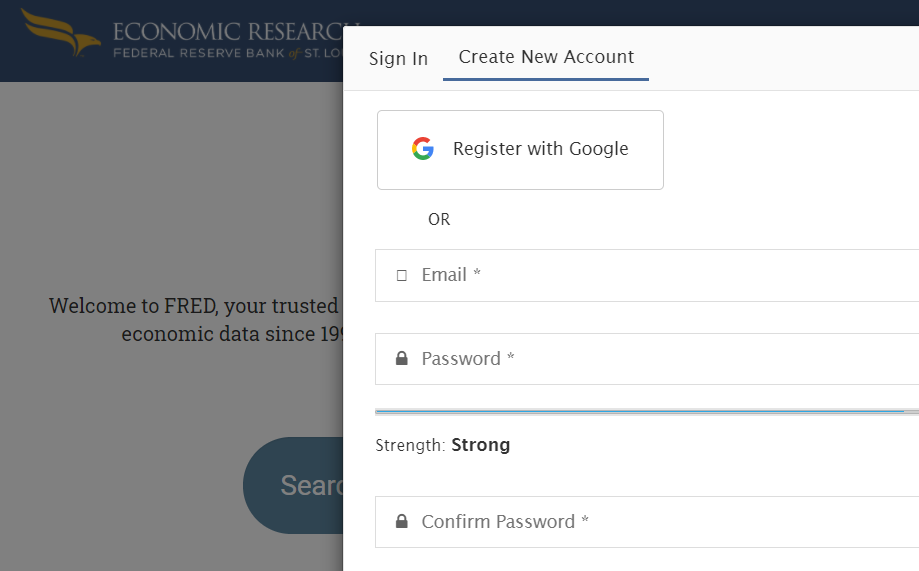
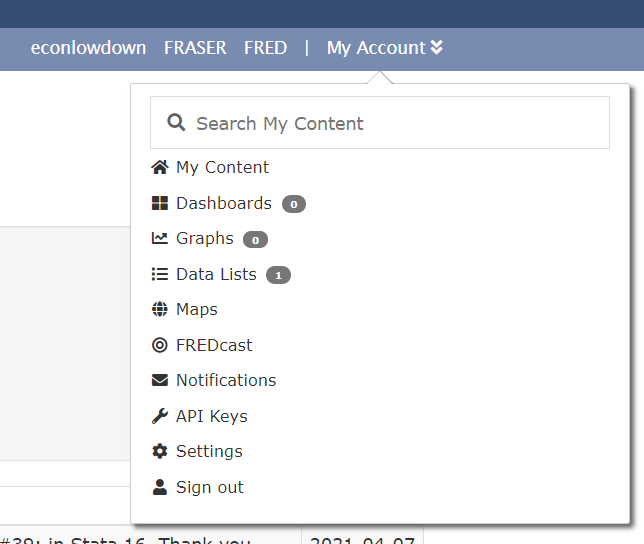
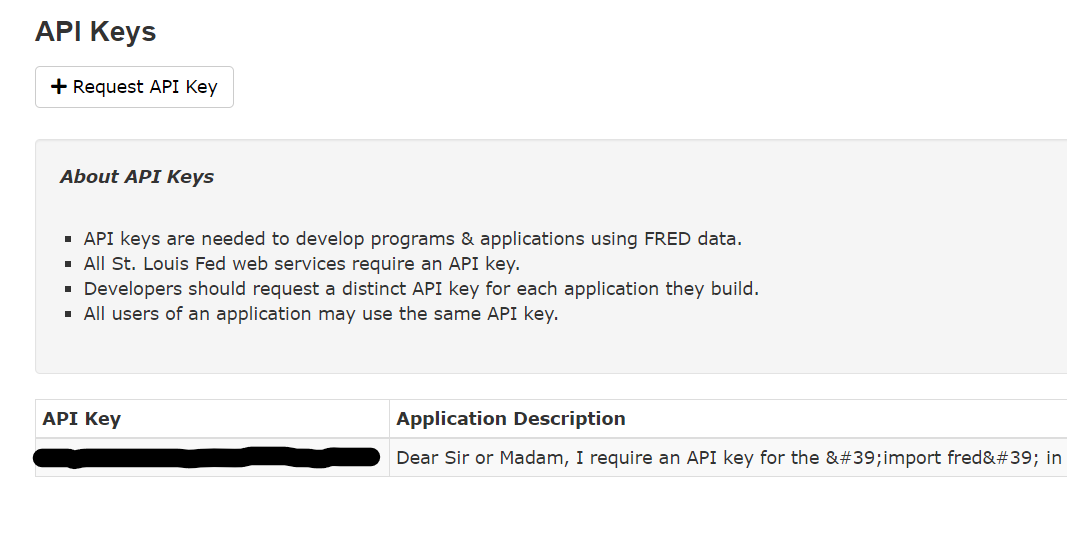
(B) Then, you have to request an API key into your account
https://research.stlouisfed.org/docs/api/api_key.html
(C) Once you have received the API key, you can move to STATA (my own API key is not shown):
You can use the following command to set the API key permanently in STATA (only once):
set fredkey key, permanently
Where the key is a series of 32 letters and numbers obtained from FRED in my case (not shown).
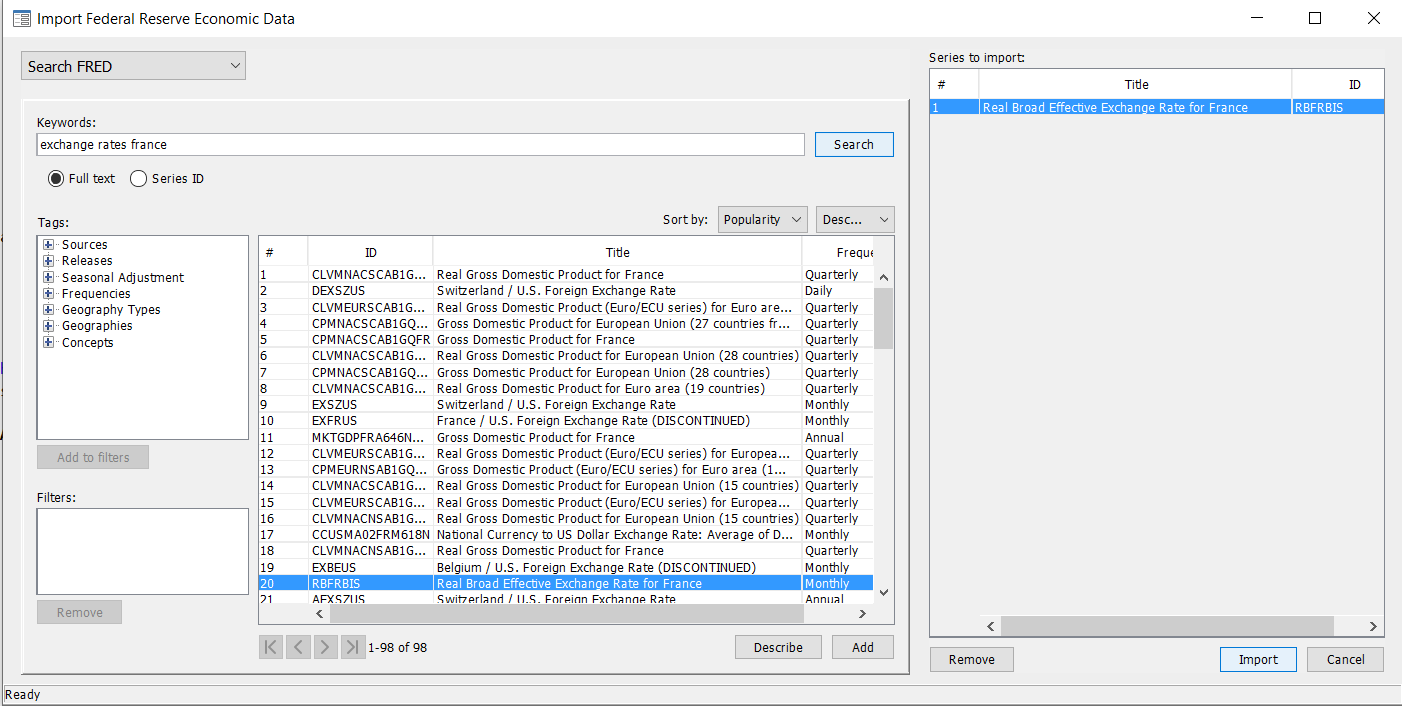
(D) From here, you can use the FRED interface:
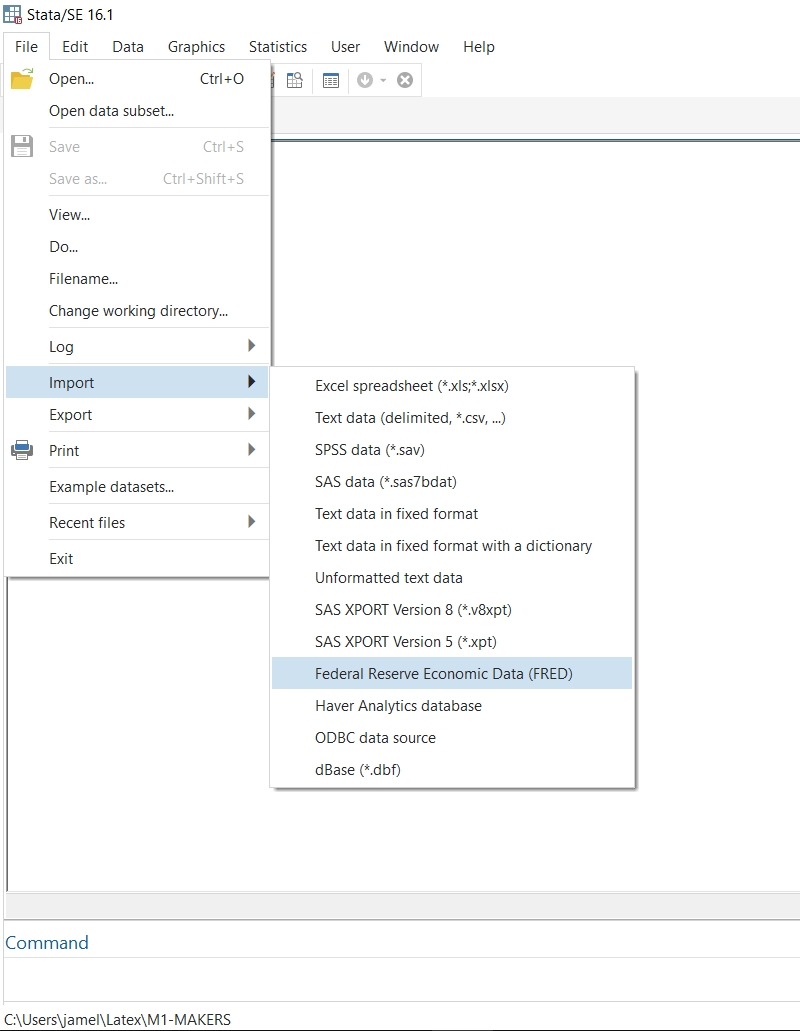
You can search exchange rate data for France with the FRED interface and select the real effective exchange rate for France coming from the Bank for the International Settlements (source):
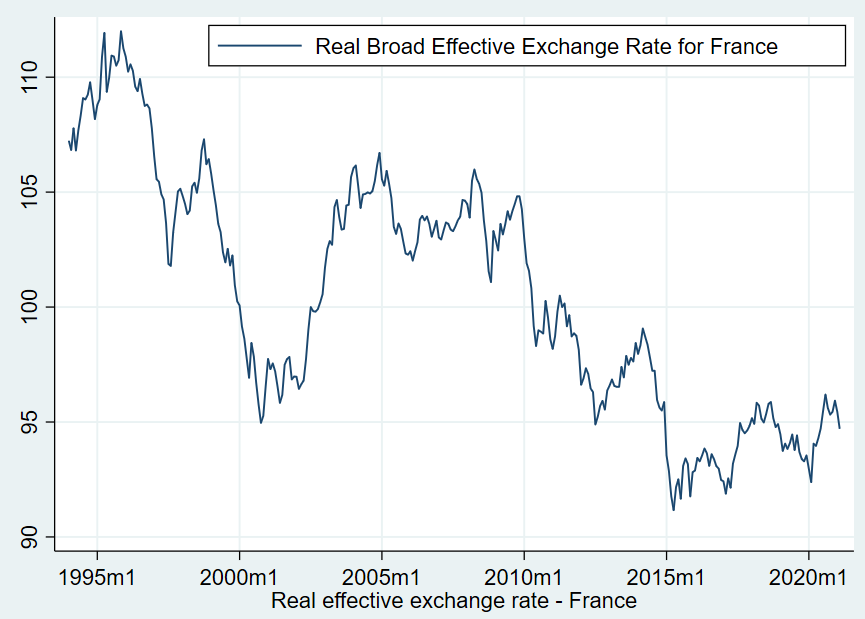
(D bis) However, when you know the identifier, you can use the following command to import the from FRED and plot the data for the real effective exchange rate of France (an increase indicates a real effective appreciation):
import fred RBFRBIS

rename RBFRBIS reer_france

generate period = tm(1994m1) + _n-1

format %tm period

tsset period, monthly

twoway (tsline reer_france), ytitle("") ///
ttitle(Real effective exchange rate - France) tlabel(, grid) ///
legend(on position(2) ring(0))
You will obtain the following graph:
In four simple steps, you will be able to access, import and visualize data directly from the FRED database.
References
- Schenck, D. 2017. Importing data with import fred. The Stata Blog: Not Elsewhere Classified. https://blog.stata.com/2017/08/08/importing-data-with-import-fred/
5 Comments
[…] fund rates from the FRED website. See the following blog for wide coverage of the command and use import fred. The /* */ means that this part of the code is optional. You have to download the Fed fund rates […]
[…] Using FRED with Stata […]
[…] aggregator DBnomics to retrieve some data with Stata. In a previous blog, I showed you how to use FRED with Stata. Like FRED, this database aggregator gathers an impressive number of providers (87 providers to […]
[…] You have to register on the FRED website, as explained in a previous blog […]
[…] a first blog where I show how to use FRED with Stata (Using FRED with Stata), I will show you hot use FRED with Mathematica. First, you have to connect the […]