In this blog, I will show you how to compute descriptive statistics by country in a panel data thanks to the Stata command putexcel in a few simple steps. For this demonstration, I will use the historical exchange rate data in the following article: “Sanctions and the Exchange Rate in Time” by Barry Eichengreen, Massimo Ferrari Minesso, Arnaud Mehl, Isabel Vansteenkiste, and Roger Vicquéry. The article is available here. The Mendeley dataset is available here. I am grateful to Massimo Ferrari Minesso for providing the information about the location of the code.
(Step A) I will import the data from the replication package, create the time variable, label the variables and balance the dataset. I drop the countries with no observation over the whole sample:
**# **** Stats by country in a panel ***************************

cd C:\Users\jamel\Documents\GitHub\EconMacroBlog\
cd Stats_By_Country_In_Panel_Data

/*
Use the data in this paper:
Title: Sanctions and the Exchange Rate in Time
Authors: Barry Eichengreen, Massimo Ferrari Minesso, Arnaud Mehl, Isabel Vansteenkiste, Roger Vicquéry
DOI: https://doi.org/10.1093/epolic/eiad034
Mendeley: https://data.mendeley.com/datasets/8526jpm6ct/1
*/

use data\swissdata.dta, clear

xtset mycountry myweek

xtdes

keep mycountry myweek fx lfx
order mycountry myweek fx lfx

label variable mycountry "Country name"
label variable myweek "Date - current week"
label variable fx "Currency i units per unit of US dollar"
label variable lfx "Natural logarithm of 1 + fx"

by mycountry: gen period = tw(1913w52) + _n

format %tw period

drop if period>tw(1945w52)
drop if mycountry==. // To have a strongly (not weakly) balanced panel

xtset mycountry period
tsfill, full

xtset mycountry period
xtdes

// Drop countries without observations
cap egen mean_fx = mean(fx), by(mycountry)
cap drop if mean_fx == .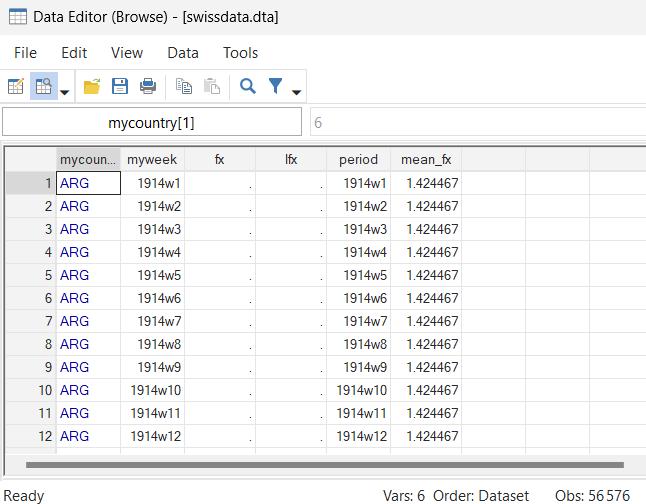
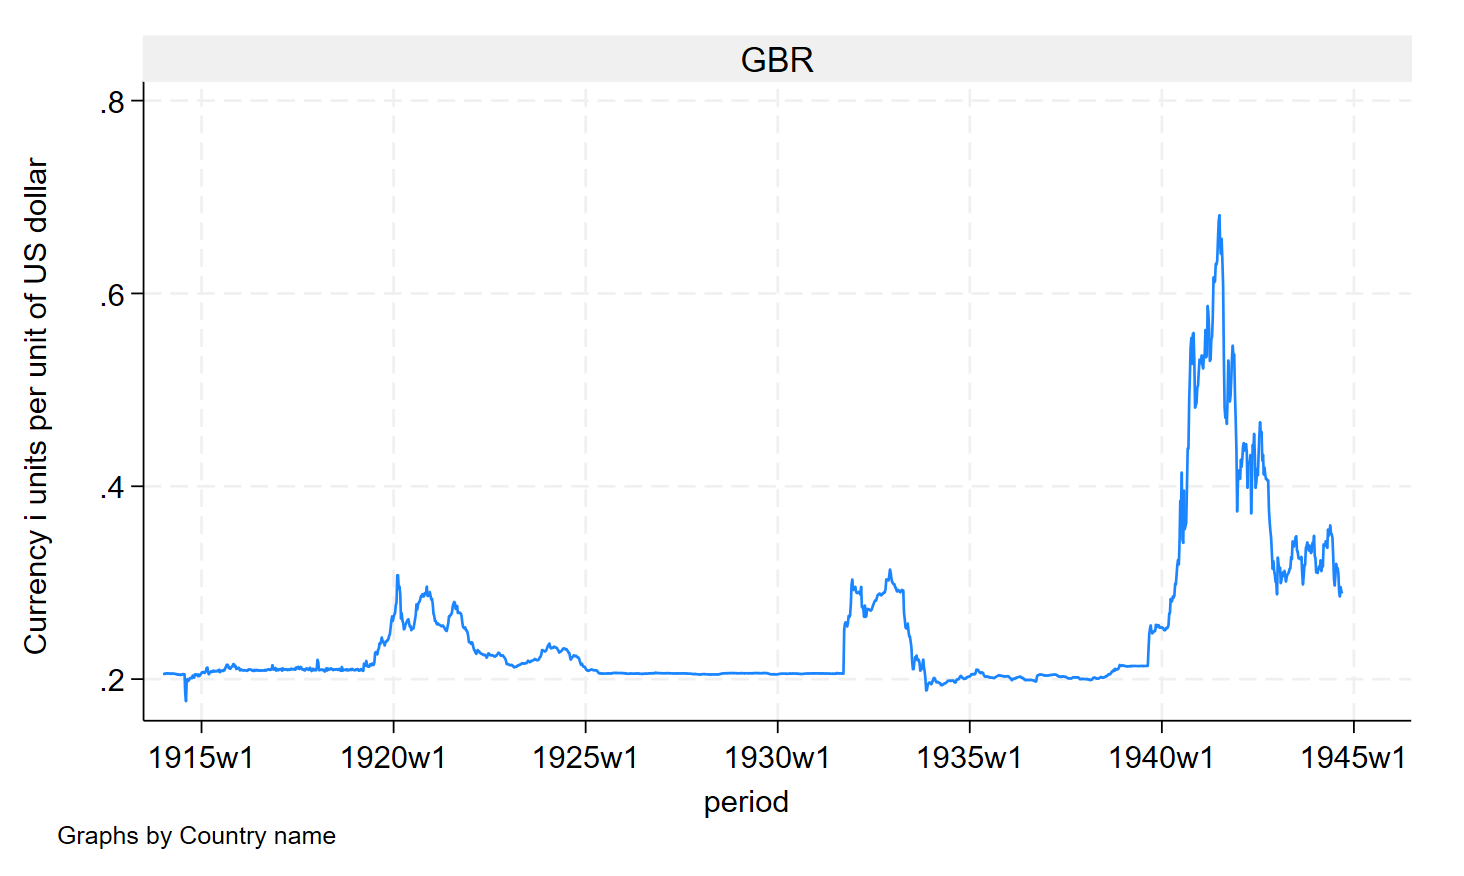
(Step B) Now, I will draw some graphs in order to visualize the data for some countries. It is necessary to visualize the data before turning to regressions and more complex calculations:
// Draw some graphs

decode mycountry, generate(names)

xtline fx if names=="GBR", name(GBR, replace)
graph export figures\GBR.png, as(png) width(4000) replace
graph export figures\GBR.png, as(pdf) replace

xtline fx if names=="ARG", name(ARG, replace)
graph export figures\ARG.png, as(png) width(4000) replace
graph export figures\ARG.png, as(pdf) replace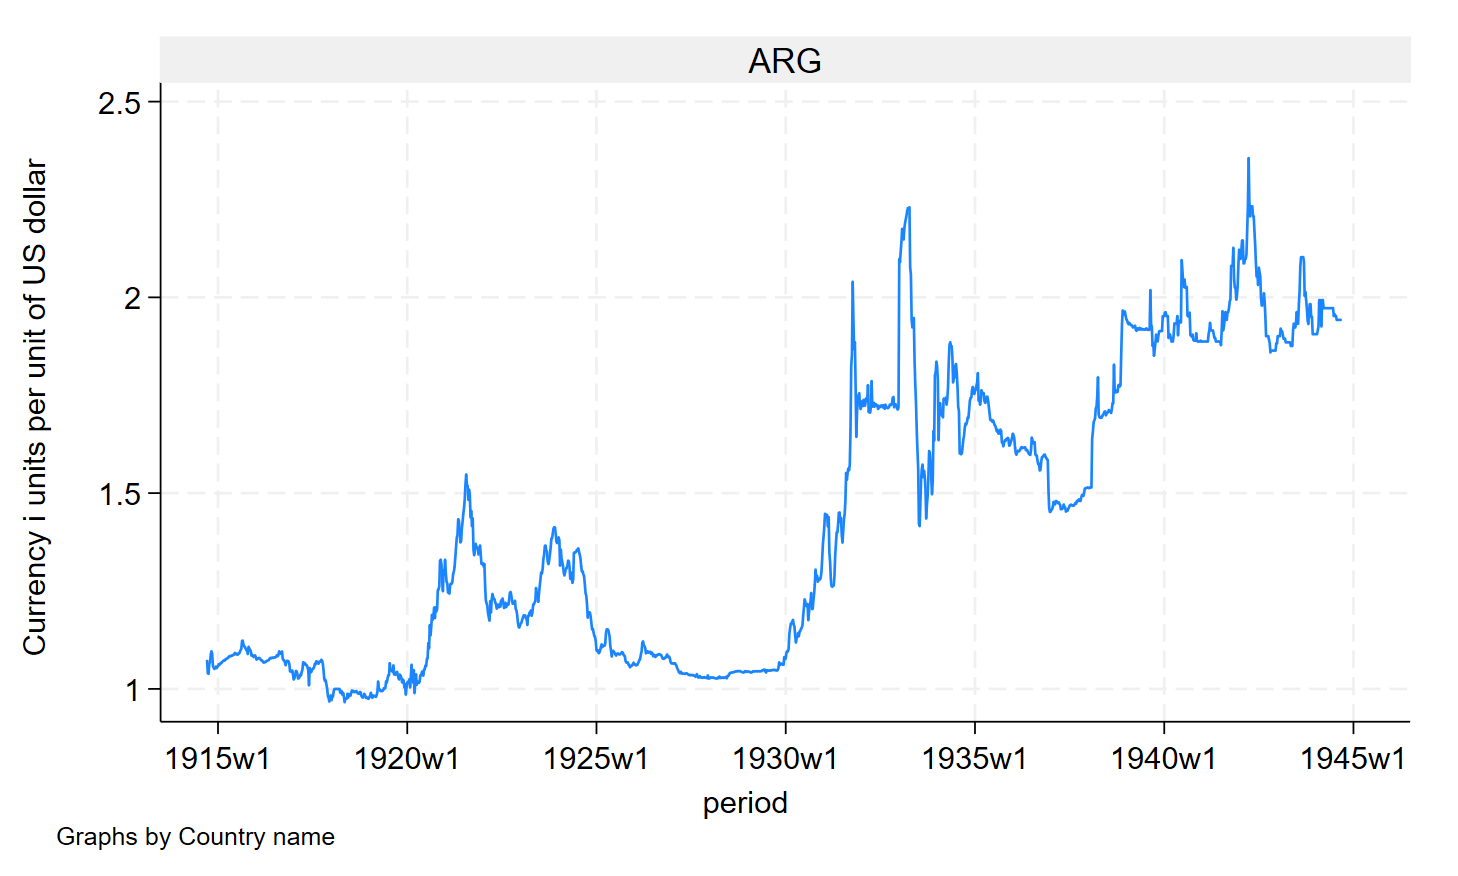
(Step C) Finally, I will produce an Excel file with descriptive statistics by country for this panel data of weekly bilateral exchange rates thanks to the putexcel command. I will use a trick to keep the first country in the final Excel file:
**# ****** Descriptive statistics ******************************

// Insert an observation to keep the first country
// Thanks to Katharina Priedl for making me think of this trick

insobs 1, before(1)

replace names = "AAAA" in 1

encode names, generate(names2)

xtset names2 period

xtdes

label list names2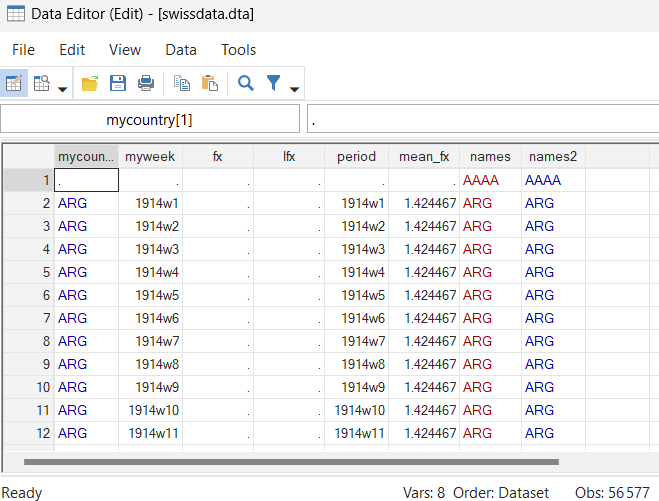
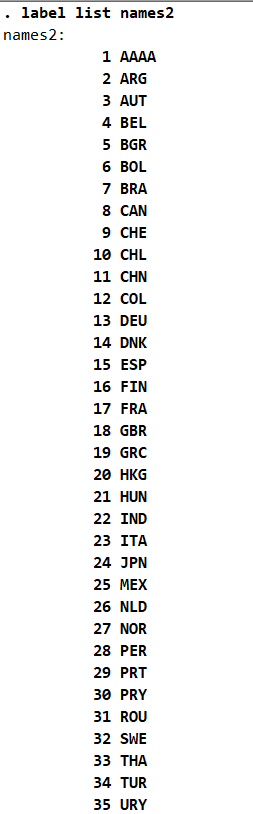
(Step D) Now, I will use the tabstat command to produce the descriptive statistics by country:
tabstat fx, ///
 statistics(count) ///
 by(names) format(%4.2f) save
putexcel set "tabstat", replace sheet(Stats)
return list
putexcel (B1) = "count"
forvalues v=2(1)35 {
          capture putexcel (A`v') = (r(name`v'))
		  capture putexcel (B`v') = matrix(r(Stat`v'))
		}

tabstat fx, ///
 statistics(mean) ///
 by(names) format(%4.2f) save
putexcel (C1) = "mean"
putexcel set "tabstat", modify sheet(Stats)
forvalues v=2(1)35 {
          capture putexcel (A`v') = (r(name`v'))
		  capture putexcel (C`v') = matrix(r(Stat`v'))
		}

tabstat fx, ///
 statistics(median) ///
 by(names) format(%4.2f) save
putexcel (D1) = "median"
putexcel set "tabstat", modify sheet(Stats)
forvalues v=2(1)35 {
          capture putexcel (A`v') = (r(name`v'))
		  capture putexcel (D`v') = matrix(r(Stat`v'))
		}

tabstat fx, ///
 statistics(sd) ///
 by(names) format(%4.2f) save
putexcel (E1) = "sd"
putexcel set "tabstat", modify sheet(Stats)
forvalues v=2(1)35 {
          capture putexcel (A`v') = (r(name`v'))
		  capture putexcel (E`v') = matrix(r(Stat`v'))
		}

tabstat fx, ///
 statistics(min) ///
 by(names) format(%4.2f) save
putexcel (F1) = "min"
putexcel set "tabstat", modify sheet(Stats)
forvalues v=2(1)35 {
          capture putexcel (A`v') = (r(name`v'))
		  capture putexcel (F`v') = matrix(r(Stat`v'))
		}

tabstat fx, ///
 statistics(max) ///
 by(names) format(%4.2f) save
putexcel (G1) = "max"
putexcel set "tabstat", modify sheet(Stats)
forvalues v=2(1)35 {
          capture putexcel (A`v') = (r(name`v'))
		  capture putexcel (G`v') = matrix(r(Stat`v'))
		}

drop in 1/1

save data\fx_histo.dta, replace

**# **** End of the program ************************************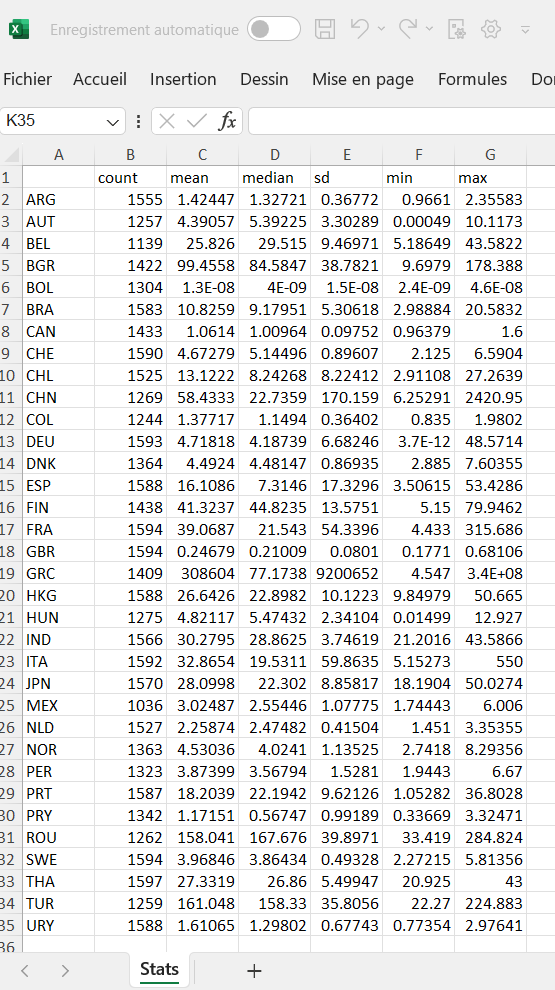
Finally, the full code below is provided for illustrative and pedagogical purposes:
**# **** Stats by country in a panel ***************************

cd C:\Users\jamel\Documents\GitHub\EconMacroBlog\
cd Stats_By_Country_In_Panel_Data

/*
Use the data in this paper:
Title: Sanctions and the Exchange Rate in Time
Authors: Barry Eichengreen, Massimo Ferrari Minesso, Arnaud Mehl,
Isabel Vansteenkiste, Roger Vicquéry
DOI: https://doi.org/10.1093/epolic/eiad034
Mendeley: https://data.mendeley.com/datasets/8526jpm6ct/1
*/

use data\swissdata.dta, clear

xtset mycountry myweek

xtdes

keep mycountry myweek fx lfx
order mycountry myweek fx lfx

label variable mycountry "Country name"
label variable myweek "Date - current week"
label variable fx "Currency i units per unit of US dollar"
label variable lfx "Natural logarithm of 1 + fx"

by mycountry: gen period = tw(1913w52) + _n

format %tw period

drop if period>tw(1945w52)
drop if mycountry==.

xtset mycountry period
tsfill, full

xtset mycountry period
xtdes

// Drop countries without observations
cap egen mean_fx = mean(fx), by(mycountry)
cap drop if mean_fx == .

// Draw some graphs

decode mycountry, generate(names)

xtline fx if names=="GBR", name(GBR, replace)
graph export figures\GBR.png, as(png) width(4000) replace
graph export figures\GBR.png, as(pdf) replace

xtline fx if names=="ARG", name(ARG, replace)
graph export figures\ARG.png, as(png) width(4000) replace
graph export figures\ARG.png, as(pdf) replace

/*
xtline fx if names=="AUT", name(AUT, replace)
graph export figures\AUT.png, as(png) width(4000) replace
graph export figures\AUT.png, as(pdf) replace
xtline fx if names=="FRA", name(FRA, replace)
graph export figures\FRA.png, as(png) width(4000) replace
graph export figures\FRA.png, as(pdf) replace
xtline fx if names=="GBR", name(GBR, replace)
graph export figures\GBR.png, as(png) width(4000) replace
graph export figures\GBR.png, as(pdf) replace
xtline fx if names=="DEU", name(DEU, replace)
graph export figures\DEU.png, as(png) width(4000) replace
graph export figures\DEU.png, as(pdf) replace
*/

**# ****** Descriptive statistics ******************************

// Insert an observation to keep the first country
// Thanks to Katharina Priedl for making me think of this trick

insobs 1, before(1)

replace names = "AAAA" in 1

encode names, generate(names2)

xtset names2 period

xtdes

label list names2

tabstat fx, ///
 statistics(count) ///
 by(names) format(%4.2f) save
putexcel set "tabstat", replace sheet(Stats)
return list
putexcel (B1) = "count"
forvalues v=2(1)35 {
          capture putexcel (A`v') = (r(name`v'))
		  capture putexcel (B`v') = matrix(r(Stat`v'))
		}

tabstat fx, ///
 statistics(mean) ///
 by(names) format(%4.2f) save
putexcel (C1) = "mean"
putexcel set "tabstat", modify sheet(Stats)
forvalues v=2(1)35 {
          capture putexcel (A`v') = (r(name`v'))
		  capture putexcel (C`v') = matrix(r(Stat`v'))
		}

tabstat fx, ///
 statistics(median) ///
 by(names) format(%4.2f) save
putexcel (D1) = "median"
putexcel set "tabstat", modify sheet(Stats)
forvalues v=2(1)35 {
          capture putexcel (A`v') = (r(name`v'))
		  capture putexcel (D`v') = matrix(r(Stat`v'))
		}

tabstat fx, ///
 statistics(sd) ///
 by(names) format(%4.2f) save
putexcel (E1) = "sd"
putexcel set "tabstat", modify sheet(Stats)
forvalues v=2(1)35 {
          capture putexcel (A`v') = (r(name`v'))
		  capture putexcel (E`v') = matrix(r(Stat`v'))
		}

tabstat fx, ///
 statistics(min) ///
 by(names) format(%4.2f) save
putexcel (F1) = "min"
putexcel set "tabstat", modify sheet(Stats)
forvalues v=2(1)35 {
          capture putexcel (A`v') = (r(name`v'))
		  capture putexcel (F`v') = matrix(r(Stat`v'))
		}

tabstat fx, ///
 statistics(max) ///
 by(names) format(%4.2f) save
putexcel (G1) = "max"
putexcel set "tabstat", modify sheet(Stats)
forvalues v=2(1)35 {
          capture putexcel (A`v') = (r(name`v'))
		  capture putexcel (G`v') = matrix(r(Stat`v'))
		}

drop in 1/1

save data\fx_histo.dta, replace

**# **** End of the program ************************************
As we have seen in this blog, it is possible to produce descriptive statistics for individual countries in some simple steps. The files for replicating the results in this blog are available on my GitHub.