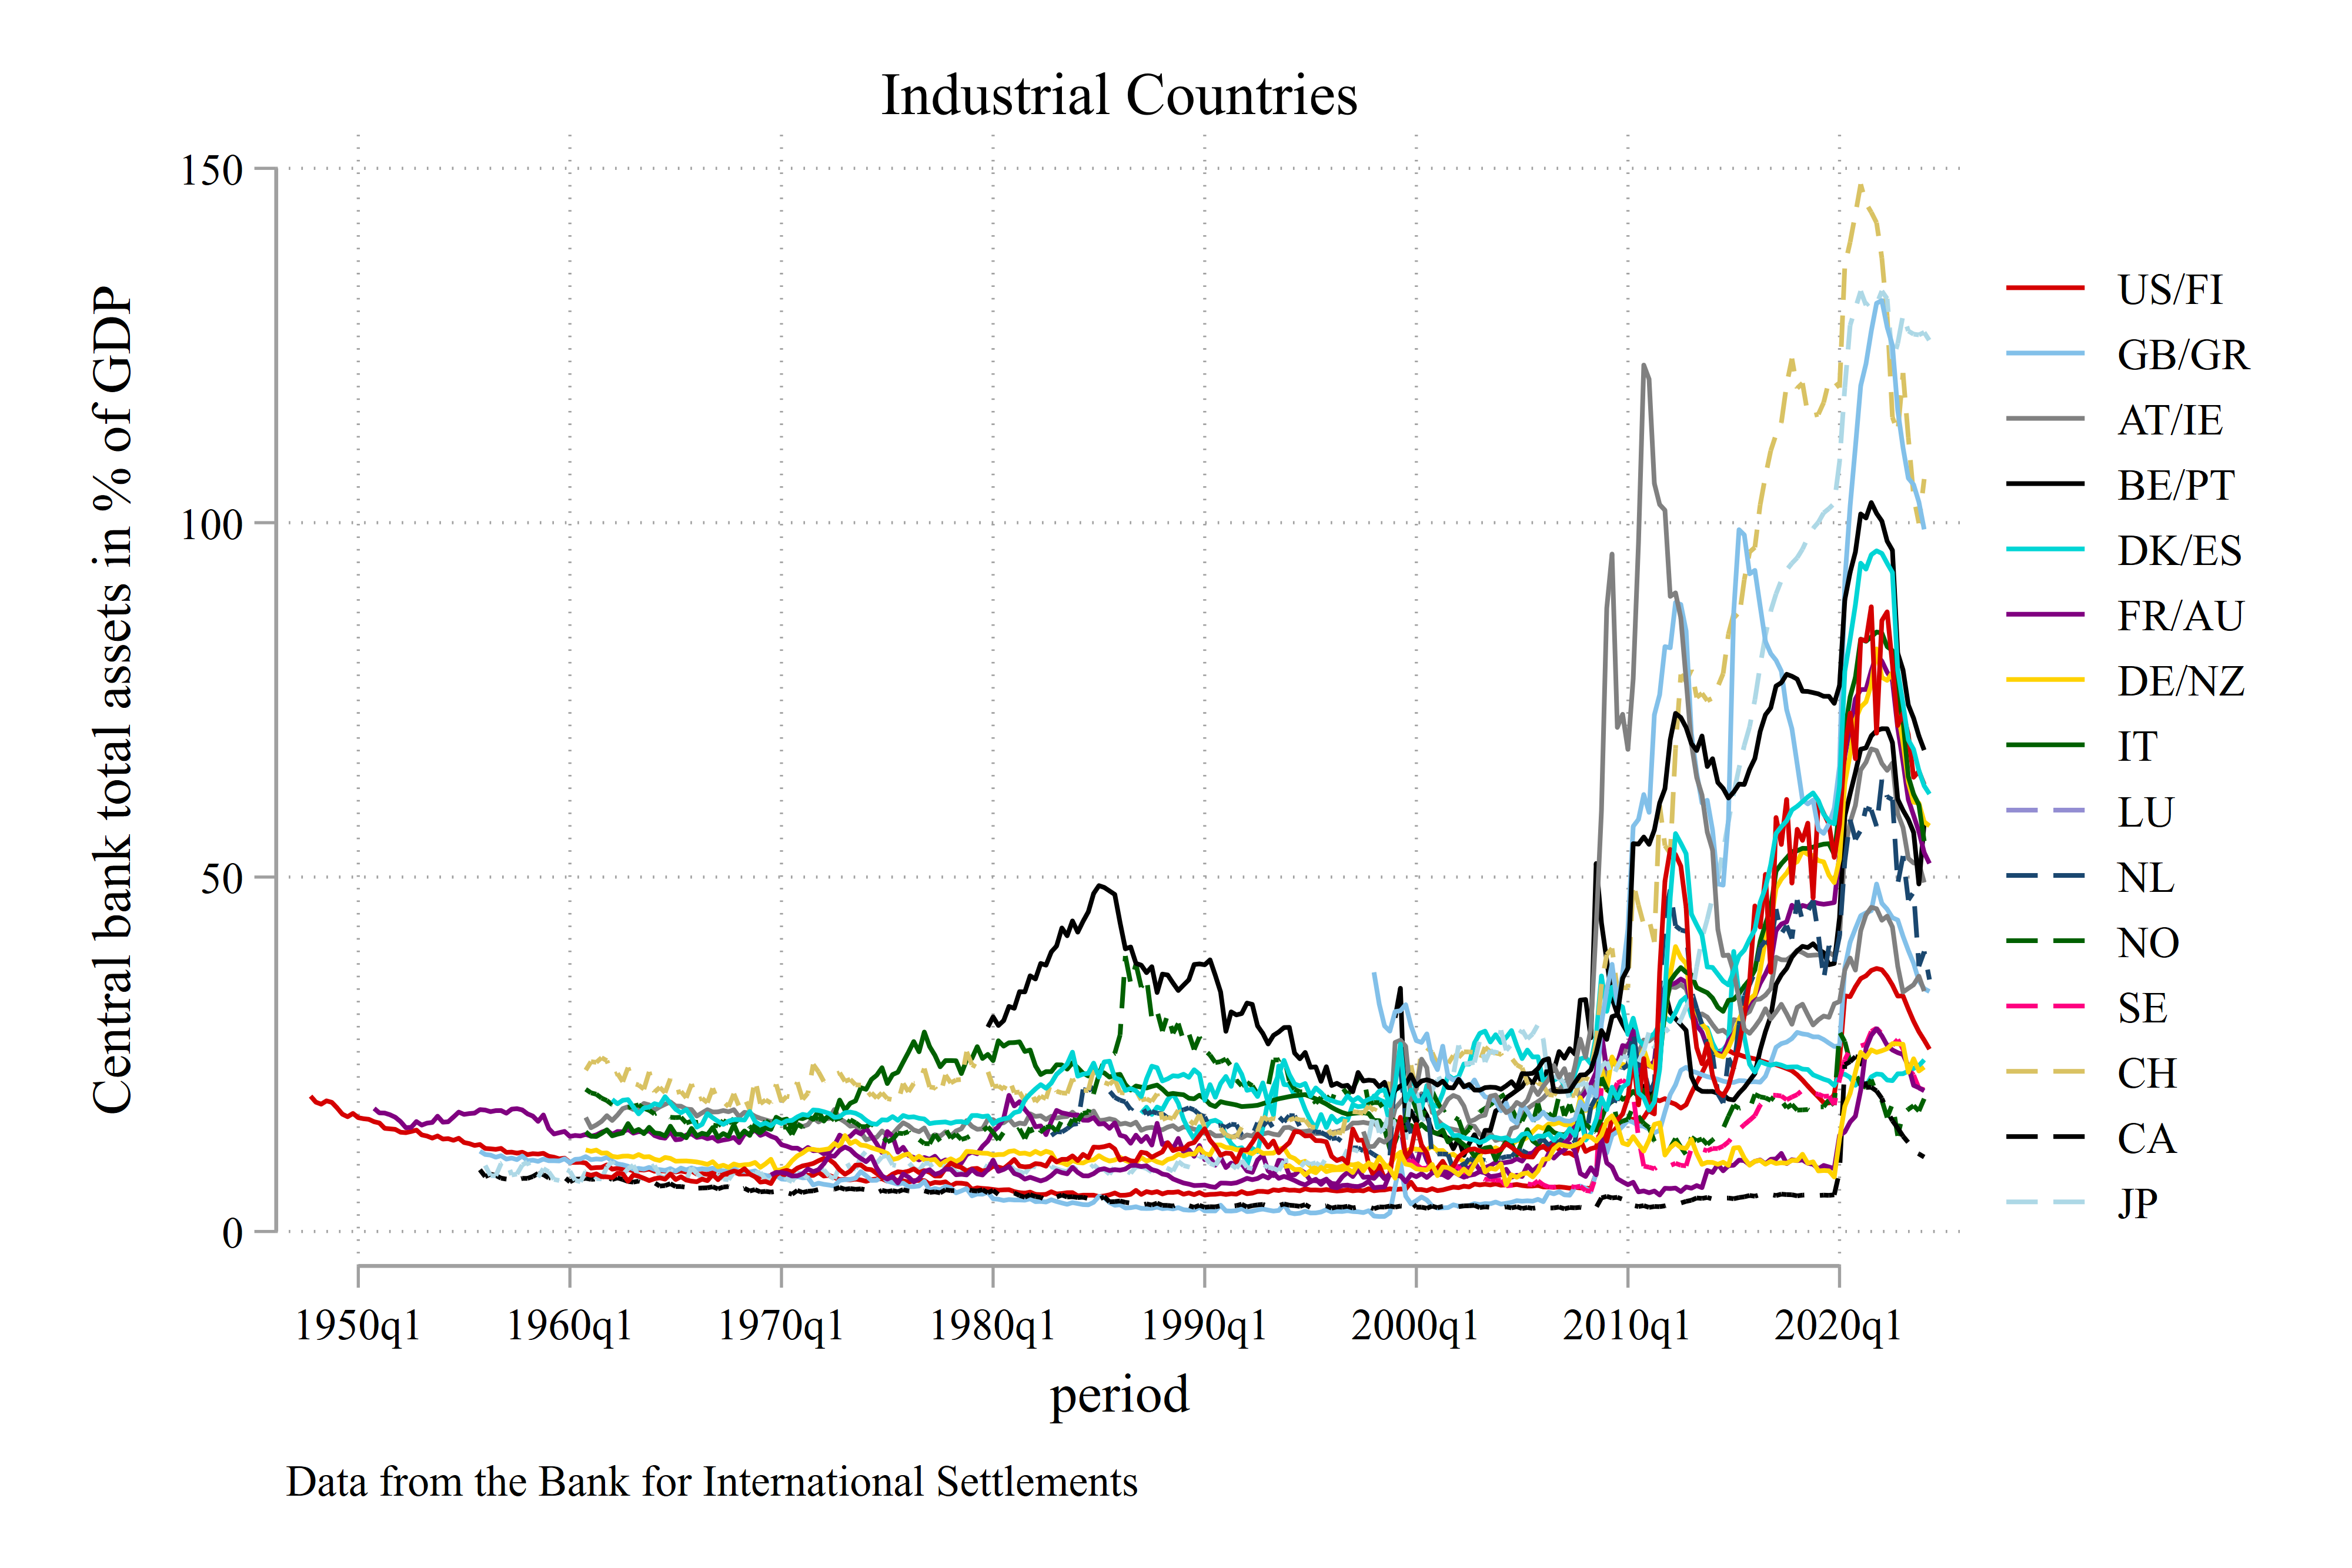
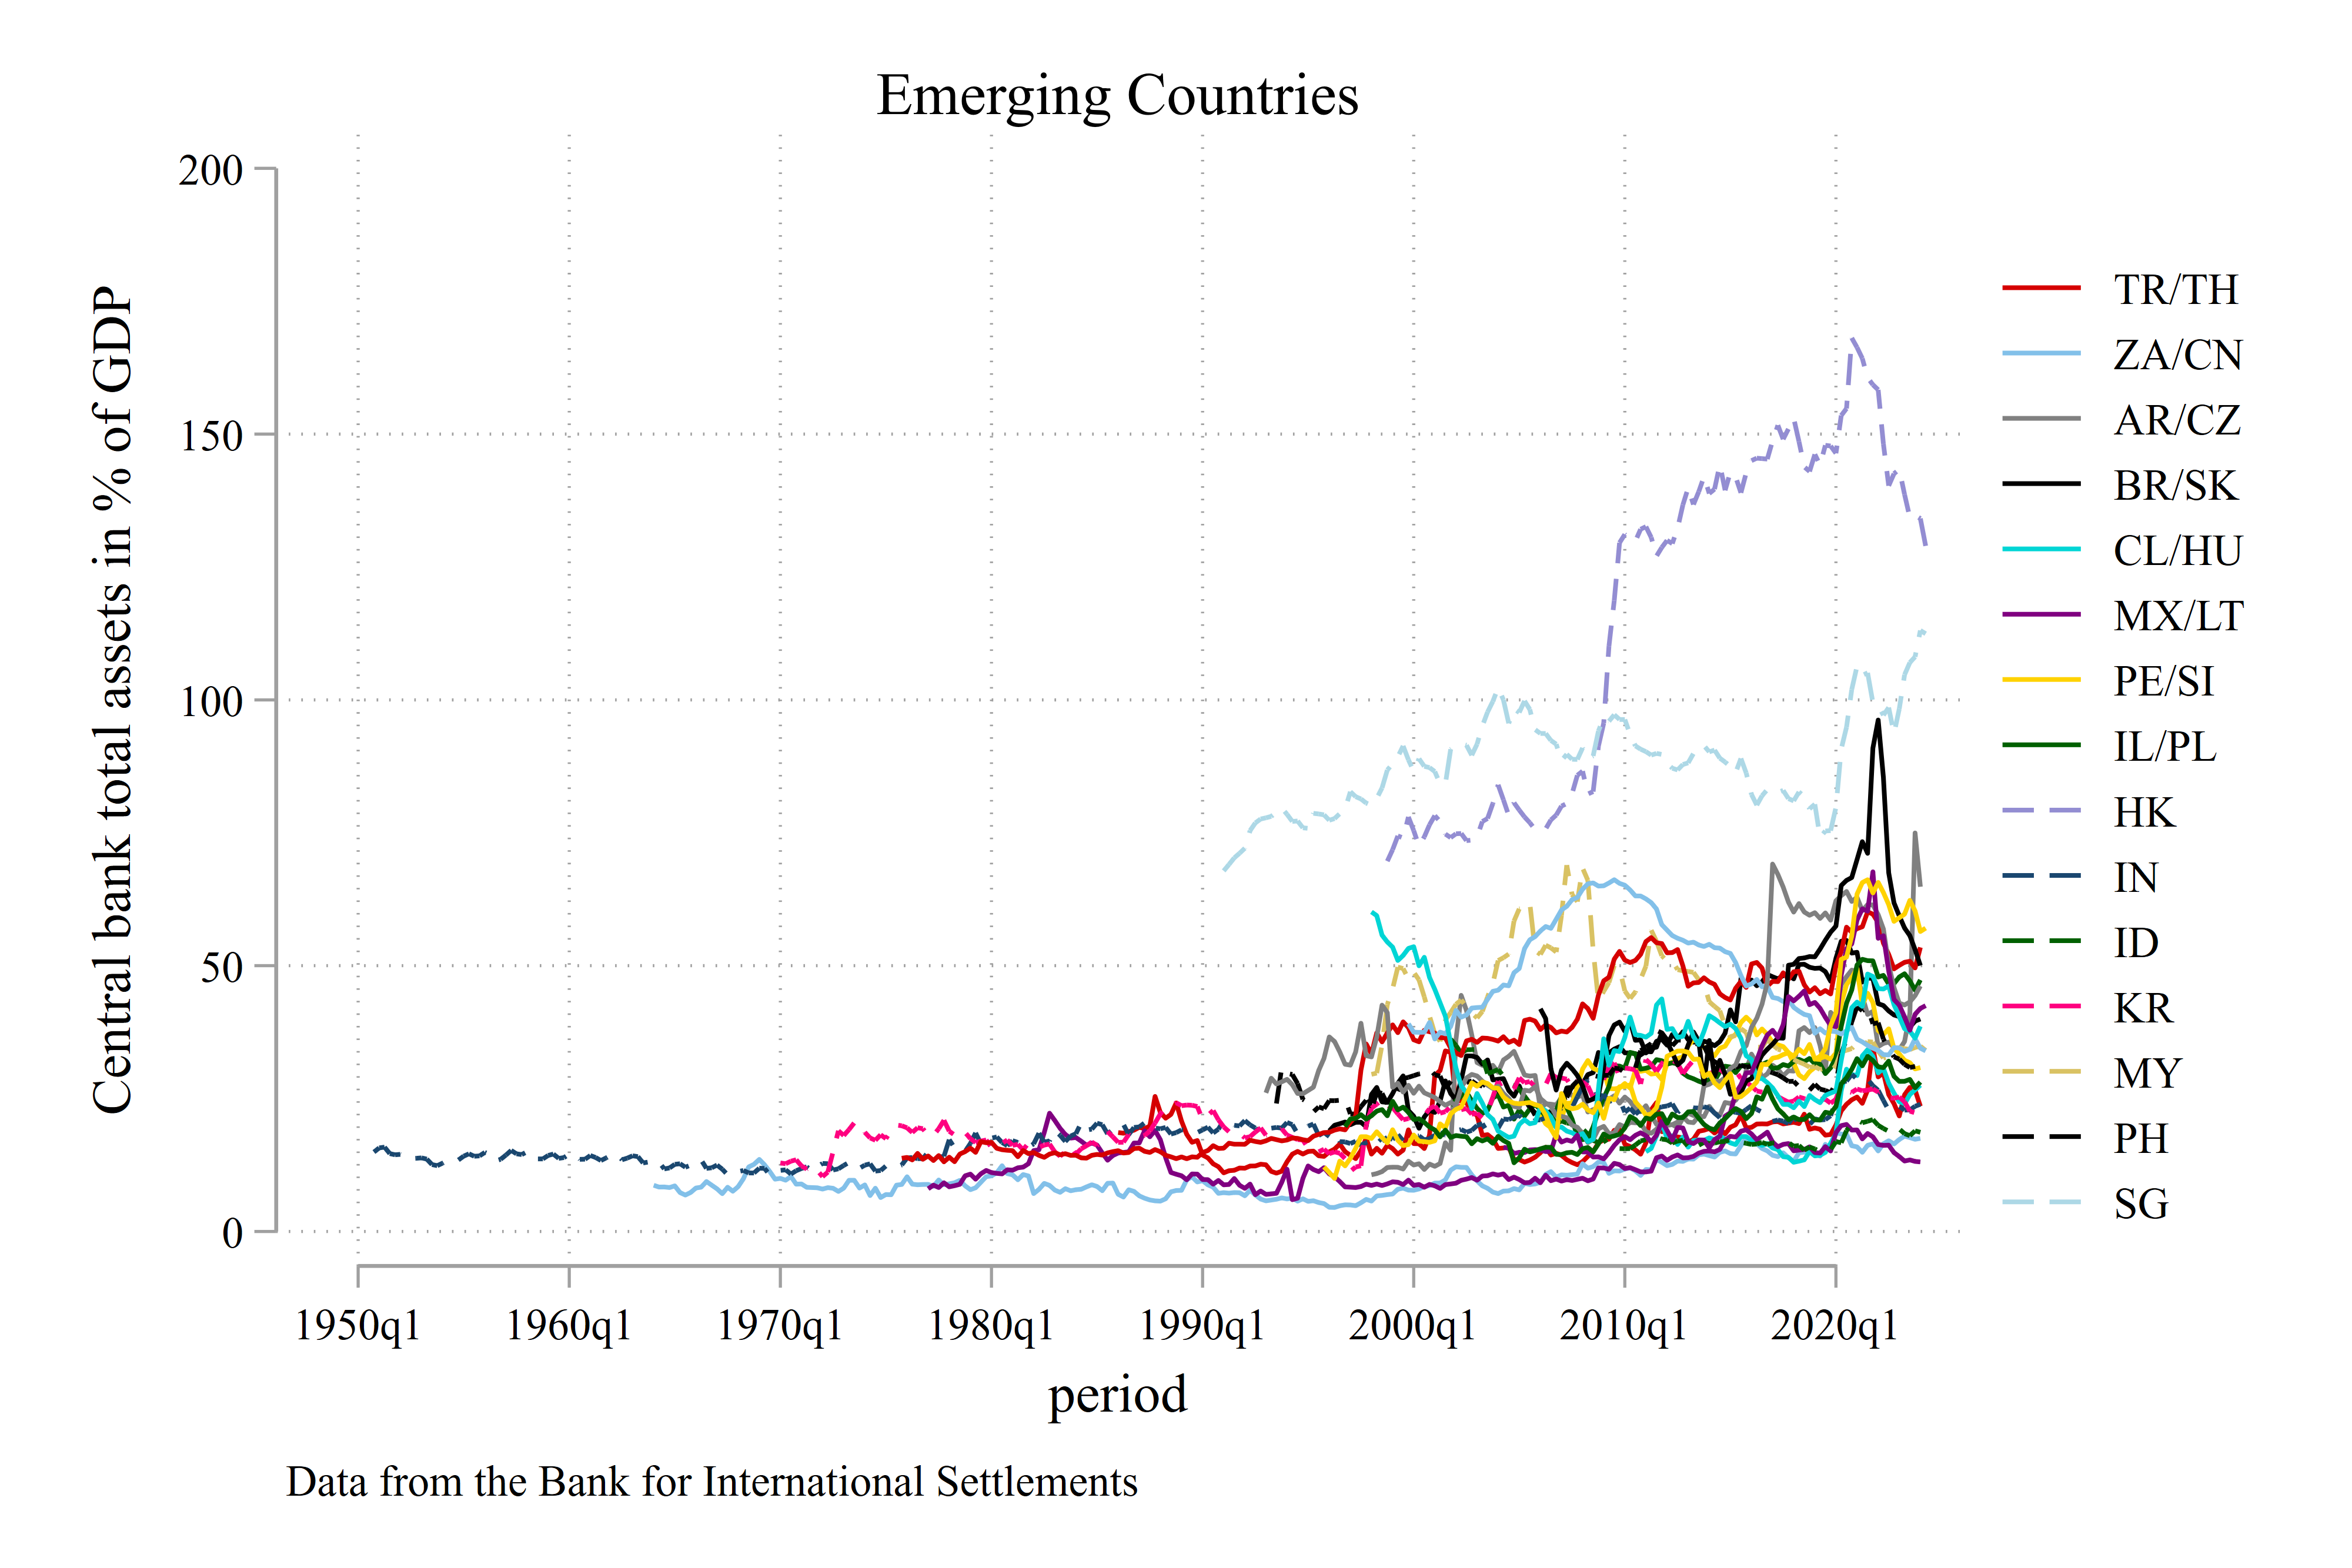
The Bank for International Settlements has produced a formidable effort to construct historical series for central bank total assets. The data and the methodology are available on their website.
In this blog, I will show you how to use Jupyter and Stata to produce the following two graphs below. You need to install Jupyter and have access to Stata to reproduce the blog.


I also recommend consulting my series of blogs on DBnomics and Jupyter, since I will be a bit fast on some part that have been already covered on EconMacro.
We start by selecting the desired data on the web portal, then I chose ‘Export’, ‘Code snippet’, and ‘Jupyter’ for using the URL later in the Jupyter notebook. I selected all the countries for the series express as ratio of GDP. I can change the selection and the code snippet will change accordingly.


Now, I launch Jupyter and run the following code, where the URLs come from the previous step (I thank Olivier that suggest me to shorten the part with the two-letter codes for the country names in bold), and I specified the folder (use / as separator for the different folders) where I want the Stata Data to be exported. Do not forget to convert string columns to a maximum length of 244, or the code will not be able to export the data in Stata format:
import os  # Make sure to import the os module

# https://data.bis.org/topics/CBTA

import pandas as pd

urls = ["https://stats.bis.org/api/v2/data/dataflow/BIS/WS_CBTA/1.0/Q...USD+XDC+XDF_R_B1GQ?format=csv"]

df = pd.concat([pd.read_csv(url) for url in urls])

dataframes = []

for url in urls:
    try:
        df = pd.read_csv(url)
        dataframes.append(df)
    except Exception as e:
        print(f"Failed to read {url}: {e}")

if dataframes:
    df = pd.concat(dataframes)
    print("Data successfully concatenated.")

    # Check and convert string columns to a maximum length of 244
    for col in df.select_dtypes(include=['object']).columns:
        df[col] = df[col].astype(str).str.slice(0, 244)

    # Specify the folder where you want to save the file
    folder_path = "C:/Users/jamel/Dropbox/Jupyter"  # Change this to your desired folder path

    # Ensure the folder exists
    if not os.path.exists(folder_path):
        os.makedirs(folder_path)

    # Full file path
    file_path = os.path.join(folder_path, "concatenated_data_test.dta")

    # Attempt to export to Stata
    try:
        df.to_stata(file_path, write_index=False)
        print(f"Data successfully exported to {file_path}")
    except ValueError as e:
        print(f"Error exporting to Stata: {e}")
else:
    print("No data was loaded.")
Now, I will rely on several Stata packages (use \ for the separator of different folders) that I discussed in some of my previous posts to draw the figures presented at the top of this blog.
clear

set scheme Cleanplots
graph set window fontface "Times New Roman"

use "C:\Users\jamel\Dropbox\Jupyter\concatenated_data.dta"

des

kountry   REF_AREA, from(iso2c)
rename    NAMES_STD country
kountry   REF_AREA, from(iso2c) to(imfn)
rename    _IMFN_ imfcode

replace   country = "United Arab Emirates" if REF_AREA == "AE"
replace   country = "Euro Area" if REF_AREA == "XM"


split    TIME_PERIOD, parse(-)
replace  TIME_PERIOD2="1" if TIME_PERIOD2=="Q1"
replace  TIME_PERIOD2="4" if TIME_PERIOD2=="Q2"
replace  TIME_PERIOD2="7" if TIME_PERIOD2=="Q3"
replace  TIME_PERIOD2="10" if TIME_PERIOD2=="Q4"
gen      string = "1" + ///
         "/" + TIME_PERIOD2 + ///
         "/" + TIME_PERIOD1
gen      date = date(string, "DMY")
format   date %td
generate qtr = quarter(date)
generate period = qofd(date)
format   period %tq

split    TITLE, parse(-)
rename   TITLE3 UNITS

rename   OBS_VALUE assets

order imfcode period assets country REF_AREA UNITS ///
 UNIT_MEASURE CURRENCY

replace imfcode=999 if country=="Euro Area"
labmask imfcode, value(REF_AREA)

keep if UNITS == "spliced, GDP"

xtset imfcode period
tsfill, full
xtset imfcode period
xtdes

drop if country == "Luxembourg"

lab var assets "Central bank total assets in % of GDP"

rename imfcode cn
group_dummy
rename cn imfcode

xtline assets if idc==1, ///
overlay title("Industrial Countries") ///
note("Data from the Bank for International Settlements")
graph rename idc, replace
graph export idc.png, as(png) width(4000) replace

xtline assets if emg==1, ///
overlay title("Emerging Countries") ///
note("Data from the Bank for International Settlements")
graph rename emg, replace
graph export emg.png, as(png) width(4000) replace

3 Comments
Dear Jamel, thank you for this post. Perhaps, as a suggestion, you may consider leaving the “reference area” field empty to get all the countries and avoid typing the iso codes manually. For example: https://stats.bis.org/api/v2/data/dataflow/BIS/WS_CBTA/1.0/Q..B.USD+XDF_R_B1GQ._Z.B?format=csv Thank you
Dear Jamel,
thank you this post.
Perhaps, as a suggestion, you may consider leaving the “reference area” field empty to get all the countries and avoid typing the iso codes manually. For example: https://stats.bis.org/api/v2/data/dataflow/BIS/WS_CBTA/1.0/Q..B.USD+XDF_R_B1GQ._Z.B?format=csv
Thank you
Thank you very much, Oliver! That’s perfect. I will change the code in the blog.
import os # Make sure to import the os module
# https://data.bis.org/topics/CBTA
import pandas as pd
urls = [“https://stats.bis.org/api/v2/data/dataflow/BIS/WS_CBTA/1.0/Q…USD+XDC+XDF_R_B1GQ?format=csv”]
df = pd.concat([pd.read_csv(url) for url in urls])