The clean energy transition depends on reliable supplies of minerals whose production is exposed to geopolitical tensions. When political uncertainty delays investment or threatens supply chains, the consequences reach the prices of the materials used in electricity networks, renewable energy equipment, and energy storage.
Our paper, Ensuring the security of the clean energy transition: Examining the impact of geopolitical risk on the price of critical minerals, written with Russell Smyth and Joaquin Vespignani and published in Energy Economics, examines this relationship for aluminium, copper, nickel, platinum, tin, and zinc. It combines a framework linking non-technical risk to supply responsiveness with constant and time-varying parameter local projections.
The central finding is that geopolitical threats generally produce larger and faster price responses than geopolitical acts. The strength of the response also changes across minerals and historical periods. Copper provides a striking example: its maximum estimated response to a threat shock reaches 11.67% at the 48-month horizon, compared with 6.81% for an act shock.
Read the published article · Read the open-access paper (PDF) · Replication data and Stata code
Why the investment environment matters
The paper’s conceptual framework connects geopolitical risk to the supply of critical minerals. Political instability, regulatory uncertainty, and social and environmental risks can delay the development of mining projects. These non-technical risks constrain supply adjustment and amplify the price response to geopolitical disruption.
The geographical distribution of reserves matters because it determines the institutional environments in which future production must develop. Following Vespignani and Smyth (2024), the paper weights countries’ investment-attractiveness scores by their shares of each mineral’s proven reserves. A normalized shortfall relative to a benchmark composed of coal, gold, and iron ore measures the non-technical risk premium:
Here, \(w_{c,m}\) is country \(c\)’s share of global proven reserves of mineral \(m\), \(S_c\) is its investment-attractiveness score, and \(IAI_{NC}\) is the benchmark score. A lower \(IAI_m\) indicates greater non-technical risk; a higher \(NTRP_m\) indicates a larger shortfall relative to the benchmark. This premium measures the relative investment environment.
The premiums are highest for platinum (33.8%), copper (28.0%), and nickel (24.3%), followed by tin (22.2%), aluminium (20.0%), and zinc (12.8%). The decomposition reported in the paper highlights the importance of policy perceptions in explaining these risks.
Tracing price responses over time
The empirical analysis uses monthly data spanning 1985–2024. Mineral prices come from the World Bank’s Pink Sheet. The specifications incorporate global economic conditions and global inflation, together with the geopolitical risk index developed by Caldara and Iacoviello (2022) and its separate measures of threats and acts.
The paper identifies geopolitical shocks through an SVAR with twelve lags and estimates their effects using local projections. Its time-varying specification allows the response at a given horizon to change with the date of the shock. Using the paper’s notation:
The outcome \(cms\) denotes the mineral-price variable, \(gecon\) global economic conditions, and \(ginf\) global inflation. The impulse variable \(\varepsilon^{gpr}_t\) is the identified geopolitical shock. The coefficient \(\beta_{h,t+h}\) traces its dated effect at horizon \(h\). The analysis examines aggregate risk, threats, and acts separately, with responses reported through 48 months.
Copper prices respond persistently to geopolitical threats
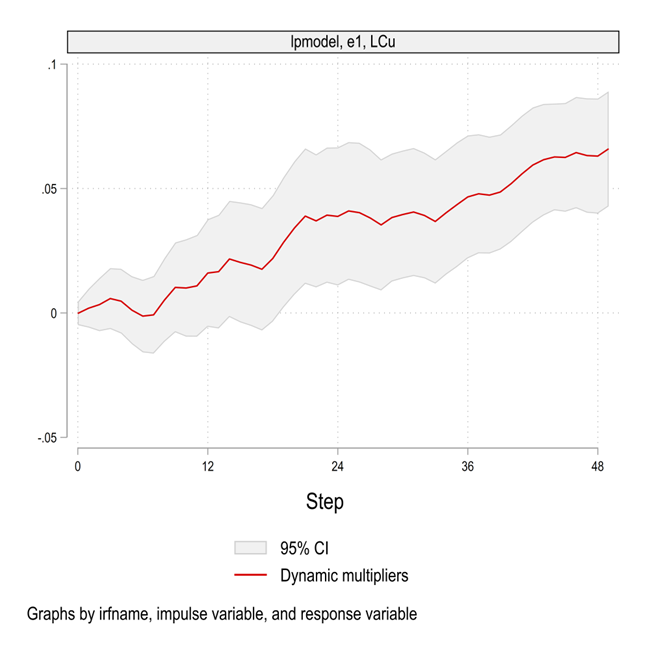
The copper panel in Figure 8 of the published article shows the constant-parameter response to an identified geopolitical threat shock. The price response strengthens over the projection horizon and reaches approximately 5% after 48 months. This persistence is consistent with the paper’s supply-side interpretation: uncertainty surrounding future disruption affects investment and the conditions under which mineral supply expands.
Copper’s sensitivity changes over time
The TVP-LP estimates add a historical dimension to this evidence. For each date, the model estimates a response across horizons. The green curves display these dated responses, while the black curve shows the constant-parameter benchmark. Their dispersion reveals substantial variation in copper’s sensitivity to geopolitical shocks, particularly at medium and long horizons.
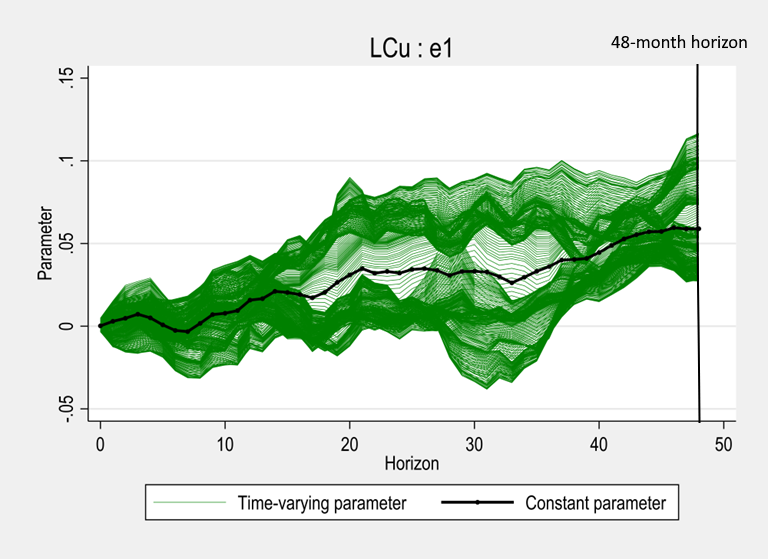
This distinction is economically consequential. A constant-parameter estimate summarizes transmission over the sample, while the dated responses show how strongly copper prices react in particular historical environments. Several estimated responses rise substantially above the constant-parameter benchmark at longer horizons.
Why threats have larger effects
The distinction between threats and acts is central to the economic mechanism. Persistent threats complicate firms’ investment decisions by increasing uncertainty about future disruption. Delayed commitments constrain the expansion of supply. The paper’s framework therefore predicts larger price effects from geopolitical threats, and the empirical results broadly support this prediction.
For copper, the maximum time-varying response at the 48-month horizon is 11.67% for geopolitical threats and 6.81% for geopolitical acts, as reported in Figure 10 of the paper. These values describe responses to a one-unit identified shock under the paper’s normalization. Each maximum is taken over the estimated historical response path and can correspond to a different date.
The paper locates copper’s maximum threat response around the Gulf War and reports that it is statistically significant at the 5% level. The copper results therefore illustrate both a persistent positive price response and substantial historical variation in its magnitude.
The cross-mineral evidence is broadly consistent with greater non-technical risk amplifying price responses. Platinum is the main exception. The paper interprets its comparatively muted response through the expansion of battery electric vehicles, which reduces demand for the catalytic converters used in combustion engines. In this interpretation, weaker demand offsets part of the upward price pressure associated with supply disruption.
Two related EconMacro posts
Critical Minerals Data Explorer connects the paper’s copper-price results to the International Energy Agency’s explorer of projected mineral demand and supply. It illustrates how requirements differ across electricity networks, electric vehicles, renewable generation, and other clean-energy technologies.
Improving the visualization of time-varying coefficients uses this paper’s data and Stata code to extract and display dated impulse responses and confidence bounds. Its copper application shows how to plot the response paths alongside geopolitical threats.
Read the paper
The contribution is to connect the institutional geography of mineral supply with the changing transmission of geopolitical shocks to prices. Energy security depends on the conditions under which mining investment proceeds, and those conditions help explain why similar geopolitical disturbances produce different responses across minerals.
The paper’s policy interpretation emphasizes reducing non-technical risk, especially uncertainty surrounding the policy environment. Its appendices document the decomposition of investment risk, responses after the global financial crisis, periods of high geopolitical risk and weak global activity, and the evolution of responses at different horizons.
Saadaoui, J., Smyth, R., and Vespignani, J. (2025). Ensuring the security of the clean energy transition: Examining the impact of geopolitical risk on the price of critical minerals. Energy Economics, 142, 108195. https://doi.org/10.1016/j.eneco.2025.108195.
Open-access paper and appendices (PDF) · Replication archive
Selected references
Caldara, D., and Iacoviello, M. (2022). Measuring geopolitical risk. American Economic Review, 112(4), 1194–1225.
Inoue, A., Rossi, B., and Wang, Y. (2024). Local projections in unstable environments. Journal of Econometrics, 105726.
Jordà, Ò. (2005). Estimation and inference of impulse responses by local projections. American Economic Review, 95(1), 161–182.