An improvement in relations between major powers can lower oil prices today and raise them later. The paper interprets this sequence through an initial decline in precautionary demand and a subsequent strengthening of expected energy demand as the outlook for trade and activity improves. The timing of these forces matters for understanding how diplomacy moves commodity markets.
My paper, Geopolitical Turning Points and Macroeconomic Volatility: A Bilateral Identification Strategy, published in the Journal of Comparative Economics, examines this pattern through US–China political relations. It introduces an instrument based on abrupt changes in the trajectory of bilateral relations and combines it with mean and quantile local projections.
The central result is a short-run decline followed by a medium-run increase in real oil prices. The response also differs across the conditional distribution: the early decline is stronger at lower quantiles, while the later increase is stronger at upper quantiles. Both the horizon and the part of the distribution therefore shape the economic consequences of a geopolitical improvement.
Read the published article · Open-access PDF · Stata replication files
The information in a geopolitical turning point
The Political Relationship Index (PRI), developed at Tsinghua University, measures China’s bilateral relations with its major partners using events recorded in Chinese sources, including People’s Daily and the Ministry of Foreign Affairs. It ranges from −9 to 9, with higher values indicating better relations. Its coverage of cooperative and adverse events makes it useful for studying diplomatic improvements as well as deteriorations.
Let \(r_t\) denote the PRI in its original units. The instrument is the change in its monthly change:
\[ z_t=\Delta^2 r_t =\Delta r_t-\Delta r_{t-1} =r_t-2r_{t-1}+r_{t-2}. \tag{1} \]
This construction identifies a change of trajectory. A positive turning point can occur when a deterioration stops, even if the relationship remains strained. Conversely, a rapprochement that loses momentum produces a negative second difference. For illustration, a monthly change moving from −1 to 0 gives \(z_t=+1\); a change moving from +1 to 0 gives \(z_t=-1\).
The May 1999 bombing of the Chinese embassy in Belgrade illustrates the distinction. Relations deteriorated sharply and then stabilised the following month. The end of that deterioration contained new information about the geopolitical outlook. The paper also relates large movements in the instrument to the Taiwan Strait crisis and the onset of the US–China trade war.
From bilateral news to an instrumented response
The second difference in equation (1) uses the original PRI. Following the paper, the instrumented regressor uses its log-modulus transformation:
\[ s_t=\operatorname{sgn}(r_t)\log(1+|r_t|). \tag{2} \]
This transformation preserves the ordering of political relations and accommodates negative values and zero.
The monthly sample runs from January 1990 to March 2022. Let \(p_t\) denote the logarithm of the real WTI oil price, and let \(x_t\) contain log world industrial production and global oil production growth. The mean local projection at horizon \(h\) is:
\[ \begin{aligned} p_{t+h}={}&\alpha_h+\beta_h s_t +\sum_{j=1}^{2}\gamma_{h,j}’x_{t-j}\\ &+\sum_{g=1}^{3}\phi_{h,g}p_{t-g} +\sum_{k=1}^{2}\lambda_{h,k}s_{t-k} +u_{t+h}, \qquad h=0,\ldots,48. \end{aligned} \tag{3} \]
The regression instruments \(s_t\) with \(z_t\). It includes two lags of the oil-market controls and transformed PRI, together with three lags of the oil price. The additional oil-price lag implements the paper’s lag-augmented specification. A separate projection traces the response at each horizon over four years.
The causal interpretation rests on the paper’s conditional exclusion restriction: after accounting for this lagged information, turning-point variation affects oil prices through the bilateral geopolitical state. Abrupt diplomatic events motivate this restriction. Changes in precautionary demand and expected economic activity are the transmission mechanisms through which the relationship state influences oil prices.
The documented first-stage evidence is strong. In the US–China application, the partial \(R^2\) is approximately 0.83–0.90 across horizons, and the robust first-stage \(F\)-statistics exceed 230. These statistics establish instrument relevance. The paper separately presents the historical event alignment and a two-month-lead placebo exercise as evidence bearing on the timing of the geopolitical variation.
The oil-price response changes sign over time
The mean estimates display a clear sequence. Following an improvement in US–China relations, the oil-price response becomes negative at short horizons and positive over the medium run. The paper reports a decline of approximately 0.2% after six months and an increase of approximately 0.3% after 32 months.
| Horizon | Reported oil-price response | Economic interpretation |
|---|---|---|
| 6 months | −0.2% | Lower real oil prices following the geopolitical improvement |
| 32 months | +0.3% | Higher real oil prices as the medium-run response develops |
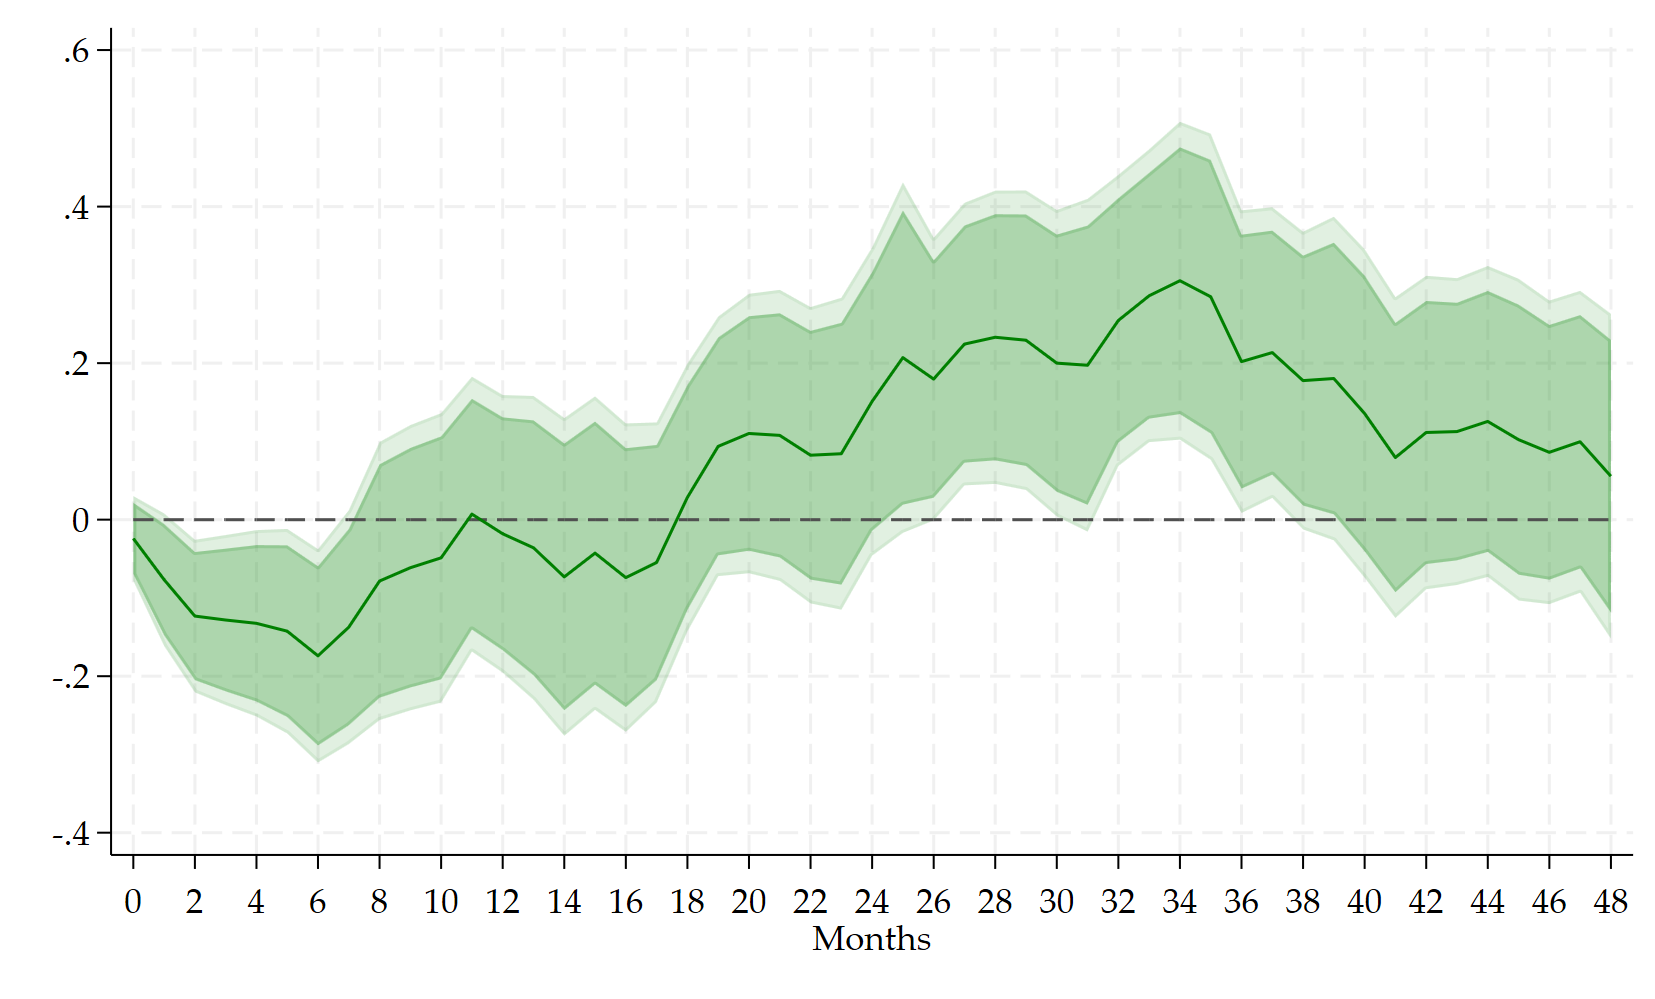
The paper interprets this sequence through two economic forces. In the short run, diplomatic improvement reduces perceived geopolitical risk and precautionary oil demand. Over a longer horizon, better relations support expectations of trade, production, and energy consumption. The estimated reversal is consistent with the changing balance between these forces.
Different responses across the oil-price distribution
Quantile IV local projections extend the analysis to the distribution of future oil prices. The paper combines local projections with the instrumental quantile regression approach of Chernozhukov and Hansen (2006), estimating a separate response \(\beta_h(\tau)\) for each horizon and quantile.
The results reveal larger short-run declines at lower conditional quantiles and larger medium-run increases at upper conditional quantiles. The mean response therefore combines movements of different magnitudes across the distribution. A geopolitical improvement changes the shape of the oil-price outlook as well as its central tendency.
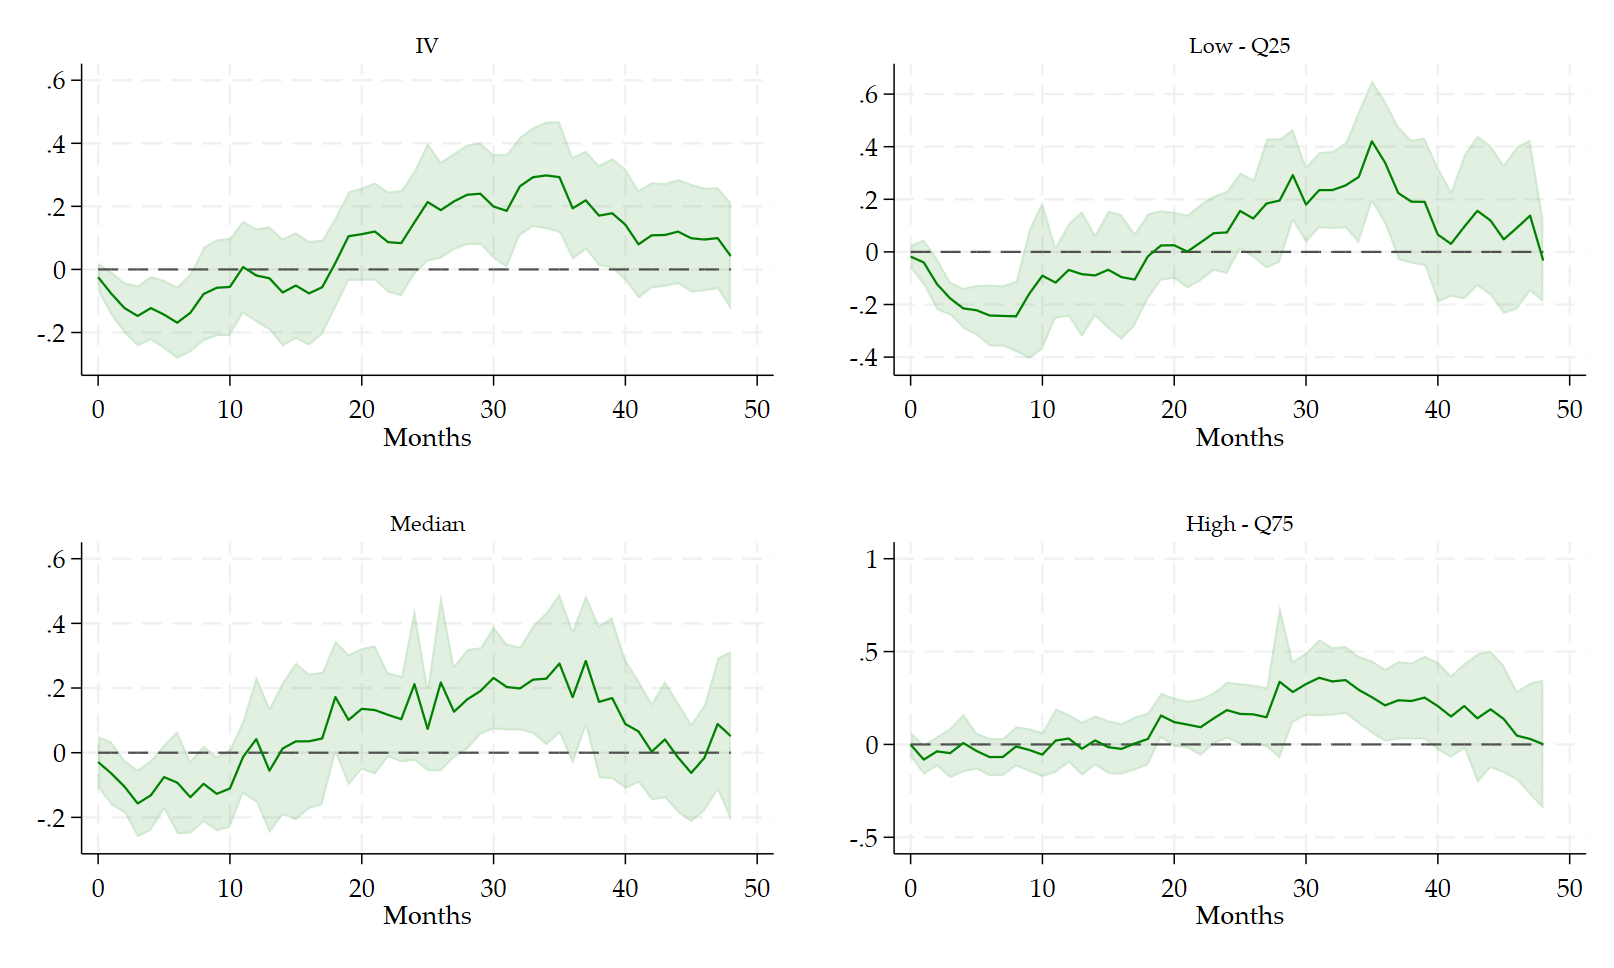
The quantile index refers to the conditional distribution of the future outcome. This interpretation locates the heterogeneity precisely: the response at a lower quantile describes the lower part of the future oil-price distribution, while the response at an upper quantile describes its upper part.
Evidence from Japan–China relations
The Japan–China application provides a comparison involving a different bilateral history. Its turning-point series captures episodes associated with maritime disputes and diplomatic tensions, including the 2010 rare-earth dispute and the 2012 Senkaku nationalisation.
The estimates reproduce the same broad sequence: an initial decline in oil prices followed by a medium-run increase. The quantile results also show stronger early declines in the lower tail and stronger later increases in the upper tail. Confidence intervals are wider, particularly at longer horizons and in the tails.
Appendix C considers the co-movement of China’s relations with other partners. Adding changes in those bilateral relationships leaves the qualitative oil-price pattern intact. Together, these exercises connect the US–China findings to a second dyad and account for the wider diplomatic environment.
The international macroeconomic significance
The contribution is to connect bilateral geopolitical turning points, dynamic oil-price adjustment, and distributional heterogeneity within one empirical framework. The oil market transmits news about a particular diplomatic relationship to economies far beyond the two countries involved.
For energy importers, the initial price decline and subsequent recovery imply different pressures on import costs and inflation over time. For exporters, the same sequence matters for export receipts and fiscal revenues. These implications follow from the paper’s oil-price mechanism: a diplomatic improvement can ease immediate risk while strengthening the outlook for energy demand.
The full article presents the identification strategy, mean and quantile responses, and the US–China and Japan–China comparisons. The replication files provide the Stata implementation.
Two related EconMacro posts
Geopolitical Turning Points and Macroeconomic Volatility: Relevance, Anticipation, and Exclusion develops the economic reasoning behind the instrument and the conditional exclusion restriction.
Instrument Diagnostics after Local Projections using locproj with Stata shows the implementation of the mean response and the corresponding first-stage diagnostics.
Read the paper and selected references
Saadaoui, J. (2026). Geopolitical turning points and macroeconomic volatility: A bilateral identification strategy. Journal of Comparative Economics, 54(3), 804–818.
Chernozhukov, V., and Hansen, C. (2006). Instrumental quantile regression inference for structural and treatment effect models. Journal of Econometrics, 132(2), 491–525.
Jordà, Ò. (2005). Estimation and inference of impulse responses by local projections. American Economic Review, 95(1), 161–182.
Mignon, V., and Saadaoui, J. (2024). How do political tensions and geopolitical risks impact oil prices? Energy Economics, 129, 107219.
Baumeister, C., and Hamilton, J. D. (2019). Structural interpretation of vector autoregressions with incomplete identification: Revisiting the role of oil supply and demand shocks. American Economic Review, 109(5), 1873–1910.