In a recent publication in Energy Economics, we found that geopolitical risk will drive up the price of several critical minerals, especially during episodes of heightened geopolitical tensions.
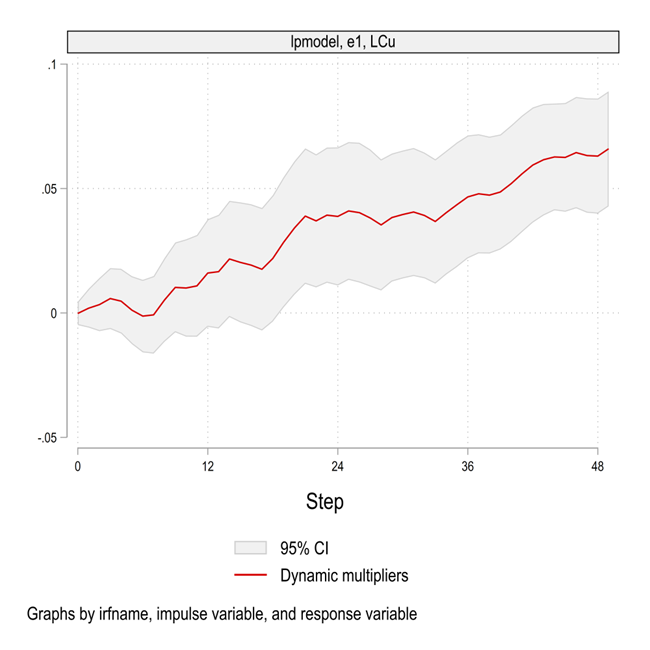
The elasticity of copper prices to geopolitical threats is around 5 percent after 48 months.
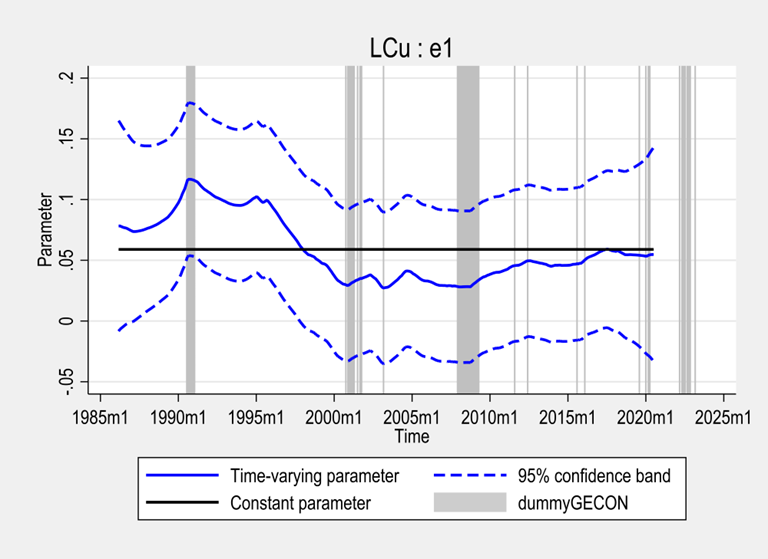
Besides, the elasticity of copper price to threats was higher during the years around the Gulf War and during the Trade War:
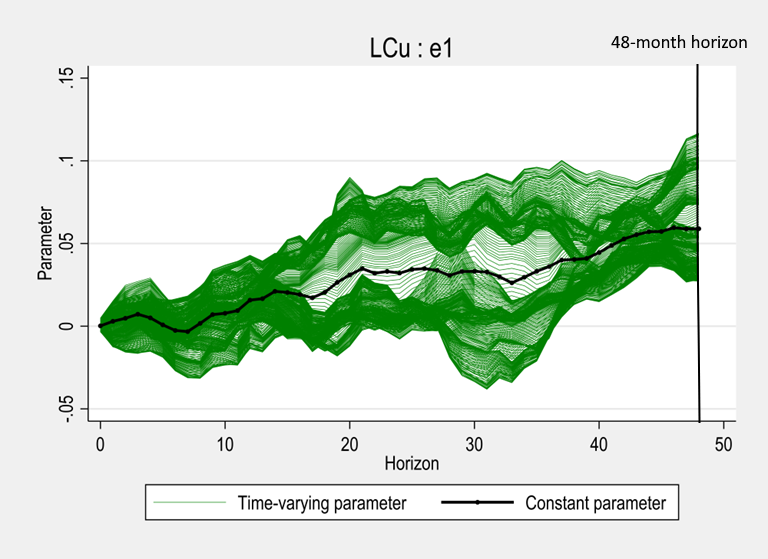
The blue curve below corresponds to the black line in the figure above, the path estimator at the 48-month horizon for the impulse response function. We can see that the elasticities of copper price to the geopolitical threats fluctuate between 5 percent and 12 percent.
See the article for more details.
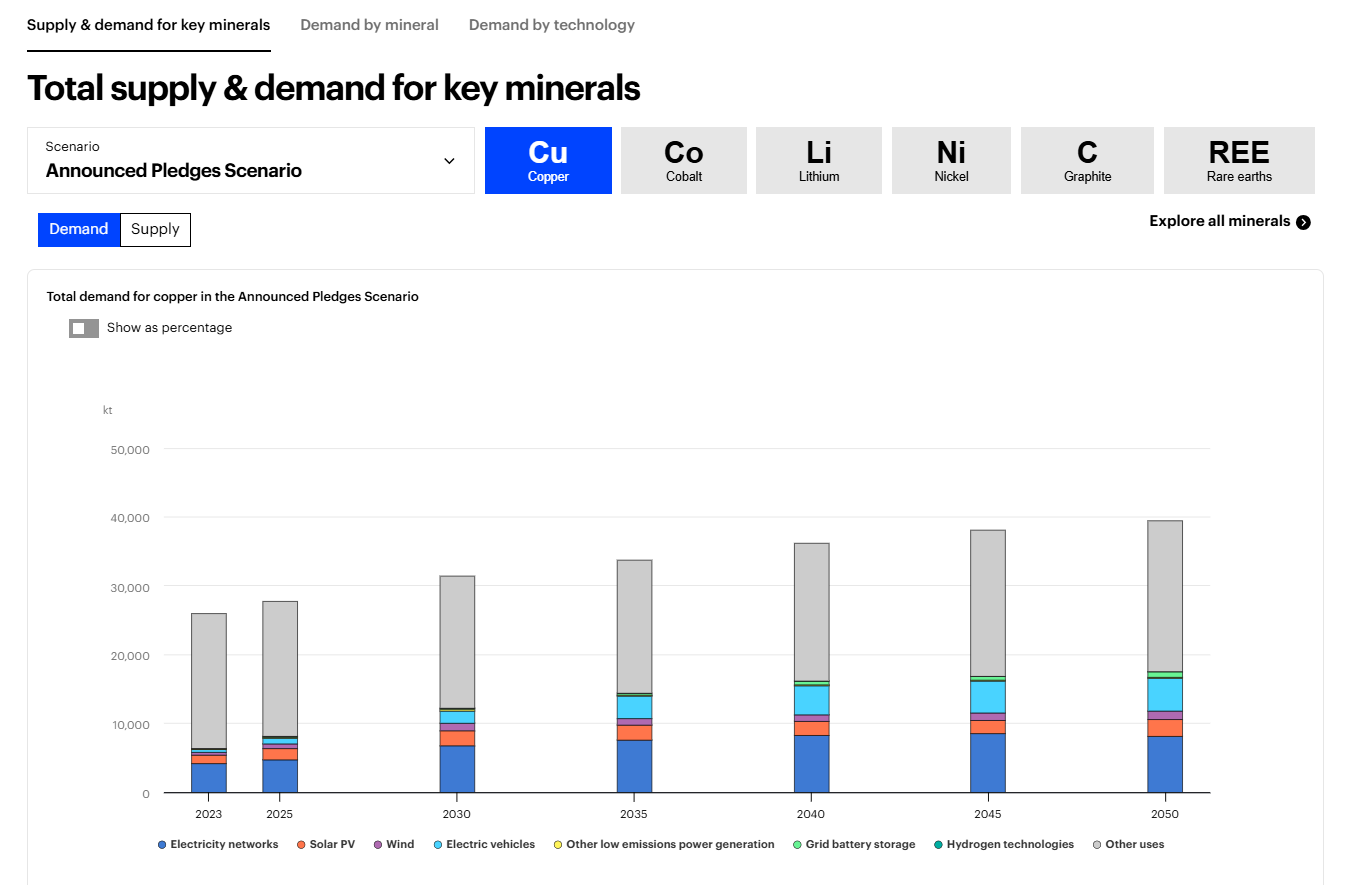
Now, we turn to the main topic of this blog. The International Energy Agency launched a new very useful data explorer on critical minerals:
https://www.iea.org/data-and-statistics/data-tools/critical-minerals-data-explorer
You can visualize the projected demand and projected supply for key critical minerals, let us take a look at the Copper demand:
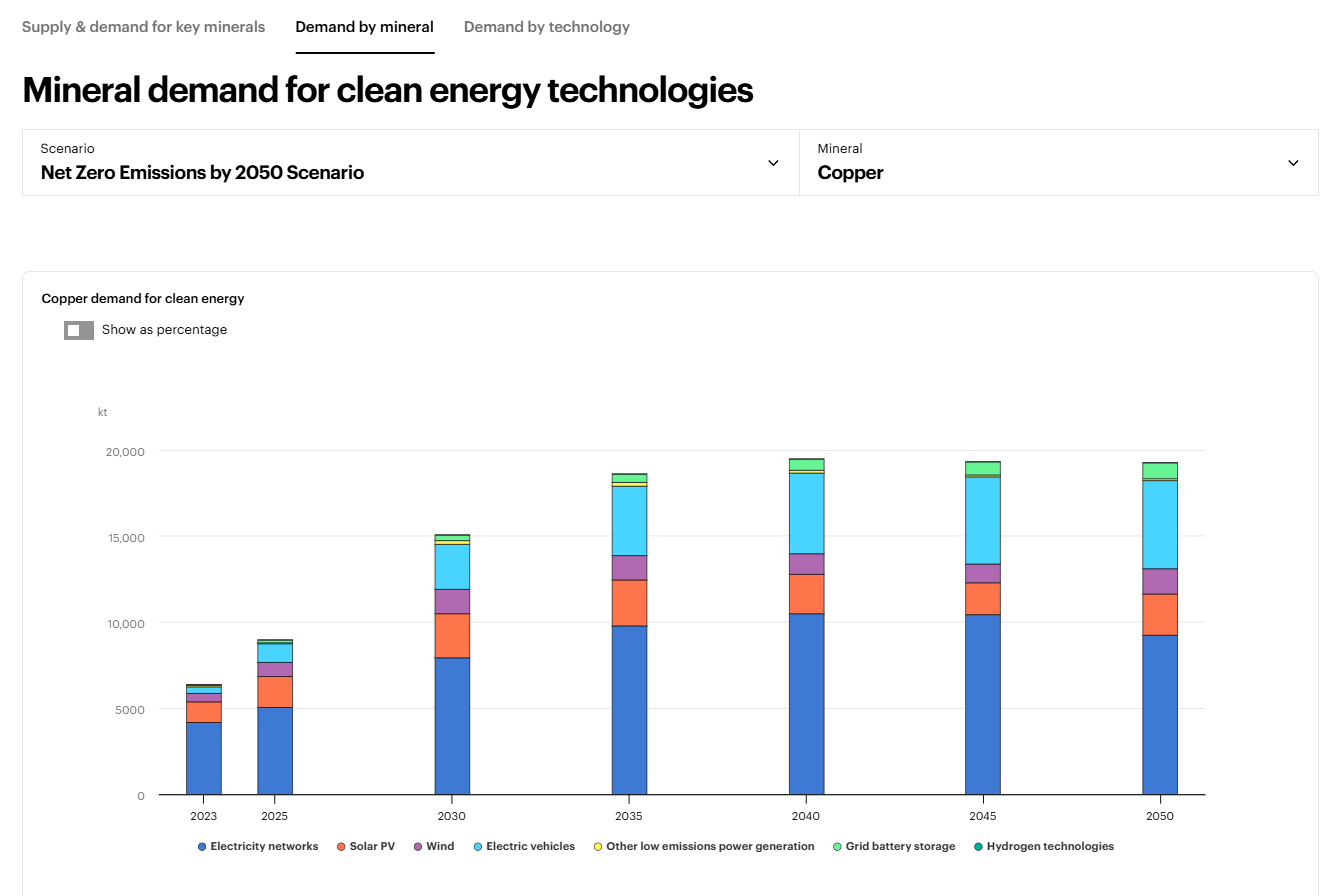
You can also visualize the mineral demand for clean energy technologies:
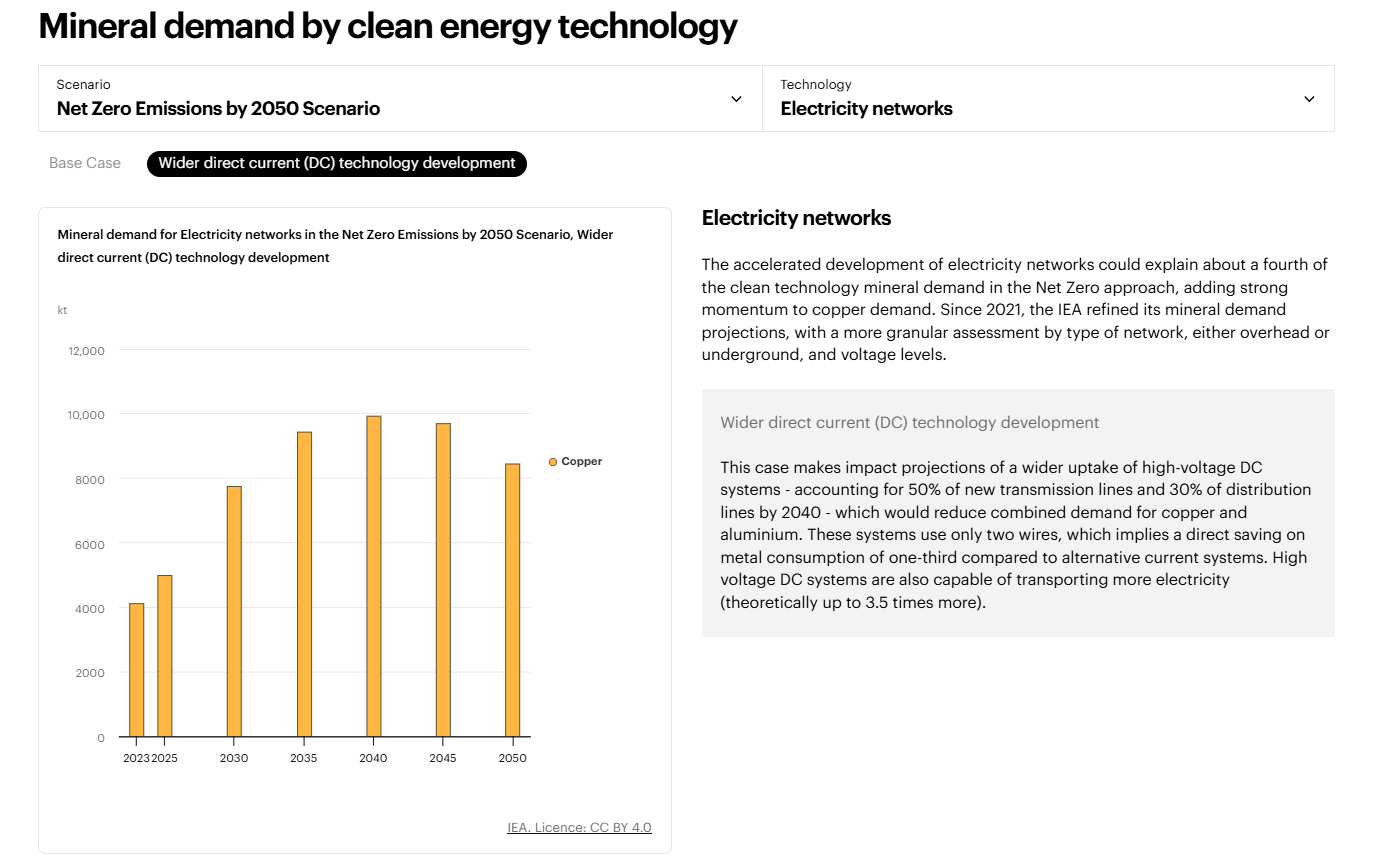
Likewise, you can visualize the demand per technology: Electric vehicles, electricity networks, grid battery storage, hydrogen technologies, solar PV, wind. Let us focus on electricity networks:
Let us take a look at the projections for supply:
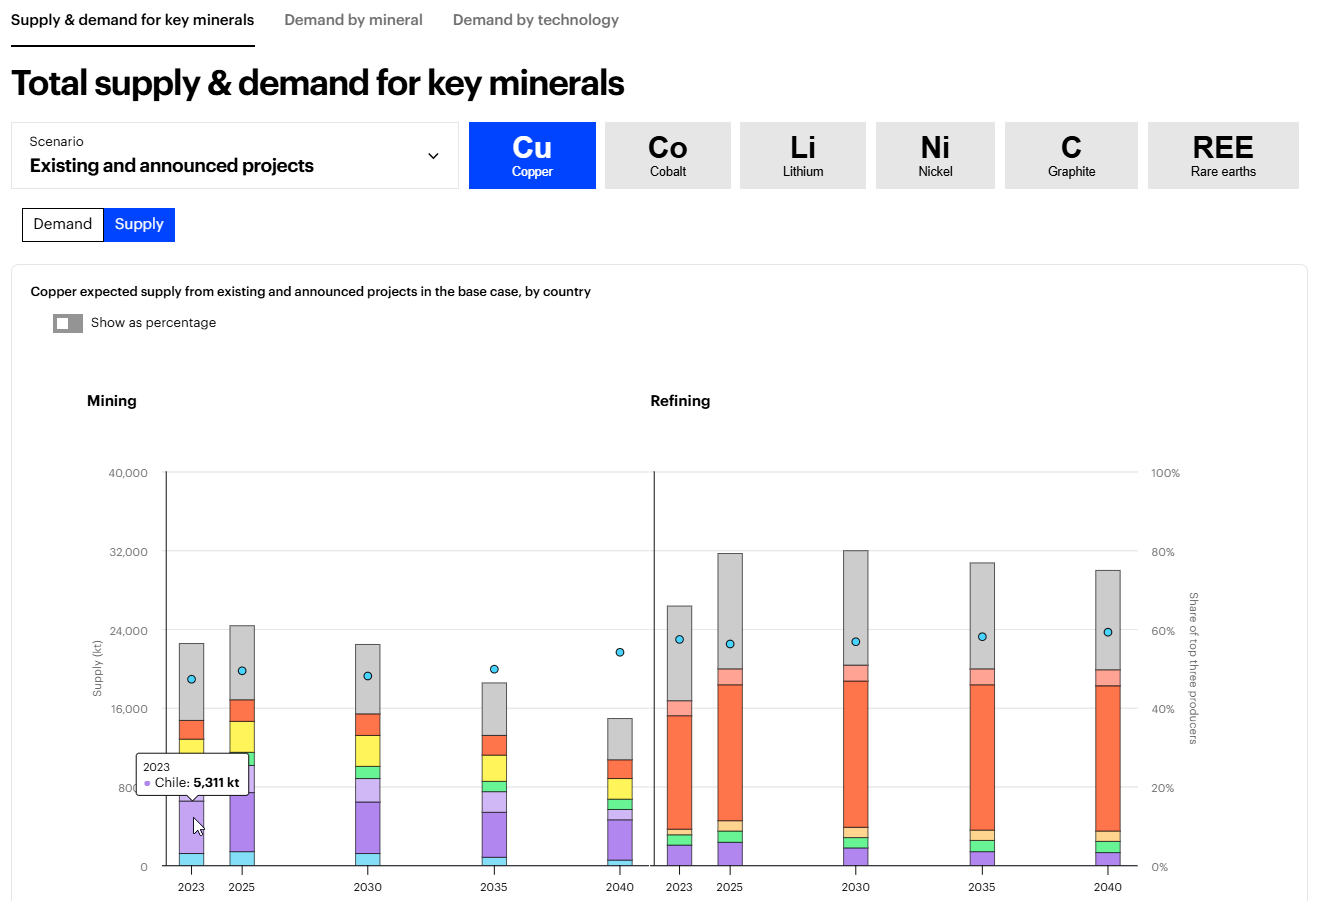
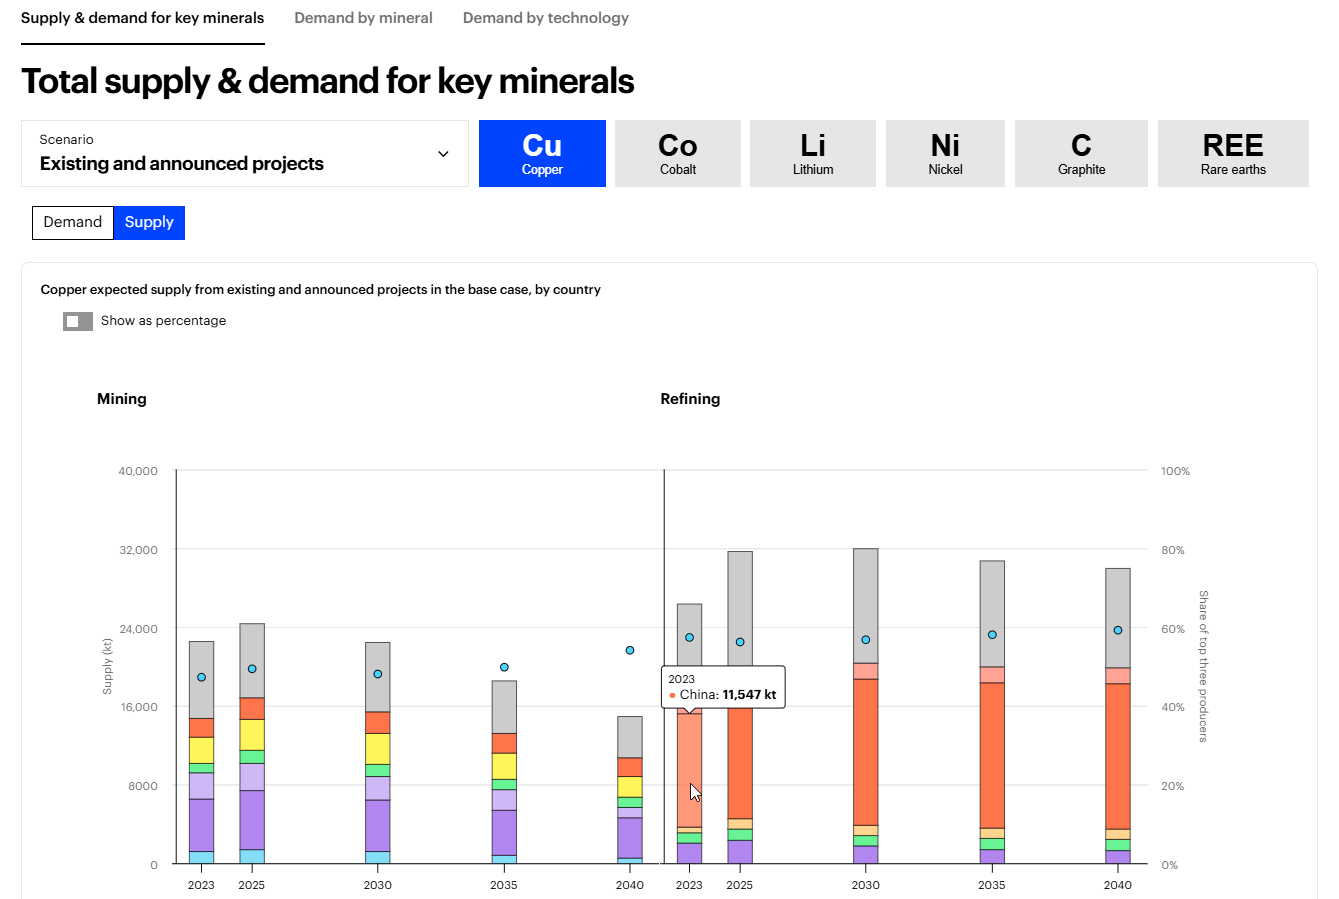
That’s a very useful tool to think about the consequence of geopolitical risks on the copper price in a world where demand will exceed supply to ensure the security of the clean energy transition.