The rate of exchange between two countries is primarily determined by the quotient between the internal purchasing power against goods of the money of each country. The general inflation which has taken place during the war has lowered this purchasing power in all countries, though in a very different degree, and the rates of exchanges should accordingly be expected to deviate from their old parity in proportion to the inflation of each country. At every moment the real parity between two countries is represented by this quotient between the purchasing power of the money in the one country and the other. I propose to call this parity “the purchasing power parity.”
Gustav Cassel (1918).
In this pedagogical post, I will explain how to use the interactive currency comparison tool made by The Economist. The Big Mac Index is a very useful tool to make exchange rate economics more digestible.
A simple example
The main idea behind this index is the following proposed by Gustav Cassel during World War I: the exchange rate between two countries (A and B) moves in order to preserve the purchasing power of a currency; in a first country (A) where price inflation is higher than in the second one (B), the exchange rate will depreciate in order to preserve the purchasing power of the second country (B).
Indeed, in absence of exchange rate movements, the international purchasing power of the second country (B) will be reduced. Why? Assume that we start with the simplest situation, a unique good with the same price is consumed in both countries (A and B), the exchange rate between A and B is equal to unity (1 currency unit of country A = 1 currency unit of country B), and there is no trade restriction.
Let the price level of this unique good be equal to 100. According to Cassel and its purchasing power parity theory, the exchange rate of currency B per unit of currency A is derived as follows:
\begin{aligned}
P_{A}&=100\\
P_{B}&=100\\
E_{B/A}^{ppp}&=\frac{P_{B}}{P_{A}}\\
E_{B/A}^{ppp}&=1
\end{aligned}
The international purchasing power of currency B is equal to the amount of this unique good that residents of country B can consume when they move to country A. Thus, it is equivalent to the value of this unique good in country B converted in the currency of country A. The international purchasing power of currency B is:
\begin{aligned}
E_{B/A}^{ppp}&=\frac{P_{B}}{P_{A}}\\
E_{B/A}^{ppp}.{P_{A}}&={P_{B}}\\
P_{A}&=\frac{P_{B}}{E_{B/A}^{ppp}}\\
\end{aligned}
Consequently, the resident of country B can consume 100 (1 good) in their country (domestic purchasing power) and 100 (1 good) in the country A (international purchasing power).
After an inflation of 25 percent in country A, the price of this unique good becomes equal to 125. If the purchasing parity theory is valid, the exchange rate will depreciate for country A to preserve the international purchasing power of country B. The exchange rate of currency B per unit of currency A will depreciate by 20 percent:
\begin{aligned}
P_{A}&=\frac{P_{B}}{E_{B/A}^{ppp}}\\
125&=\frac{100}{E_{B/A}^{ppp}}\\
E_{B/A}^{ppp}&=\frac{100}{125}\\
E_{B/A}^{ppp}&=0.8\\
\end{aligned}
Now, 1 currency unit of country A = 0.8 currency unit of country B. With this new depreciated value of this exchange rate, the domestic purchasing power of B is equal to 100 (1 good) and to 100/0.8=125 (1 good) in the country A (international purchasing power). The parity of purchasing power is preserved.
However, in absence of exchange rate movement (in red), the domestic purchasing power of B is equal to 100 (1 good) and to 100/1=100 (less than 1 good as the good price in country A is 125 after an inflation of 25 percent) in the country A (international purchasing power). The parity of purchasing power is no longer preserved as shown below:
\begin{aligned}
\color{#FF0000} E_{B/A}^{\sout{ppp}}& \color{#FF0000}=1\\
P_{A}&=\frac{P_{B}}{\color{#FF0000} E_{B/A}^{\sout{ppp}}}\\
125&\neq\frac{100}{\color{#FF0000} E_{B/A}^{\sout{ppp}}}\\
\color{#FF0000} E_{B/A}^{\sout{ppp}}&\neq\frac{100}{125}\\
\end{aligned}
Burgernomics: Raw index
In the real world, this simple example suffers from many limitations. Different consumption baskets, trade restrictions and the level of development are factors that could explain deviations from the purchasing parity power exchange rate. Nevertheless, this approach is useful to made exchange rate economics more digestible.
In the following, I will explain how to use the interactive currency comparison tool thanks to the exchange of the Chinese yuan (CNY) vis-à-vis the U.S. dollar (USD).
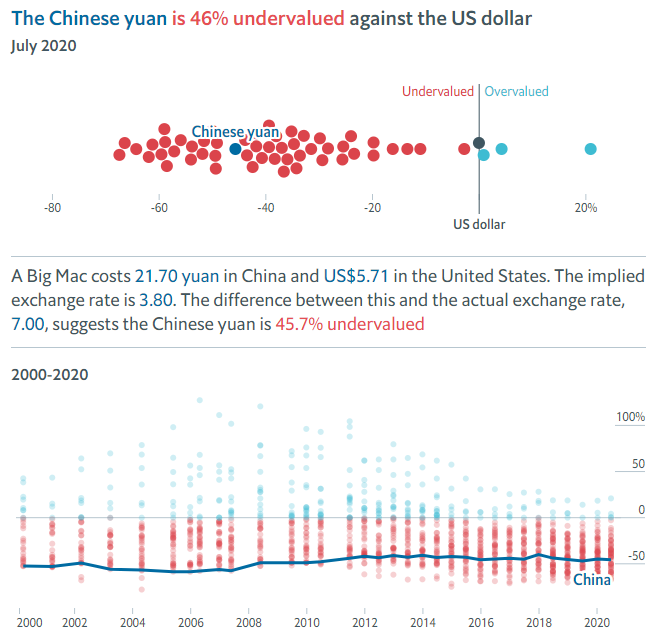
As we can see in figure 1, in July 2020, a Big Mac cost 21.70 CNY in China and 5.71 USD. The implied exchange rate (number of Chinese yuan per one U.S. dollar) can be computed as follows:
\begin{aligned}
P_{CNY}^{Big Mac}&=21.70 \text{ CNY}\\
P_{USD}^{Big Mac}&=5.71 \text{ USD}\\
E_{CNY/USD}^{ppp}&=\frac{P_{CNY}^{Big Mac}}{P_{USD}^{Big Mac}}\\
E_{CNY/USD}^{ppp}&=\frac{21.70}{5.71}\text{ USD}\\
E_{CNY/USD}^{ppp}&=3.80\text{ USD}\\
\end{aligned}
I obtain the value of the undervaluation or the overvaluation thanks to the following formula:
\begin{aligned}
\frac{E_{CNY/USD}^{ppp}-E_{CNY/USD}}{E_{CNY/USD}}\\
\frac{3.80-7.00}{7.00}\times100=-45.7\\
\end{aligned}
According to the raw index, the Chinese yuan is undervalued by 45.7 percent against the U.S. dollar. The Chinese yuan has to appreciate by 45.7 percent to reach its purchasing parity power exchange rate (from 1 U.S. dollar = 7 Chinese yuan to 1 U.S. dollar = 3.80 Chinese yuan, since fewer yuan are required to buy 1 dollar, the value of the yuan is higher).
Burgernomics: GDP-adjusted index
We observe that price levels are higher in countries with a higher level of development and price levels are lower in countries with a lower level of development. This well-known empirical observation is named the “Balassa-Samuelson effect.” In order to consider this structural difference, The Economist proposes an GDP-adjusted version of the raw index.
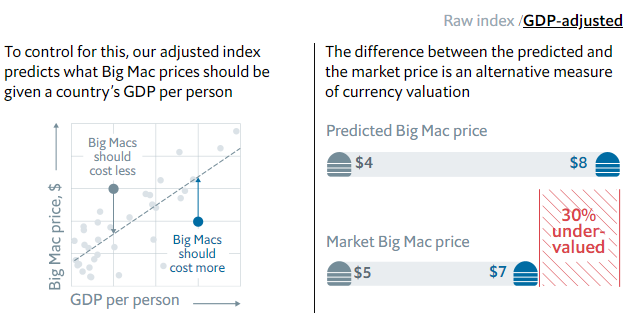
In figure 2, we can understand that this correction is based on a linear regression between the Big Mac price in U.S. dollar and the GDP per person. A positive relationship is expected according to the Balassa-Samuelson effect. Richer countries should have higher Big Mac price in U.S. dollar.
In the case of the exchange of the Chinese yuan (CNY) vis-à-vis the U.S. dollar (USD), I have the following results:
\begin{aligned}
P_{USD}^{BigMac}&=5.71\text{ USD}\\
P_{CNY}^{BigMac}&=\frac{21.70}{7}=3.10\text{ USD}\\
\end{aligned}
Thanks to linear regressions between Big Mac prices in dollars and GDP per person, I obtain these predicted values:
\begin{aligned}
P_{USD}^{\widehat{BigMac}}&=5.17\text{ USD}\\
P_{CNY}^{\widehat{BigMac}}&=3.00\text{ USD}\\
\end{aligned}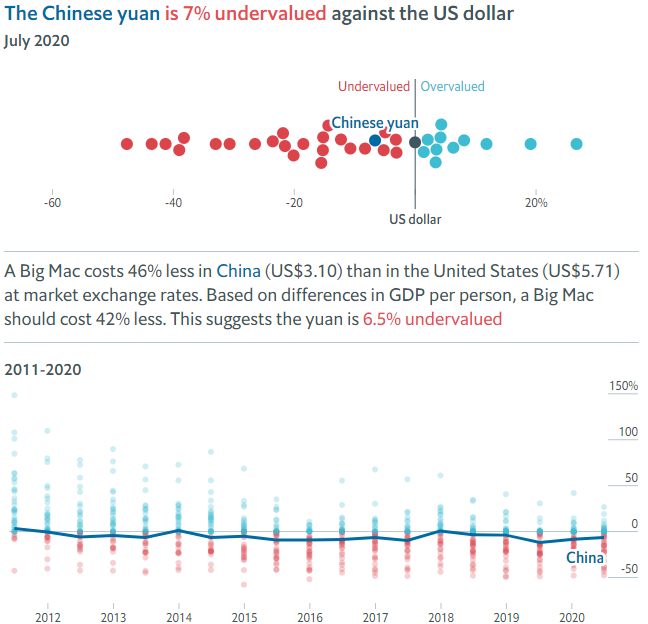
Finally, I get an overvaluation or an undervaluation for the GDP-adjusted index thanks to the following calculation:
\begin{gathered}
\Big( \frac{P_{CNY}^{BigMac}}{P_{CNY}^{\widehat{BigMac}}}\Big)\div\Big(\frac{P_{USD}^{BigMac}}{P_{USD}^{\widehat{BigMac}}}\Big)\\
\Big( \frac{3.10}{3}\Big)\div\Big(\frac{5.71}{5.17}\Big)=0.935
\end{gathered}
When the result of the above formula is equal to one, the currency is neither over- nor under-valued, below one, the currency is under-valued, and above 1, the currency is overvalued. I subtract one to get the final result:
\begin{gathered}
\Big( \frac{3.10}{3}\Big)\div\Big(\frac{5.71}{5.17}\Big)-1\\
0.935-1=-6.5\%
\end{gathered}
According to the GDP-adjusted index, the Chinese yuan is undervalued by 6.5% percent against the U.S. dollar. When I consider differences in the level of development, the undervaluation is largely reduced.
\begin{aligned}
\frac{E_{CNY/USD}^{ppp}-E_{CNY/USD}}{E_{CNY/USD}}\\
\frac{6.545-7.00}{7.00}\times100=-6.5\\
\end{aligned}
The Chinese yuan has to appreciate by 6.5 percent to reach its purchasing parity power exchange rate (from 1 U.S. dollar = 7 Chinese yuan to 1 U.S. dollar = 6.545 Chinese yuan, since fewer yuan are required to buy 1 dollar, the value of the yuan is higher).
3 Comments
[…] Maps with Stata Burgernomics: clearly explained! Unbiased estimator for population variance: clearly […]
[…] Burgernomics: clearly explained! July 18, 2020 […]
[…] Burgernomics: clearly explained! July 18, 2020 […]