When I wanted to make local projections with quantile regressions, no simple solution was available until Alfonso Ugarte released the newest version of his Stata package locproj. The documentation for his Stata package is available on my website. I will use the data from a previous blog:
The data comes from the following paper, so please quote it if you are inspired by the content:
Mignon, V., & Saadaoui, J. (2025). Asymmetries in the oil market: accounting for the growing role of China through quantile regressions. Macroeconomic Dynamics, 29, e38, 10.1017.
The following code snippet allows you to reproduce the local projections impulse response functions for different quantiles and 95 percent confidence intervals:
**#************ Local projections

*ssc install locproj, replace

summ lwti lpri

locproj lwti lpri, yl(3) sl(2) h(-4/48) save irfn(Mean) ///
 r noisily stats

locproj lwti lpri, yl(3) sl(2) h(-4/48) m(qreg) q(20) nograph ///
 save irfn(Q20) vce(r)
locproj lwti lpri, yl(3) sl(2) h(-4/48) m(qreg) q(50) ///
 save irfn(Q50) vce(r)
locproj lwti lpri, yl(3) sl(2) h(-4/48) m(qreg) q(80) nograph ///
 save irfn(Q80) vce(r)

lpgraph Mean Q20 Q50, h(-4/48) tti(Months) ///
 lab1(OLS) lab2(Low - Q20) ///
 lab3(Median) lab4(High - Q80) ///
 lc1(red) lc2(green) lc3(blue) lc4(brown) ///
 title(Oil Price Reaction to US-China Political Tensions, ///
 size(6)) ///
 zero grname(A) grsave(A) as(png)

lpgraph Mean Q50 Q80, h(-4/48) tti(Months) ///
 lab1(OLS) lab2(Median) ///
 lab3(High - Q80) lc1(red) lc2(green) lc3(blue) ///
 title(Oil Price Reaction to US-China Political Tensions, ///
 size(6)) ///
 zero grname(B) grsave(B) as(png)

lpgraph Mean Q20 Q50 Q80, h(-4/48) tti(Months) ///
 separate nolegend ///
 tti(Months) ti1(OLS) ti2(Low - Q20) ///
 ti3(Median) ti4(High - Q80) ///
 title(Oil Price Reaction to US-China Political Tensions, ///
 size(6)) ///
 lcolor(green) z grname(C) grsave(C) as(png)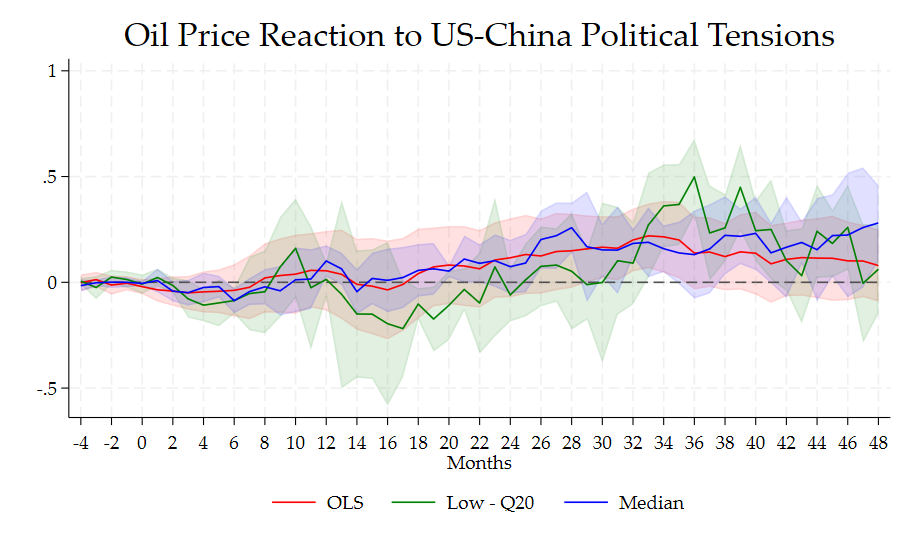
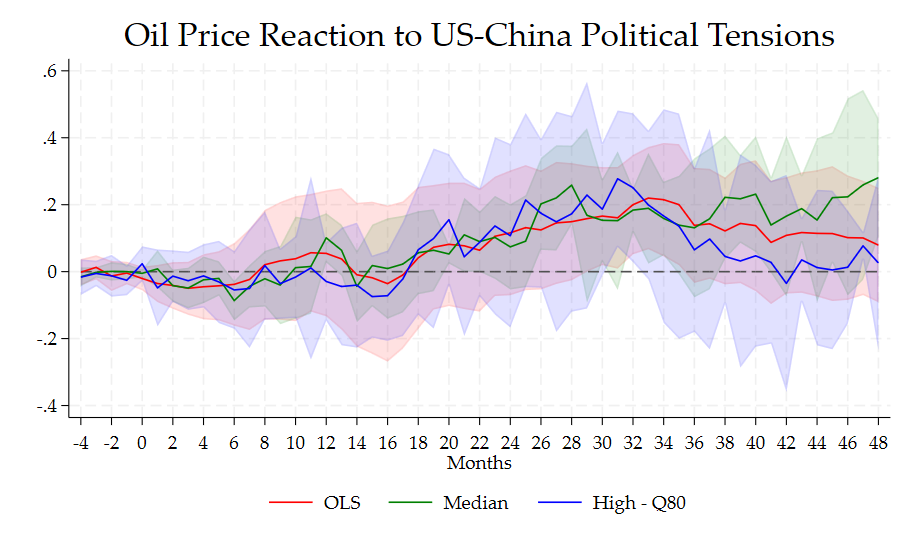
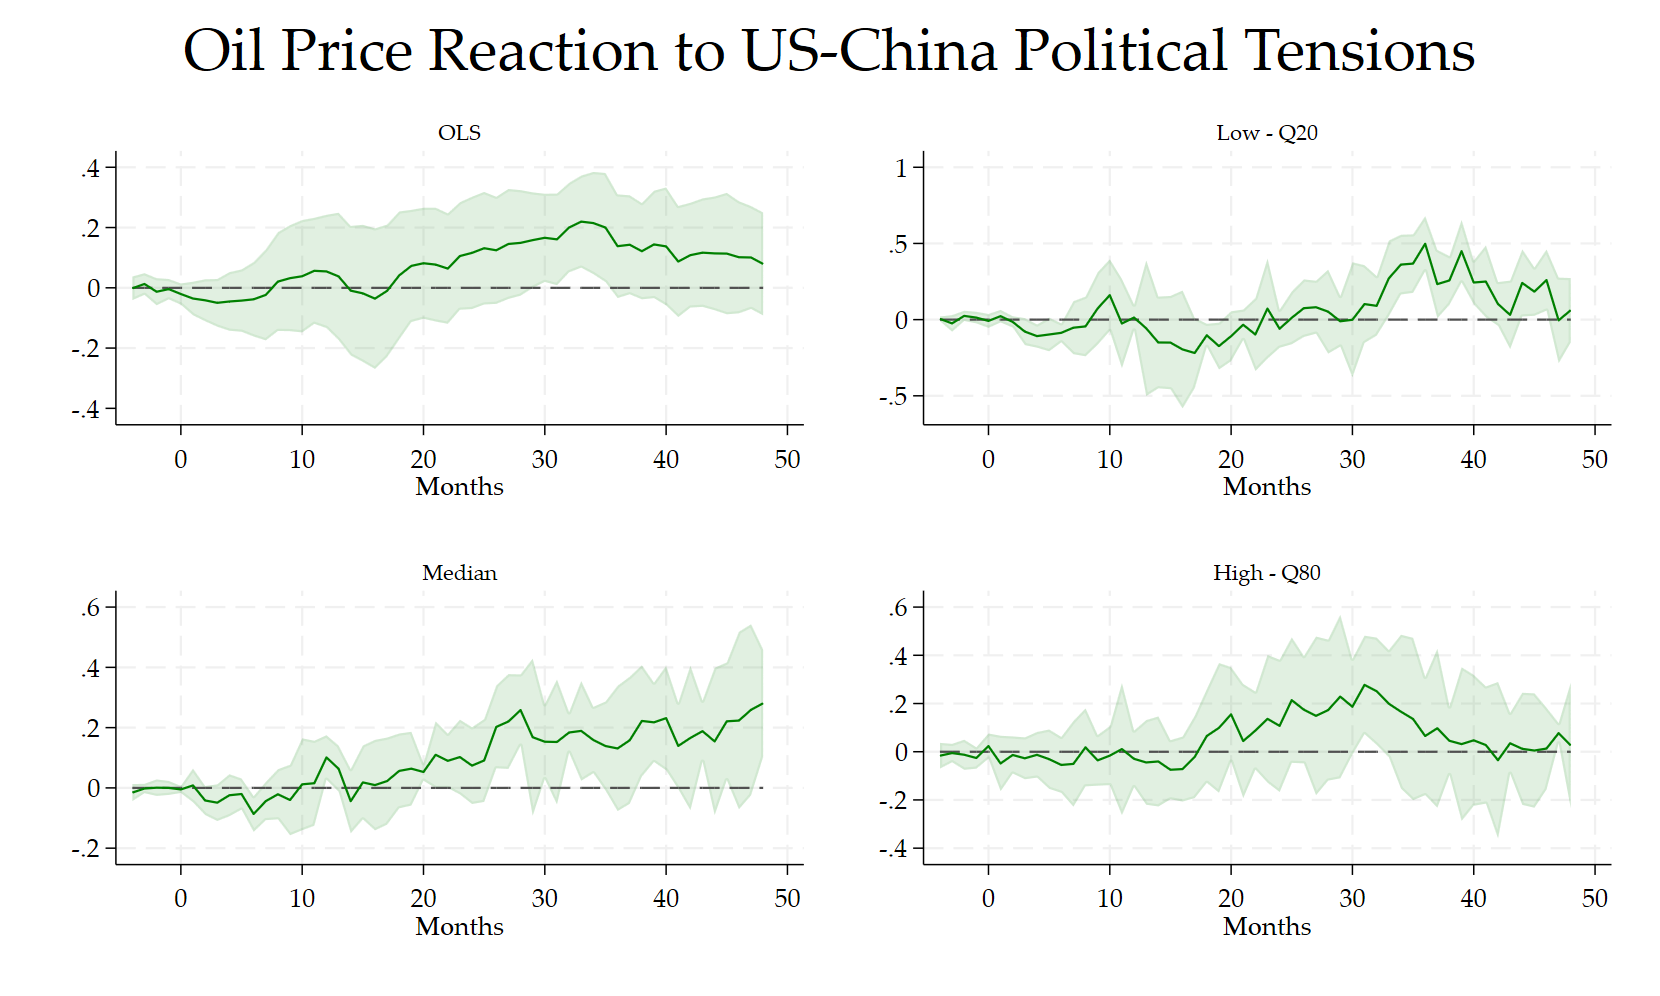
WTI prices react positively in the medium run to an improvement in US-China relations, more importantly for the quantiles below the 80th quantile.