After a first blog on the Global Macro Database, let me update the code to download the whole database:
The file for replicating this blog is available on my own GitHub:
**# First tests of the Global Macroeconomic Database by
*Müller, Xu, Lehbib, and Chen (2025)

*April 2025

**# Start of Program

cd C:\Users\jamel\Dropbox\stata\gmd

capture log close _all
log using GDM_Mar25.log, name(GDM_Mar25) text replace

clear

*adoupdate

ssc install gmd

global CS1 "nGDP rGDP rGDP_pc rGDP_USD deflator cons rcons cons_GDP inv inv_GDP finv finv_GDP exports exports_GDP imports imports_GDP CA CA_GDP USDfx REER govexp govexp_GDP govrev govrev_GDP govtax govtax_GDP govdef govdef_GDP govdebt govdebt_GDP HPI CPI infl pop unemp strate ltrate cbrate M0 M1 M2 M3 M4 SovDebtCrisis CurrencyCrisis BankingCrisis"

gmd $CS1, country() version(2025_03)

des

encode ISO3, generate(cn)

xtset cn year

tsfill, full

order cn, first

decode cn, generate(iso3c)

order cn iso3c, first

kountry iso3c, from(iso3c)

rename NAMES_STD country

order cn iso3c country, first

drop countryname ISO3

xtdescribe

summ $CS1

tabstat $CS1, stat(count)

tabstat $CS1, stat(count) by(cn) save
qui return list

putexcel set "tabstat", replace sheet(Stats)

putexcel set "tabstat", modify sheet(Stats)
forvalues v=1(1)243 {
          qui putexcel (A`v') = (r(name`v'))
		  qui putexcel (B`v') = matrix(r(Stat`v'))
		}

*https://www.statalist.org/forums/forum/general-stata-discussion/general/1473382-exporting-variable-label-with-putexcel

putexcel set filename, replace
local row = 1
foreach x of varlist $CS1 {
describe `x'
local varlabel : var label `x'
qui putexcel A`row' = ("`varlabel'")
local row = `row'+1
}

gen LREER=log(REER)
gen LrGDP_pc=log(rGDP_pc)

areg CA_GDP L5.LREER L5.LrGDP_pc, absorb(cn year) rob

kountry iso3c, from(iso3c) to(imfn)

rename _IMFN_ imfcode
rename cn cn_
rename imfcode cn

qui group_dummy

areg CA_GDP L5.LREER L5.LrGDP_pc if ssa==1, ///
 absorb(cn year) rob

tabstat $CS1 if ssa==1, stat(count) by(cn_) save

save GDM_Mar25.dta, replace

putexcel set "tabstat_ssa", modify sheet(Stats)
forvalues v=1(1)243 {
          qui putexcel (A`v') = (r(name`v'))
		  qui putexcel (B`v') = matrix(r(Stat`v'))
		}

log close _all
exit

**# End of Program
The descriptive statistics are the following:
    Variable |        Obs        Mean    Std. dev.       Min        Max
-------------+---------------------------------------------------------
        nGDP |     19,553    1.97e+08    8.16e+09   1.08e-13   7.17e+11
        rGDP |     22,712    4.24e+07    4.64e+08   5.42e-08   1.66e+10
     rGDP_pc |     22,224    1.72e+07    1.11e+08   4.51e-08   1.77e+09
    rGDP_USD |     16,173    205182.8     1039259    .077203   2.42e+07
    deflator |     19,004    3.41e+09    3.78e+11   7.06e-16   5.10e+13
-------------+---------------------------------------------------------
        cons |     12,820    5.27e+07    1.15e+09   1.96e-10   9.04e+10
       rcons |     14,237    4.95e+07    4.78e+08   1.64e-06   1.03e+10
    cons_GDP |     12,733    82.44329    22.43109   8.835807   298.3758
         inv |     15,328    8.76e+07    3.27e+09   -6848830   2.51e+11
     inv_GDP |     15,252    22.91494    11.27086  -21.54602   243.1756
-------------+---------------------------------------------------------
        finv |     14,067    2.05e+07    4.75e+08     -20231   3.84e+10
    finv_GDP |     13,987    21.87318    10.32057  -4.968716   157.8736
     exports |     25,156    2.70e+07    7.77e+08   1.34e-14   4.65e+10
 exports_GDP |     16,595    37.01969    56.87245   1.75e-11    1168.42
     imports |     24,476    2.49e+07    6.54e+08   9.65e-15   4.00e+10
-------------+---------------------------------------------------------
 imports_GDP |     16,277    39.99109    32.58367   2.03e-11   624.5701
          CA |     12,975     6805663    3.01e+08  -7.62e+08   2.15e+10
      CA_GDP |     12,975   -2.693354    13.05521   -240.495   311.7461
       USDfx |     23,235    190.6948    1478.997   3.49e-16      42000
        REER |     11,585    242.1952     3539.28   .3823057   279940.5
-------------+---------------------------------------------------------
      govexp |     19,276    1.23e+07    2.28e+08   5.76e-15   1.45e+10
  govexp_GDP |     14,897    24.10222    34.06604   1.23e-06   3341.202
      govrev |     20,295    1.03e+07    1.85e+08   2.82e-22   1.15e+10
  govrev_GDP |     14,728    42.52399    616.3299   2.47e-11   23977.27
      govtax |     14,140     3666900    5.34e+07   6.48e-14   2.15e+09
-------------+---------------------------------------------------------
  govtax_GDP |      9,466    15.16603    13.33653   .0000628   910.5263
      govdef |     13,661    -7468088    2.58e+08  -1.67e+10   2.37e+08
  govdef_GDP |     13,756   -208.0327    6274.573  -309875.5   2451.805
     govdebt |     13,965    1.03e+08    3.42e+09          0   2.55e+11
 govdebt_GDP |     14,649    52.57505    51.19932          0    2092.92
-------------+---------------------------------------------------------
         HPI |      3,536    57.02474    94.70208   2.56e-12   3093.807
         CPI |     18,722    3.03e+09    2.45e+11   1.73e-15   2.75e+13
        infl |     19,878     5602113    7.51e+08  -99.97137   1.06e+11
         pop |     51,938    13.39953    67.90833   3.75e-06   1534.732
       unemp |      7,659     7.43133     5.98458   .0013352         70
-------------+---------------------------------------------------------
      strate |      7,383    9.705481    83.74302  -.8191667   6404.965
      ltrate |      7,747    7.201801    5.928785  -.5238333      209.6
      cbrate |      8,759    23.08225    1109.123       -.75   103484.2
          M0 |     14,453    6.41e+12    7.70e+14   1.43e-17   9.26e+16
          M1 |     11,024    1.11e+07    1.38e+08   5.92e-18   4.83e+09
-------------+---------------------------------------------------------
          M2 |     10,504    4.78e+12    4.90e+14   5.27e-18   5.02e+16
          M3 |      3,221    4.94e+07    4.05e+08   3.94e-12   7.94e+09
          M4 |        288      635671     1975027       .022   1.49e+07
SovDebtCri~s |     19,069    .0145786    .1198618          0          1
CurrencyCr~s |     19,596    .0279139    .1647303          0          1
-------------+---------------------------------------------------------
BankingCri~s |     19,933    .0181608    .1335362          0          1
You can also have the coverage per country in this Excel file:
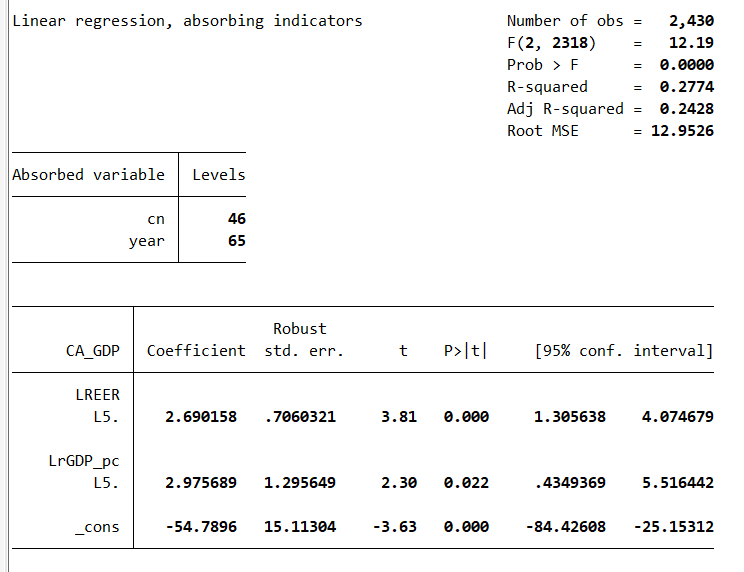
I made a small regression for the current account reaction to the exchange rate and to the GDP per capita:
gen LREER=log(REER)
gen LrGDP_pc=log(rGDP_pc)

areg CA_GDP L5.LREER L5.LrGDP_pc, absorb(cn year) rob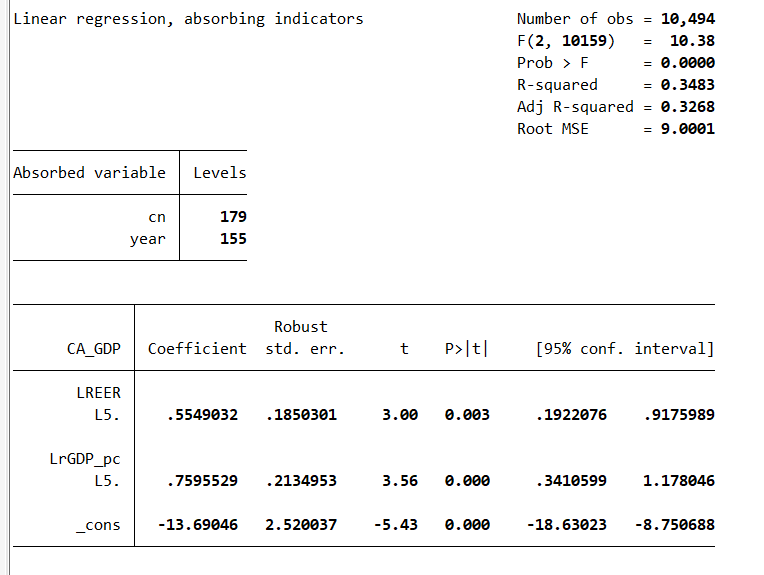
And, for sub-Saharan African countries: