Asjad Naqvi released a new version of the bimap package, let me show a small example of how this package works with some regional data for China. I install the packages and prepare the data:
**# Install packages

/*
net install bimap, ///
from("https://raw.githubusercontent.com/asjadnaqvi/stata-bimap/main/installation/") replace

ssc install spmap, replace
ssc install palettes, replace
ssc install colrspace, replace

ssc install schemepack, replace
set scheme white_tableau
*/

**# Prepare the data

graph set window fontface "Arial Narrow"

generate g2_gdppc_const05_new100=g2_gdppc_const05_new*100
In the following, I make a loop for panel data:
**# Draw the maps
/*
bimap cpi_new g2_gdppc_const05_new100 using ///
ne_10m_admin_1_states_provinces_shp, cut(pctile) ///
palette(census) count values
*/
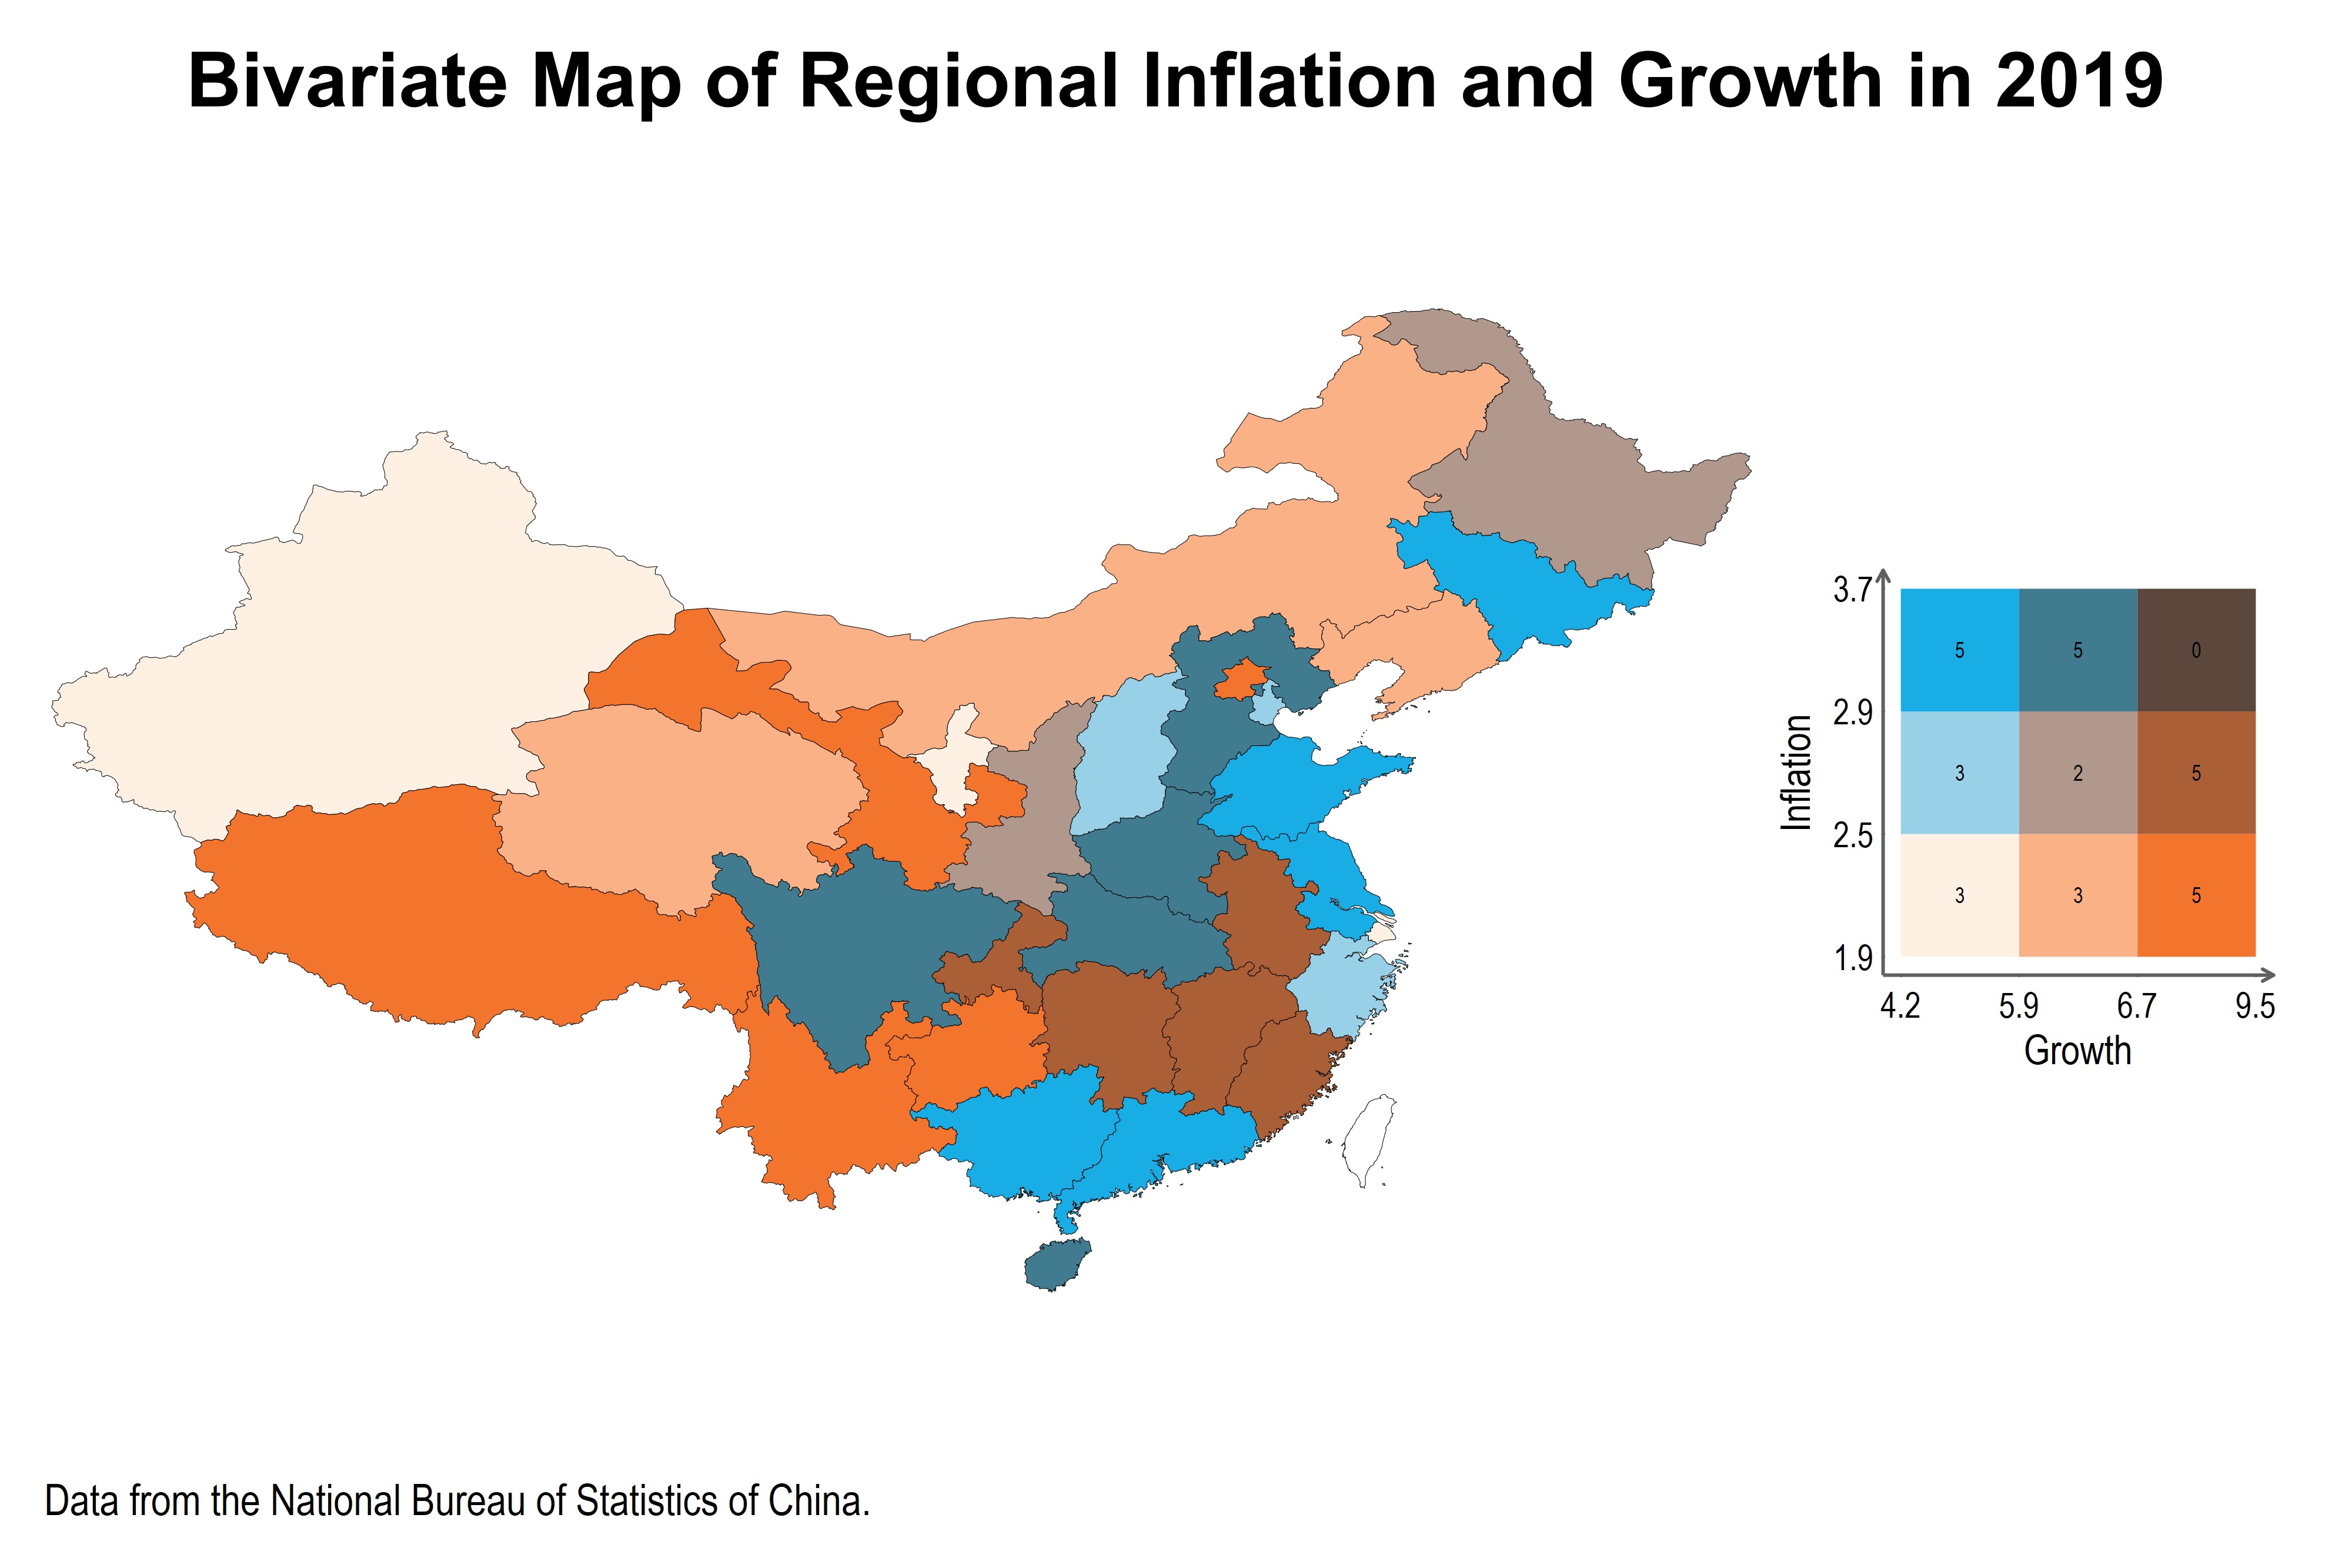
forvalues i = 2000(1)2019 {
preserve
keep if year==`i'
bimap cpi_new g2_gdppc_const05_new100 using ///
ne_10m_admin_1_states_provinces_shp, cut(pctile) ///
palette(orangeblue0) ///
title("{fontface Arial Bold:Bivariate Map of Regional Inflation and Growth in `i'}") ///
note("Data from the National Bureau of Statistics of China.") ///
textx("Growth") texty("Inflation") texts(3.5) textlabs(3) values count ///
ocolor(black) osize(0.05) ///
polygon(data("ne_10m_admin_0_countries_shp") ///
select(keep if _ID==189) ocolor(black) osize(0.05))
graph rename Graph bimap`i', replace
restore
}The result:
More details on how to draw maps for Chinese regions:
2 Comments
[…] Bivariate Maps for Chinese Regional Data […]
[…] Bivariate Maps for Chinese Regional Data […]