A new database is available that compiles 46 variables for 243 countries from 110 sources. Overall, that’s a very nice public good. A ton of thanks to the authors. Their website is available and their GitHub too. The database is available by using the following Stata script, if you want to download all the series. The file for replicating this blog is available on my own GitHub:
**# First tests of the Global Macroeconomic Database by
*Müller, Xu, Lehbib, and Chen (2025)

**# Start of Program

cd C:\Users\jamel\Dropbox\stata\gmd

capture log close _all
log using GDM_Jan25.log, name(GDM_Jan25) text replace

clear

net install GMD, from(http://www.globalmacrodata.com/package)

global CS1 "nGDP rGDP rGDP_pc inv inv_GDP finv finv_GDP rcons cons cons_GDP imports imports_GDP exports CA CA_GDP pop govexp govexp_GDP govrev govrev_GDP govtax govtax_GDP govdef govdef_GDP govdebt govdebt_GDP CPI HPI deflator infl unemp USDfx REER strate ltrate cbrate M0 M1 M2 M3 M4 BankingCrisis CurrencyCrisis SovDebtCrisis"

GMD $CS1, country() version(2025_01)

des

encode ISO3, generate(cn)

xtset cn year

tsfill, full

order cn, first

decode cn, generate(iso3c)

order cn iso3c, first

kountry iso3c, from(iso3c)

rename NAMES_STD country

order cn iso3c country, first

drop countryname ISO3

xtdescribe

summ $CS1

tabstat $CS1, stat(count)

tabstat $CS1, stat(count) by(cn) save
return list

putexcel set "tabstat", replace sheet(Stats)

putexcel set "tabstat", modify sheet(Stats)
forvalues v=1(1)243 {
          putexcel (A`v') = (r(name`v'))
		  putexcel (B`v') = matrix(r(Stat`v'))
		}

*https://www.statalist.org/forums/forum/general-stata-discussion/general/1473382-exporting-variable-label-with-putexcel

putexcel set filename, replace
local row = 1
foreach x of varlist $CS1 {
describe `x'
local varlabel : var label `x'
putexcel A`row' = ("`varlabel'")
local row = `row'+1
}

log close _all
exit

**# End of Program for the Local Projections
The descriptive statistics are the following:
    Variable |        Obs        Mean    Std. dev.       Min        Max
-------------+---------------------------------------------------------
        nGDP |     19,477    1.98e+08    8.17e+09   1.01e-13   7.17e+11
        rGDP |     20,974    6.63e+07    7.29e+08   3.045606   1.94e+10
     rGDP_pc |     20,538    1.99e+07    1.22e+08   2.127904   1.86e+09
         inv |     15,336    9.09e+07    3.43e+09  -301546.2   2.64e+11
     inv_GDP |     15,259    23.22189    14.84143  -908.1306    255.037
-------------+---------------------------------------------------------
        finv |     14,015    2.03e+07    4.75e+08     -20231   3.84e+10
    finv_GDP |     13,953    21.90447    10.34467  -4.968716   157.8736
       rcons |     14,175    4.89e+07    4.73e+08   1.64e-06   1.03e+10
        cons |     12,760    5.23e+07    1.15e+09   1.96e-10   9.04e+10
    cons_GDP |     12,696    82.59445     22.5204   8.835807   298.3758
-------------+---------------------------------------------------------
     imports |     24,470    2.46e+07    6.50e+08   9.65e-15   4.00e+10
 imports_GDP |     15,100    42.57324    40.63606   2.03e-11   624.5701
     exports |     25,150    2.66e+07    7.72e+08   8.48e-15   4.65e+10
          CA |     12,980     6753149    3.01e+08  -7.62e+08   2.15e+10
      CA_GDP |     12,986   -2.419042    12.60792   -242.188    314.906
-------------+---------------------------------------------------------
         pop |     51,930    13.32227    67.98541   3.77e-06   1523.385
      govexp |     19,557    3.11e+07    1.18e+09   3.81e-15   1.02e+11
  govexp_GDP |     14,907    25.77256    22.46286   1.23e-06     594.77
      govrev |     20,547    2.47e+07    9.45e+08   5.45e-22   8.55e+10
  govrev_GDP |     14,667    22.77117    15.32084   .0034447    164.054
-------------+---------------------------------------------------------
      govtax |     14,138     3622758    5.33e+07   6.48e-14   2.15e+09
  govtax_GDP |      9,472    14.57864    8.539338   .0000628   152.6961
      govdef |     13,624    -7402894    2.56e+08  -1.67e+10   6.45e+07
  govdef_GDP |     13,674   -1.937165    10.52888   -557.499    125.135
     govdebt |     13,945    1.03e+08    3.42e+09          0   2.55e+11
-------------+---------------------------------------------------------
 govdebt_GDP |     14,689    52.45973    51.31307          0    2092.92
         CPI |     18,659    3.04e+09    2.45e+11   1.73e-15   2.75e+13
         HPI |      3,517    57.18159     94.8863   2.56e-12   3093.807
    deflator |     17,474     919.081       27368   2.27e-15    1676309
        infl |     19,692     5655028    7.54e+08  -99.97137   1.06e+11
-------------+---------------------------------------------------------
       unemp |      7,645    7.686186    6.259881          0         70
       USDfx |     23,109    189.5223     1478.73   3.49e-16      42000
        REER |     11,525    242.8519    3548.467          0   279940.5
      strate |      7,383    9.706535    83.74483  -.8191667   6404.965
      ltrate |      7,747    7.201801    5.928785  -.5238333      209.6
-------------+---------------------------------------------------------
      cbrate |      8,730    23.13453    1110.963       -.75   103484.2
          M0 |     14,443    6.41e+12    7.70e+14      -27.7   9.26e+16
          M1 |     10,989    1.11e+07    1.38e+08   5.92e-18   4.83e+09
          M2 |     10,509    4.78e+12    4.90e+14   5.27e-18   5.02e+16
          M3 |      3,143    5.07e+07    4.10e+08   1.90e-10   7.94e+09
-------------+---------------------------------------------------------
          M4 |        288      635671     1975027       .022   1.49e+07
BankingCri~s |     19,933    .0181608    .1335362          0          1
CurrencyCr~s |     19,596    .0279139    .1647303          0          1
SovDebtCri~s |     19,069    .0145786    .1198618          0          1
You can also have the coverage per country in this Excel file:
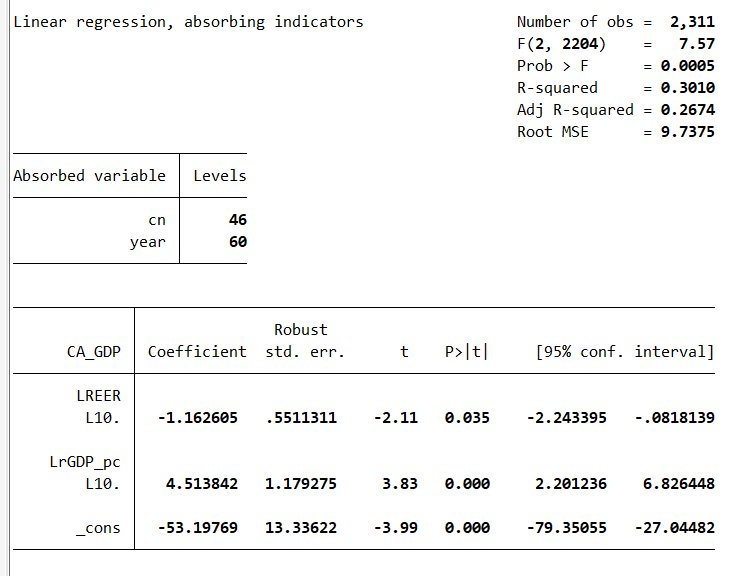
I made a small regression for the current account reaction to the exchange rate and to the GDP per capita:
gen LREER=log(REER)
gen LrGDP_pc=log(rGDP_pc)

areg CA_GDP L5.LREER L5.LrGDP_pc, absorb(cn year) rob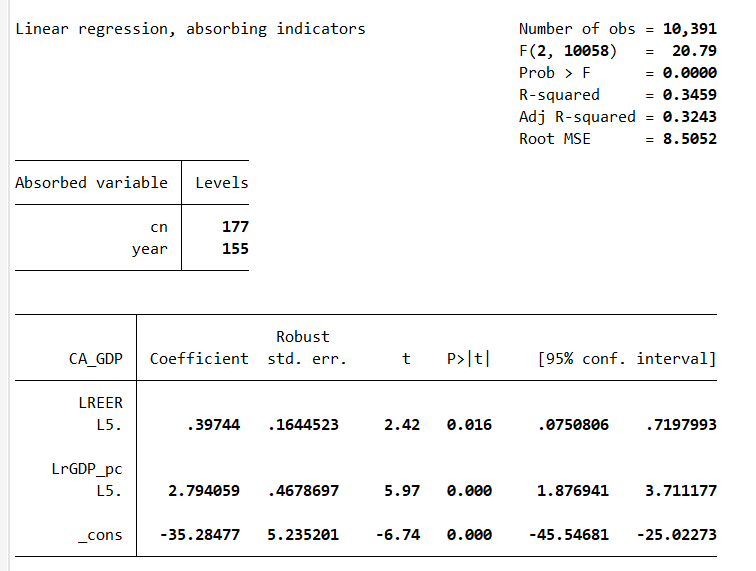
And, for sub-Saharan African countries: