After a series of blogs where I explained the functioning of the DBnomics package: www.jamelsaadaoui.com
I will show how to directly download the Vulnerability Index built by the ND-GAIN: https://gain.nd.edu/
**# Import the data

dbnomics import, provider(ND_GAIN) ///
 dataset(vulnerability) clear

rename   value VUL
destring VUL, replace force
split    series_name, parse(–)
encode   series_name2, generate(cn)
*keep     cn country period VUL
order    cn country period VUL

kountry  country, from(iso3c) to(imfn) m
list     cn country _IMFN_ MARKER ///
         if period == 2020 & MARKER == 0
drop     if MARKER == 0
drop     NAMES_STD MARKER
rename   _IMFN_ imfcode
order    cn country imfcode period
keep     cn country imfcode period VUL
drop     if imfcode==.

xtset    imfcode period
xtdes

save     VUL_ND.dta, replace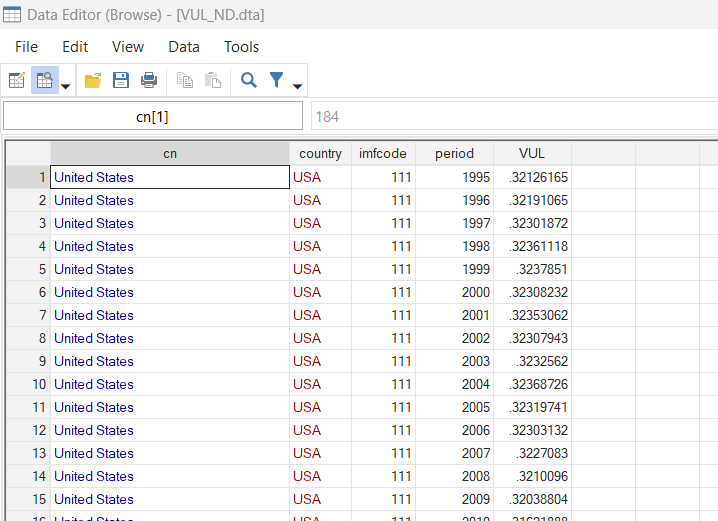
Now, I will build on the Medium blog written by Asjad Naqvi and use Ben Jann’s package heatplot for the highly vulnerable countries
**# Heat map

encode   country, generate(CN)

*** install the packages
ssc install heatplot, replace
help heatplot  // see for the documentation and examples

sum VUL, detail

format VUL %4.2f

by imfcode: egen mean_VUL = mean(VUL)

drop if mean_VUL< .5174853

summ period
  local x1 = `r(min)'
  local x2 = `r(max)'
heatplot VUL i.cn period if mean_VUL> .5174853 , ///
 yscale(noline) ///
 ylabel(, nogrid labsize(*0.5)) ///
 xlabel(`x1'(5)`x2', labsize(*0.75) angle(vertical) nogrid) ///
 color(inferno, reverse) ///
 levels(8) ///
  ramp(right  space(14)  format(%4.2f)) ///
  p(lcolor(black%10) lwidth(*0.1)) ///
  ytitle("") ///
  xtitle("", size(vsmall)) ///
  xdiscrete name(vulQ3, replace) ///
 title("Vulnerability Index (above Q3)") ///
  note("Data source: Notre Dame Global Adaptation Initiative.", ///
size(vsmall)) 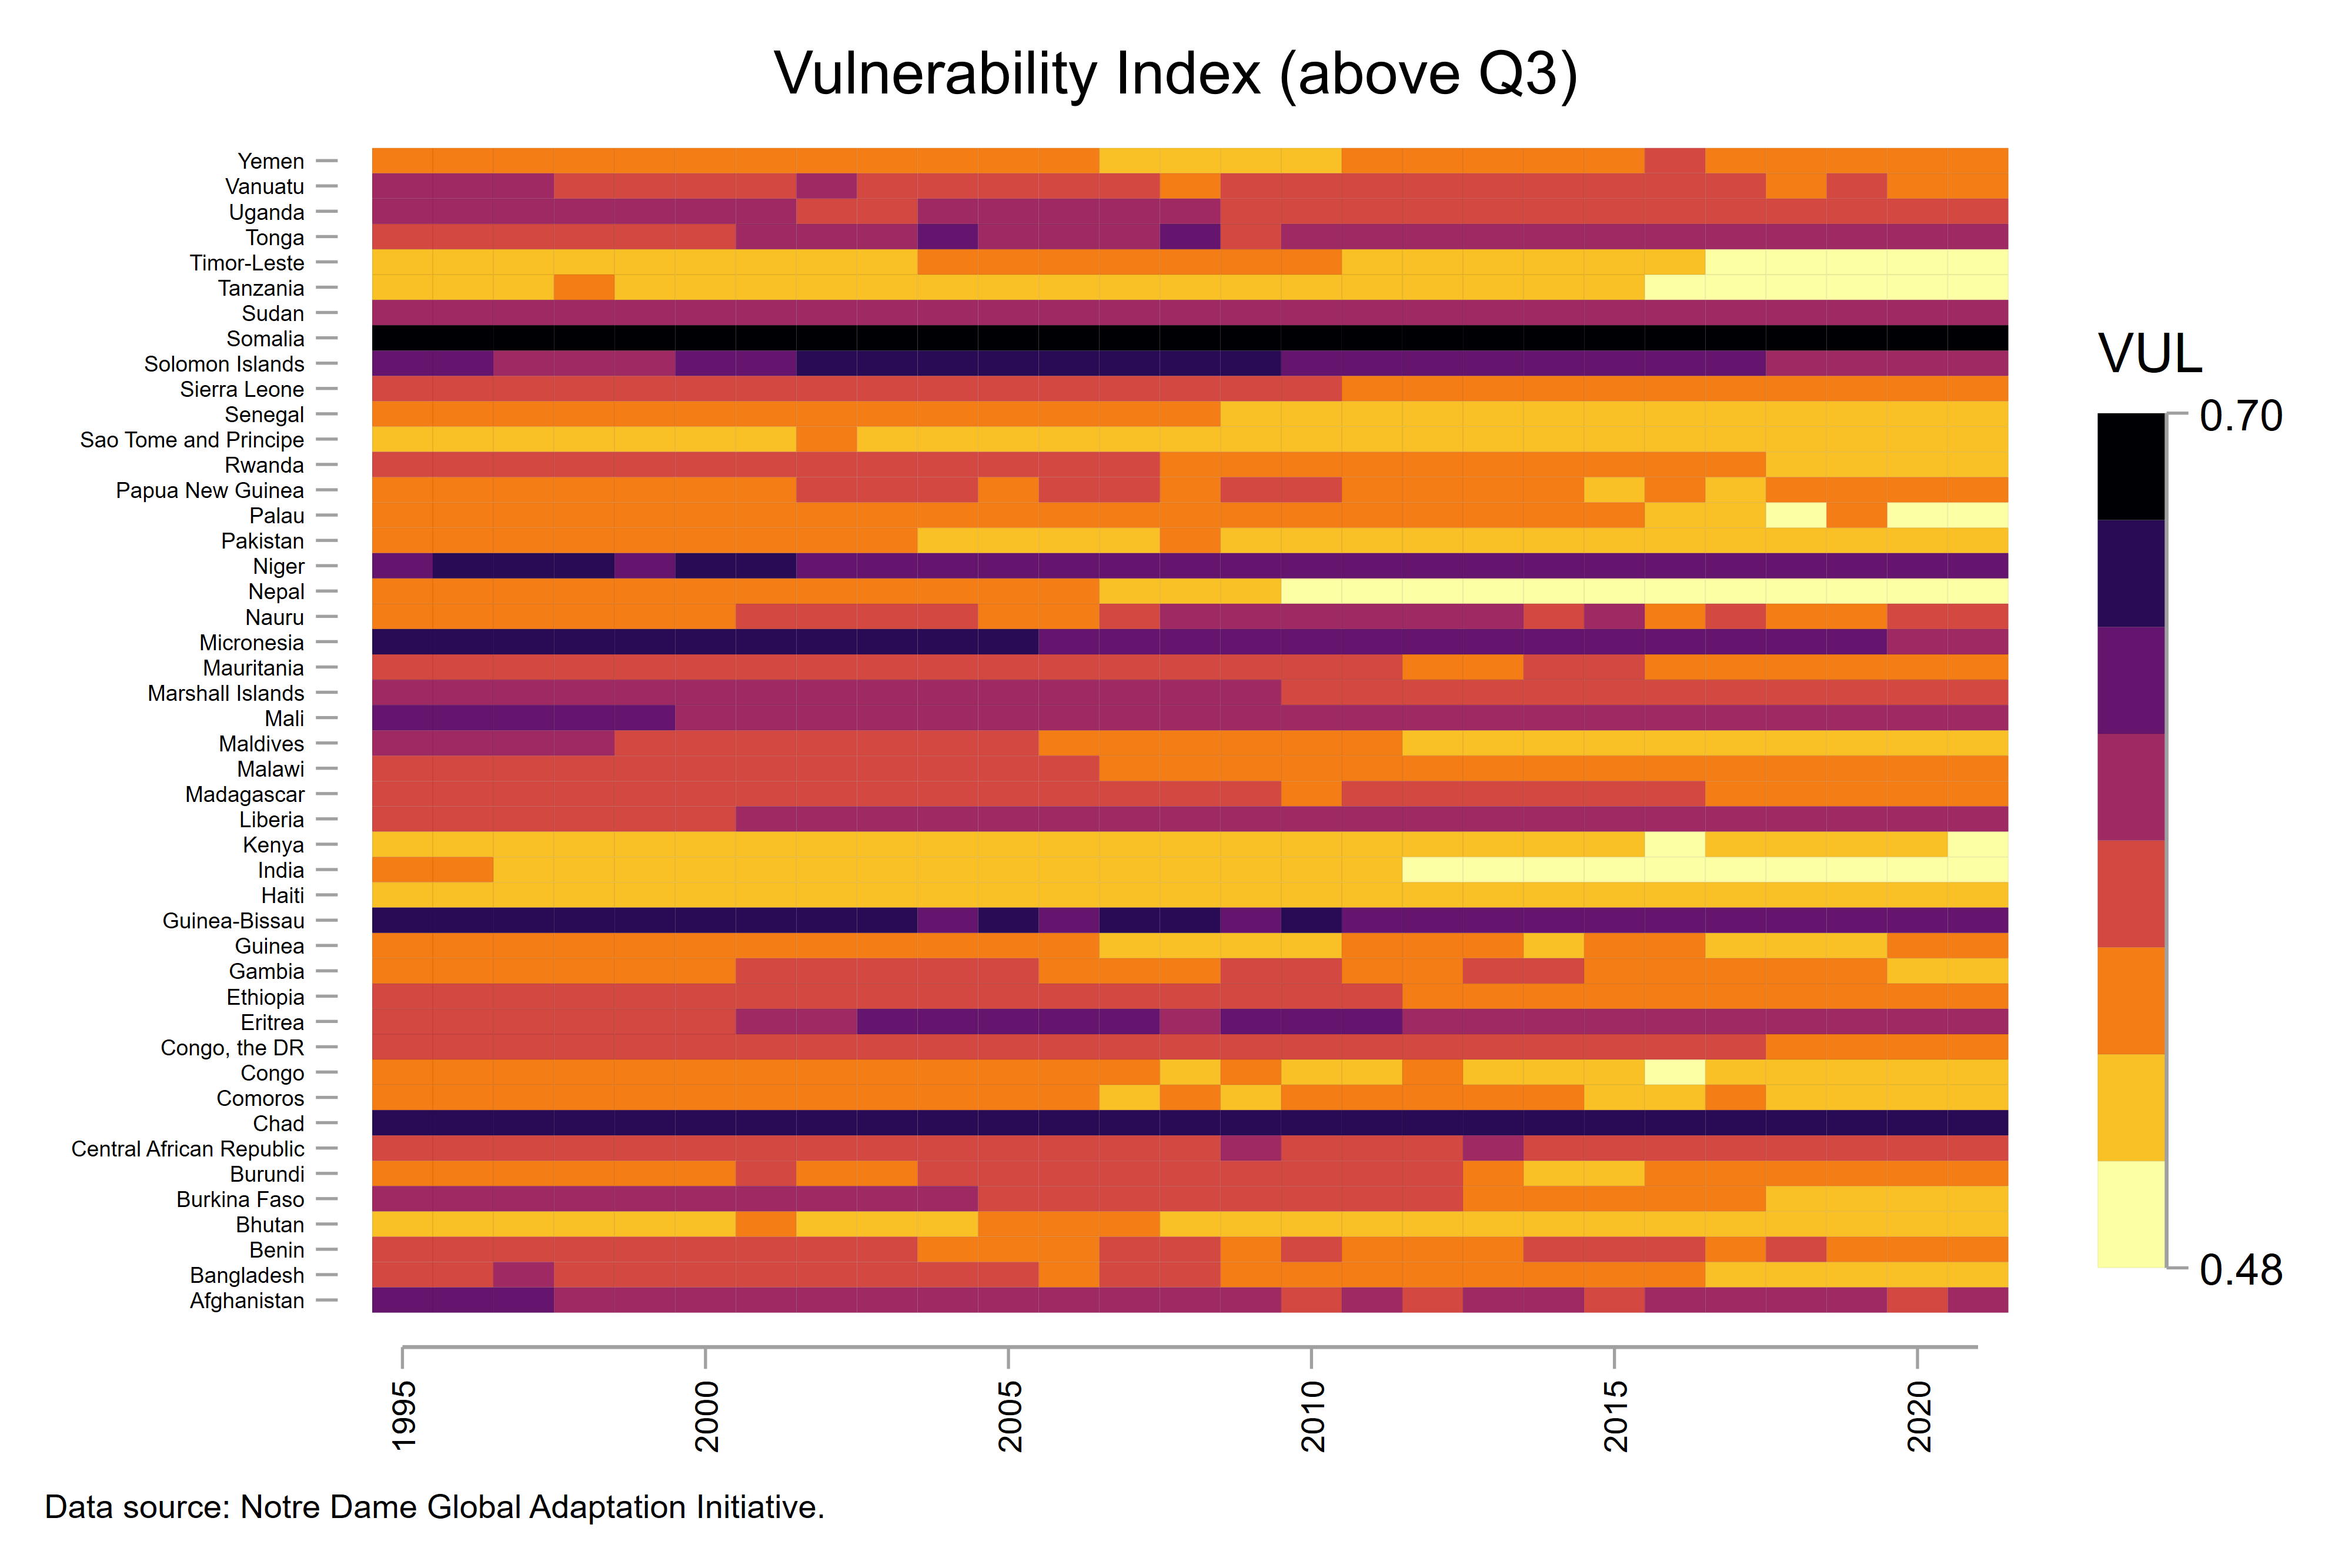
4 Comments
[…] Today, I will focus on the economic risk rating component. In particular, I will take a closer look at the inflation risk variable. In their methodology note, they mention that inflation risk is computed as a score for the estimated annual inflation rate (the unweighted average of the Consumer Price Index) calculated as a percentage change. If annual inflation is below 2 percent, the score is 10 (best); between 19.0 and 21.9 percent, the score is 5; and if the annual inflation rate is above 130 percent, the score is 0 (the worst). See below the heat maps for the inflation risk below the first quartile (the code is available at the end of this blog, see this post). […]
[…] Feeling the Heat: Heatmaps for Vulnerability Scores Explaining the Infrastructure Vulnerability Score for the Russia Federation […]
[…] Feeling the Heat: Heatmaps for Vulnerability Scores […]
[…] Feeling the Heat: Heatmaps for Vulnerability Scores […]