A good way to visualize panel data with Stata is to rely on the package panelview created and maintained by Yiqing Xu:
Other possibilities include Ben Jann’s heatplot:
Today, I will use data from the following paper to show how to use panelview:
Hugo Oriola, Jamel Saadaoui (31 May 2024), How do geopolitical interests affect financial markets reaction to international institution projects? SSRN Working Paper: https://dx.doi.org/10.2139/ssrn.4849861.
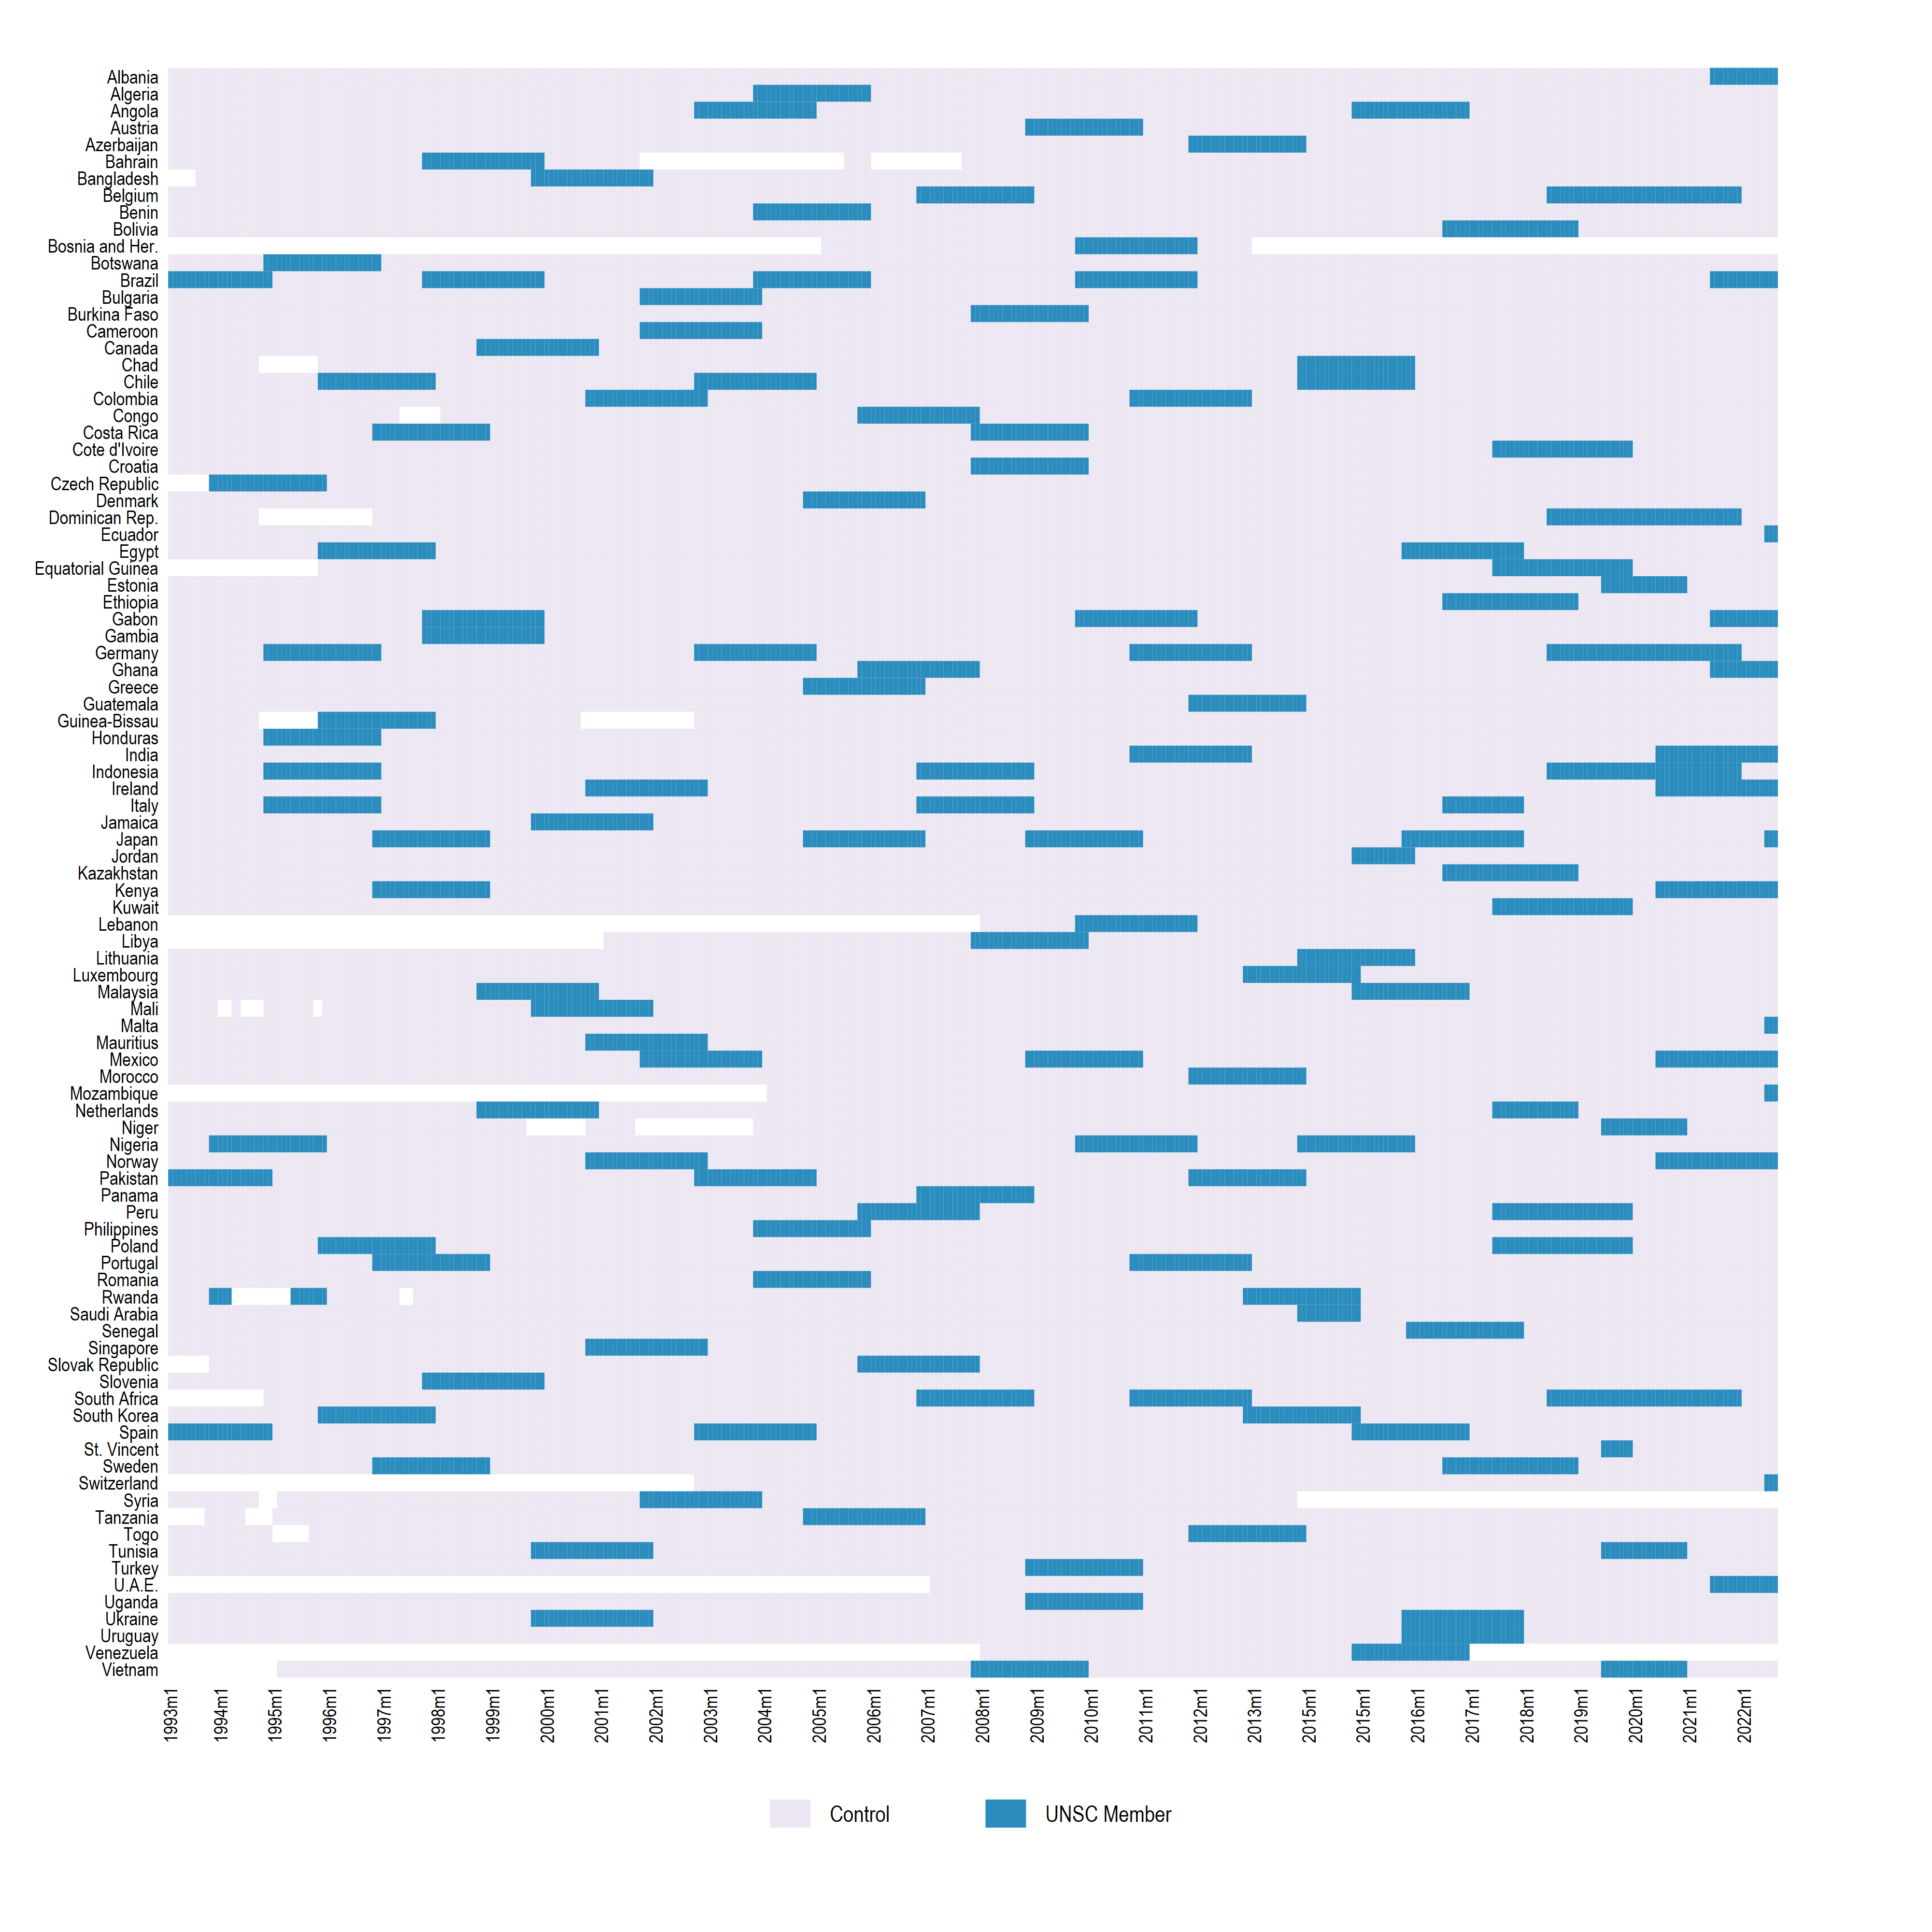
I will replicate Figure 4 in the paper:
// Select the countries that have been in the UNSC temporay council

egen dumUNSC = max(UNSC == 1), by(Country)

// rename some countries

replace Country = "Bosnia and Her." if Country == "Bosnia and Herzegovina"
replace Country = "Dominican Rep." if Country == "Dominican Republic"
replace Country = "St. Vincent" if Country == "Saint Vincent and the Grenadines"
replace Country = "U.A.E." if Country == "United Arab Emirates"

// Run everything between preserve and restore

*****************************************************************
	preserve

keep if dumUNSC == 1

// use panelview and customize the time axis

panelview UNSC, i(Country) t(Period) type(treat) xlabel(1 "1993m1" 12 "1994m1" 24 "1995m1" 36 "1996m1" 48 "1997m1" 60 "1998m1" 72 "1999m1" 84 "2000m1" 96 "2001m1" 108 "2002m1" 120 "2003m1" 132 "2004m1" 144 "2005m1" 156 "2006m1" 168 "2007m1" 180 "2008m1" 192 "2009m1" 204 "2010m1" 216 "2011m1" 228 "2012m1" 240 "2013m1" 252 "2015m1" 264 "2015m1" 276 "2016m1" 288 "2017m1" 300 "2018m1" 312 "2019m1" 324 "2020m1" 336 "2021m1" 348 "2022m1") ytitle("") xtitle("") legend(label(1 "Control") label(2 "UNSC Member") position(6)) displayall leavegap type(missing) scale(0.7)
mycolor(PuBu)

	restore

*****************************************************************

drop dumUNSC

// Export the graph

graph rename Graph panelview

graph export panelview.png, as(png) replace width(4000)