After two blogs on how to start with GDELT data, I will show how to construct a histogram of bilateral Goldstein score for bilateral events between the US and China since the 1980:
After few attempts with ChatGPT 4o, I produced a code to download the data in Google BigQuery:
-- Définir les paramètres de début et de fin depuis 1980
DECLARE start_date DATE DEFAULT DATE '1980-01-01';
DECLARE end_date DATE DEFAULT CURRENT_DATE();

-- Requête pour calculer les moyennes mensuelles des actions des US envers la Chine en excluant certains codes CAMEO
WITH combined_events AS (
  SELECT
    PARSE_DATE('%Y%m%d', CAST(SQLDATE AS STRING)) AS event_date,
    GoldsteinScale,
    NumMentions,
    AvgTone,
    EventCode,
    ActionGeo_FullName,
    ActionGeo_CountryCode,
    ActionGeo_Lat,
    ActionGeo_Long,
    SOURCEURL
  FROM
    `gdelt-bq.full.events`
  WHERE
    Actor1Name = 'UNITED STATES'
    AND Actor2Name = 'CHINA'
    AND PARSE_DATE('%Y%m%d', CAST(SQLDATE AS STRING)) BETWEEN start_date AND end_date
    AND EventCode NOT IN ('0211', '0231', '0254', '0311', '0331', '0354', '054', '071', '085', '110', '1031', '1054', '1211', '1221', '1244', '1621')
  UNION ALL
  SELECT
    PARSE_DATE('%Y%m%d', CAST(SQLDATE AS STRING)) AS event_date,
    GoldsteinScale,
    NumMentions,
    AvgTone,
    EventCode,
    ActionGeo_FullName,
    ActionGeo_CountryCode,
    ActionGeo_Lat,
    ActionGeo_Long,
    SOURCEURL
  FROM
    `gdelt-bq.gdeltv2.events`
  WHERE
    Actor1Name = 'UNITED STATES'
    AND Actor2Name = 'CHINA'
    AND PARSE_DATE('%Y%m%d', CAST(SQLDATE AS STRING)) BETWEEN start_date AND end_date
    AND EventCode NOT IN ('0211', '0231', '0254', '0311', '0331', '0354', '054', '071', '085', '110', '1031', '1054', '1211', '1221', '1244', '1621')
)
SELECT
  FORMAT_TIMESTAMP('%Y-%m', TIMESTAMP(event_date)) AS event_month,
  AVG(CASE WHEN GoldsteinScale > 0 THEN GoldsteinScale ELSE NULL END) AS avg_positive_goldstein_scale,
  AVG(CASE WHEN GoldsteinScale < 0 THEN GoldsteinScale ELSE NULL END) AS avg_negative_goldstein_scale,
  AVG(NumMentions) AS avg_num_mentions,
  AVG(AvgTone) AS avg_tone,
  ARRAY_AGG(DISTINCT EventCode) AS event_codes,
  ANY_VALUE(ActionGeo_FullName) AS location_name,
  ANY_VALUE(ActionGeo_CountryCode) AS country_code,
  ANY_VALUE(ActionGeo_Lat) AS latitude,
  ANY_VALUE(ActionGeo_Long) AS longitude,
  ANY_VALUE(SOURCEURL) AS source_url
FROM
  combined_events
GROUP BY
  event_month
ORDER BY
  event_month;
In Google Colab, use the following code to generate an Excel file:
# Convert BigQuery DataFrame to pandas DataFrame.
pandas_df = bq_df.to_pandas()
# Process the DataFrame
# Convert the 'event_month' column to datetime
bq_df['event_month'] = pd.to_datetime(bq_df['event_month'], errors='coerce')
# Sort the DataFrame by 'event_month'
bq_df = bq_df.sort_values('event_month')
# Format the 'event_month' column as DD-MM-YYYY
bq_df['event_month'] = bq_df['event_month'].dt.strftime('%d-%m-%Y')
# Save the DataFrame to an Excel file
excel_file_path = 'goldstein_scores_analysis.xlsx'
bq_df.to_excel(excel_file_path, index=False)
# Download the Excel file
from google.colab import files
files.download(excel_file_path)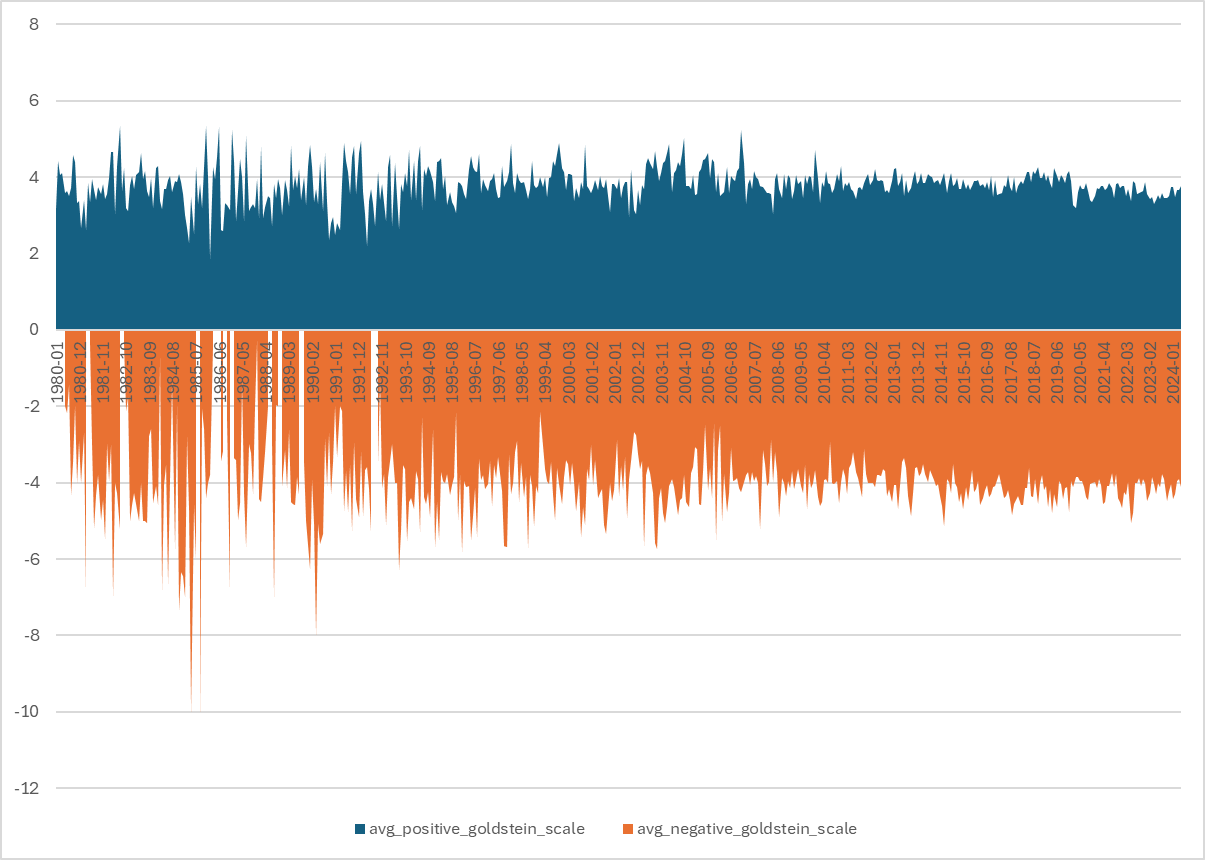
In future blogs, I will refine the CAMEO event codes. Stay tuned.