The Chiṭu-Eichengreen-Mehl Global Currencies Database (CEMGCD) has been released and you can explore fascinating multiple databases provided in the following website:
https://globalcurrenciesdatabase.com/publications-datasets
For people interested in panel time series and international reserves, two datasets are very interesting for you:
- Currency composition of foreign exchange reserves (80 countries): 1999-2020
Arslanalp, S., B. Eichengreen and C. Simpson-Bell (2022), “The stealth erosion of dollar dominance and the rise of nontraditional reserve currencies”, Journal of International Economics, 138, 103656.
- Gold as international reserves (198 countries): 1980-2021
Arslanalp, S., B. Eichengreen and C. Simpson-Bell (2023), “Gold as international reserves: A barbarous relic no more?”, Journal of International Economics, 145, 103822.
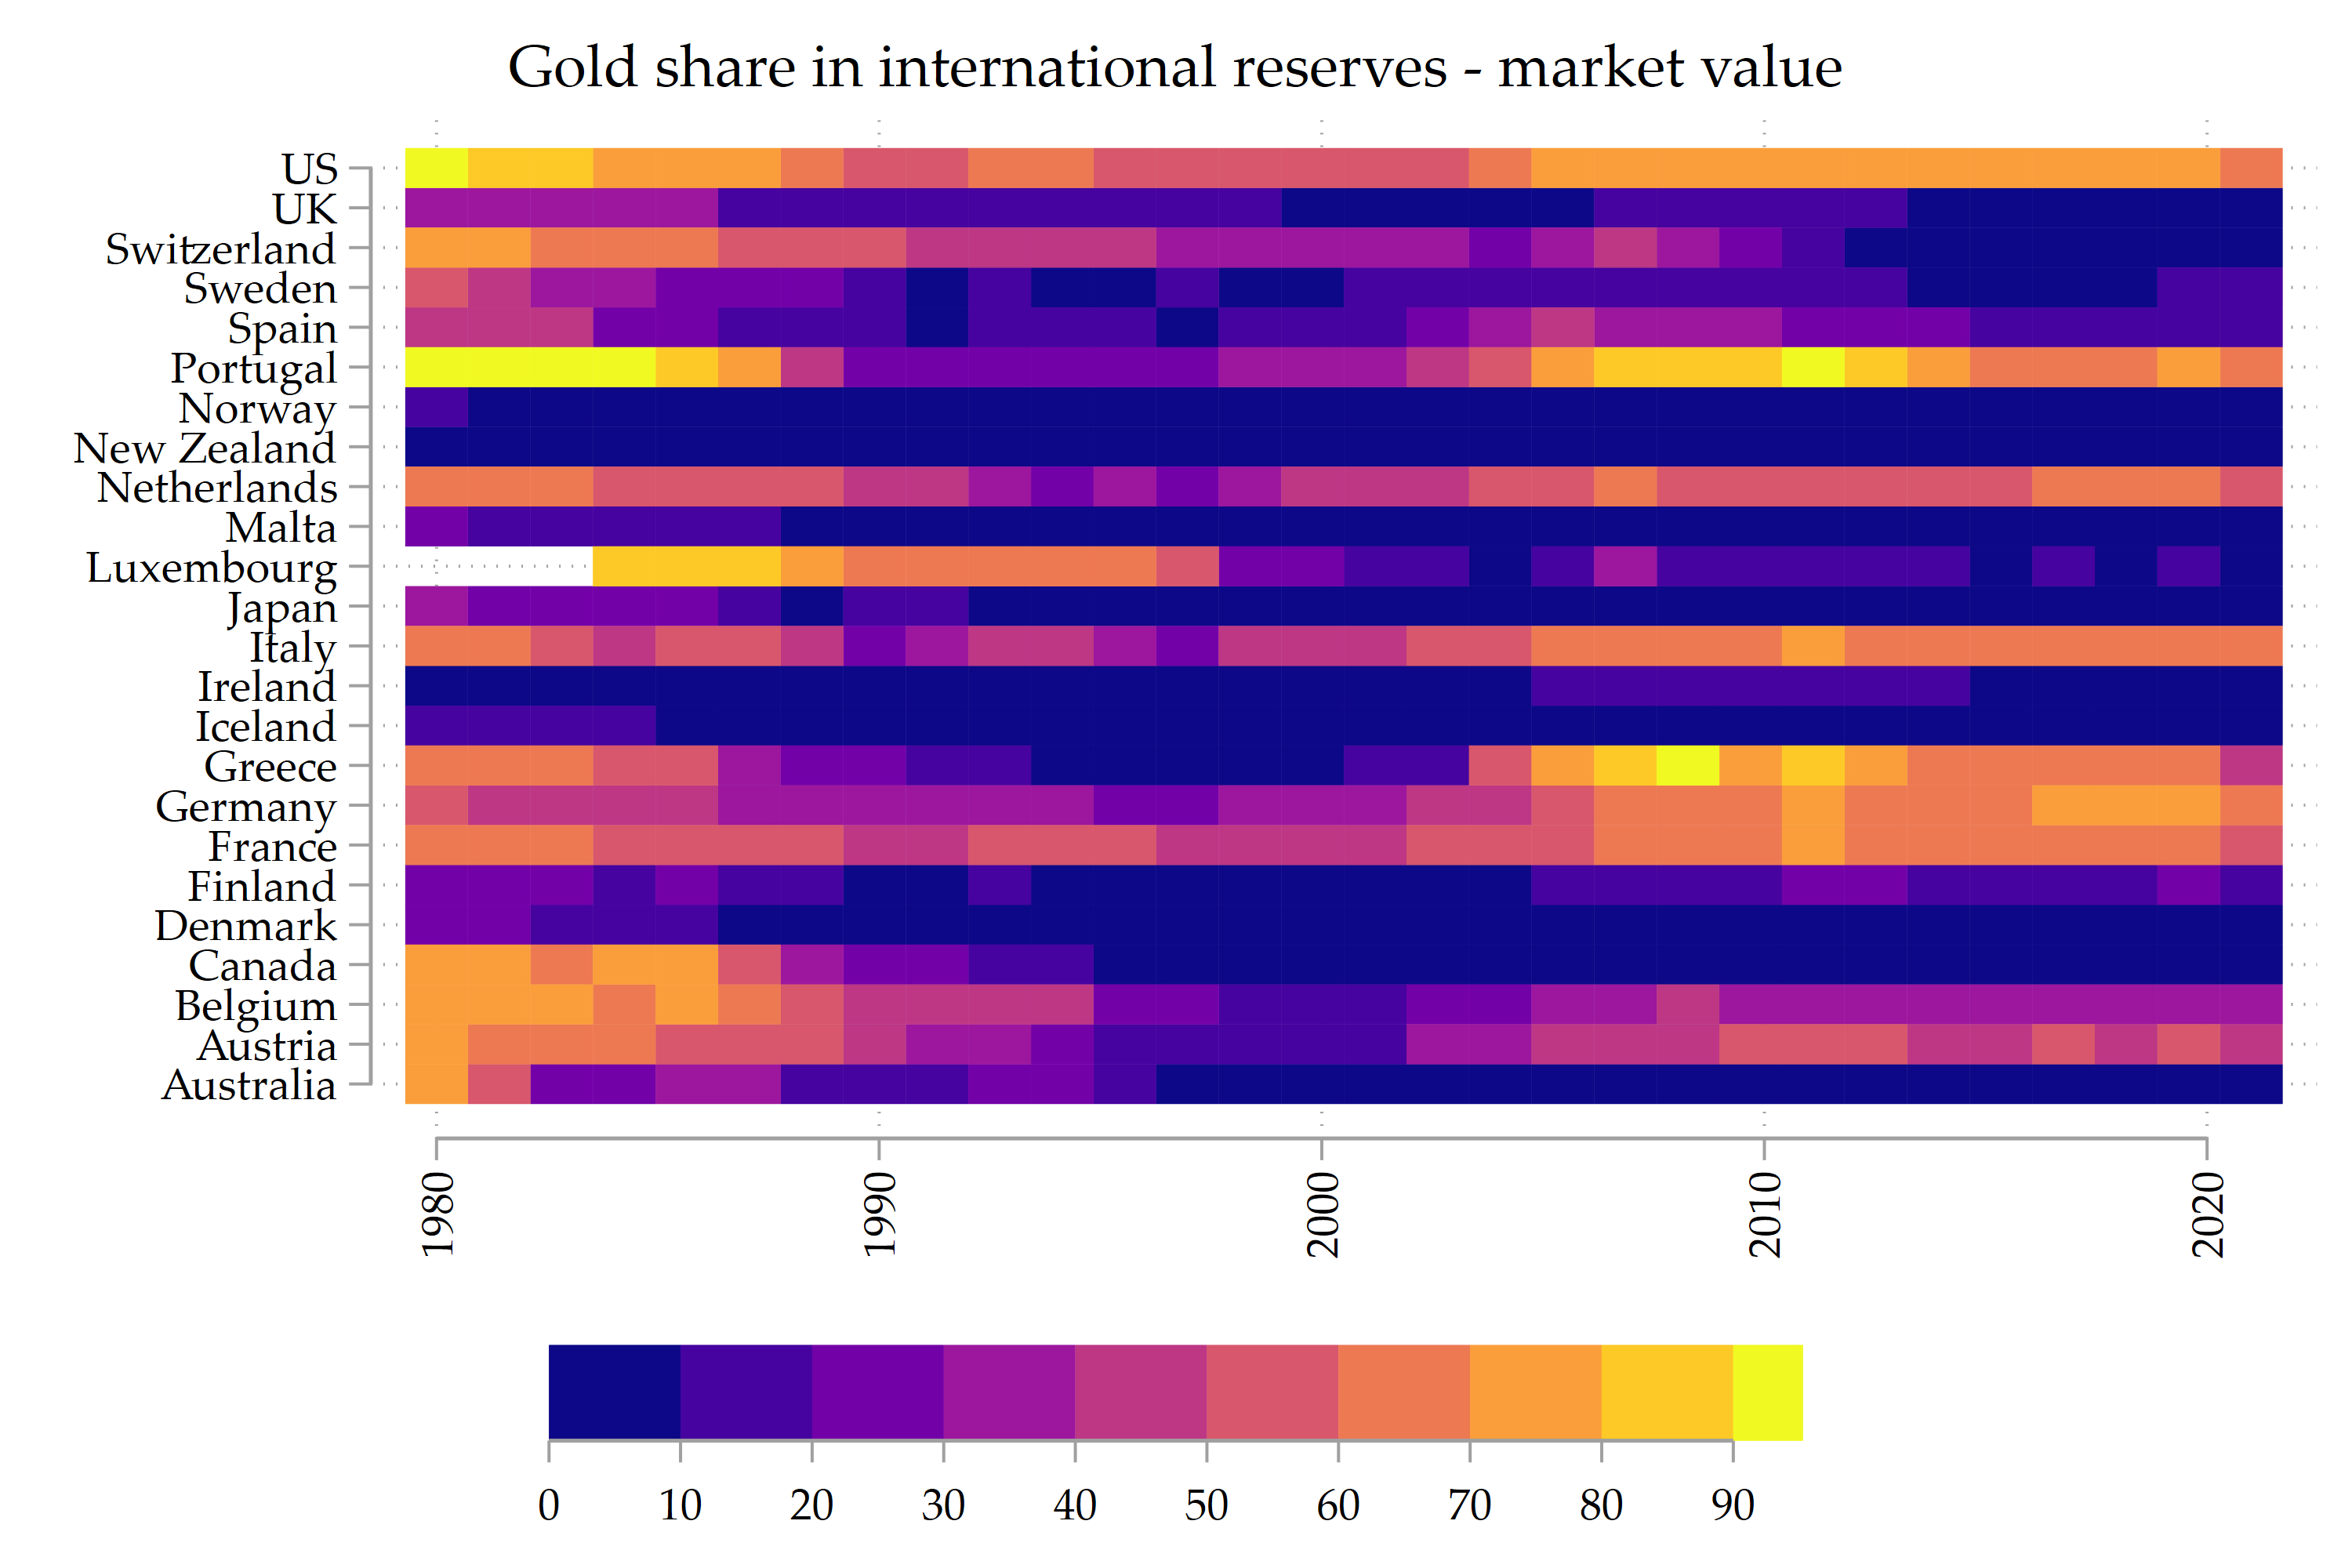
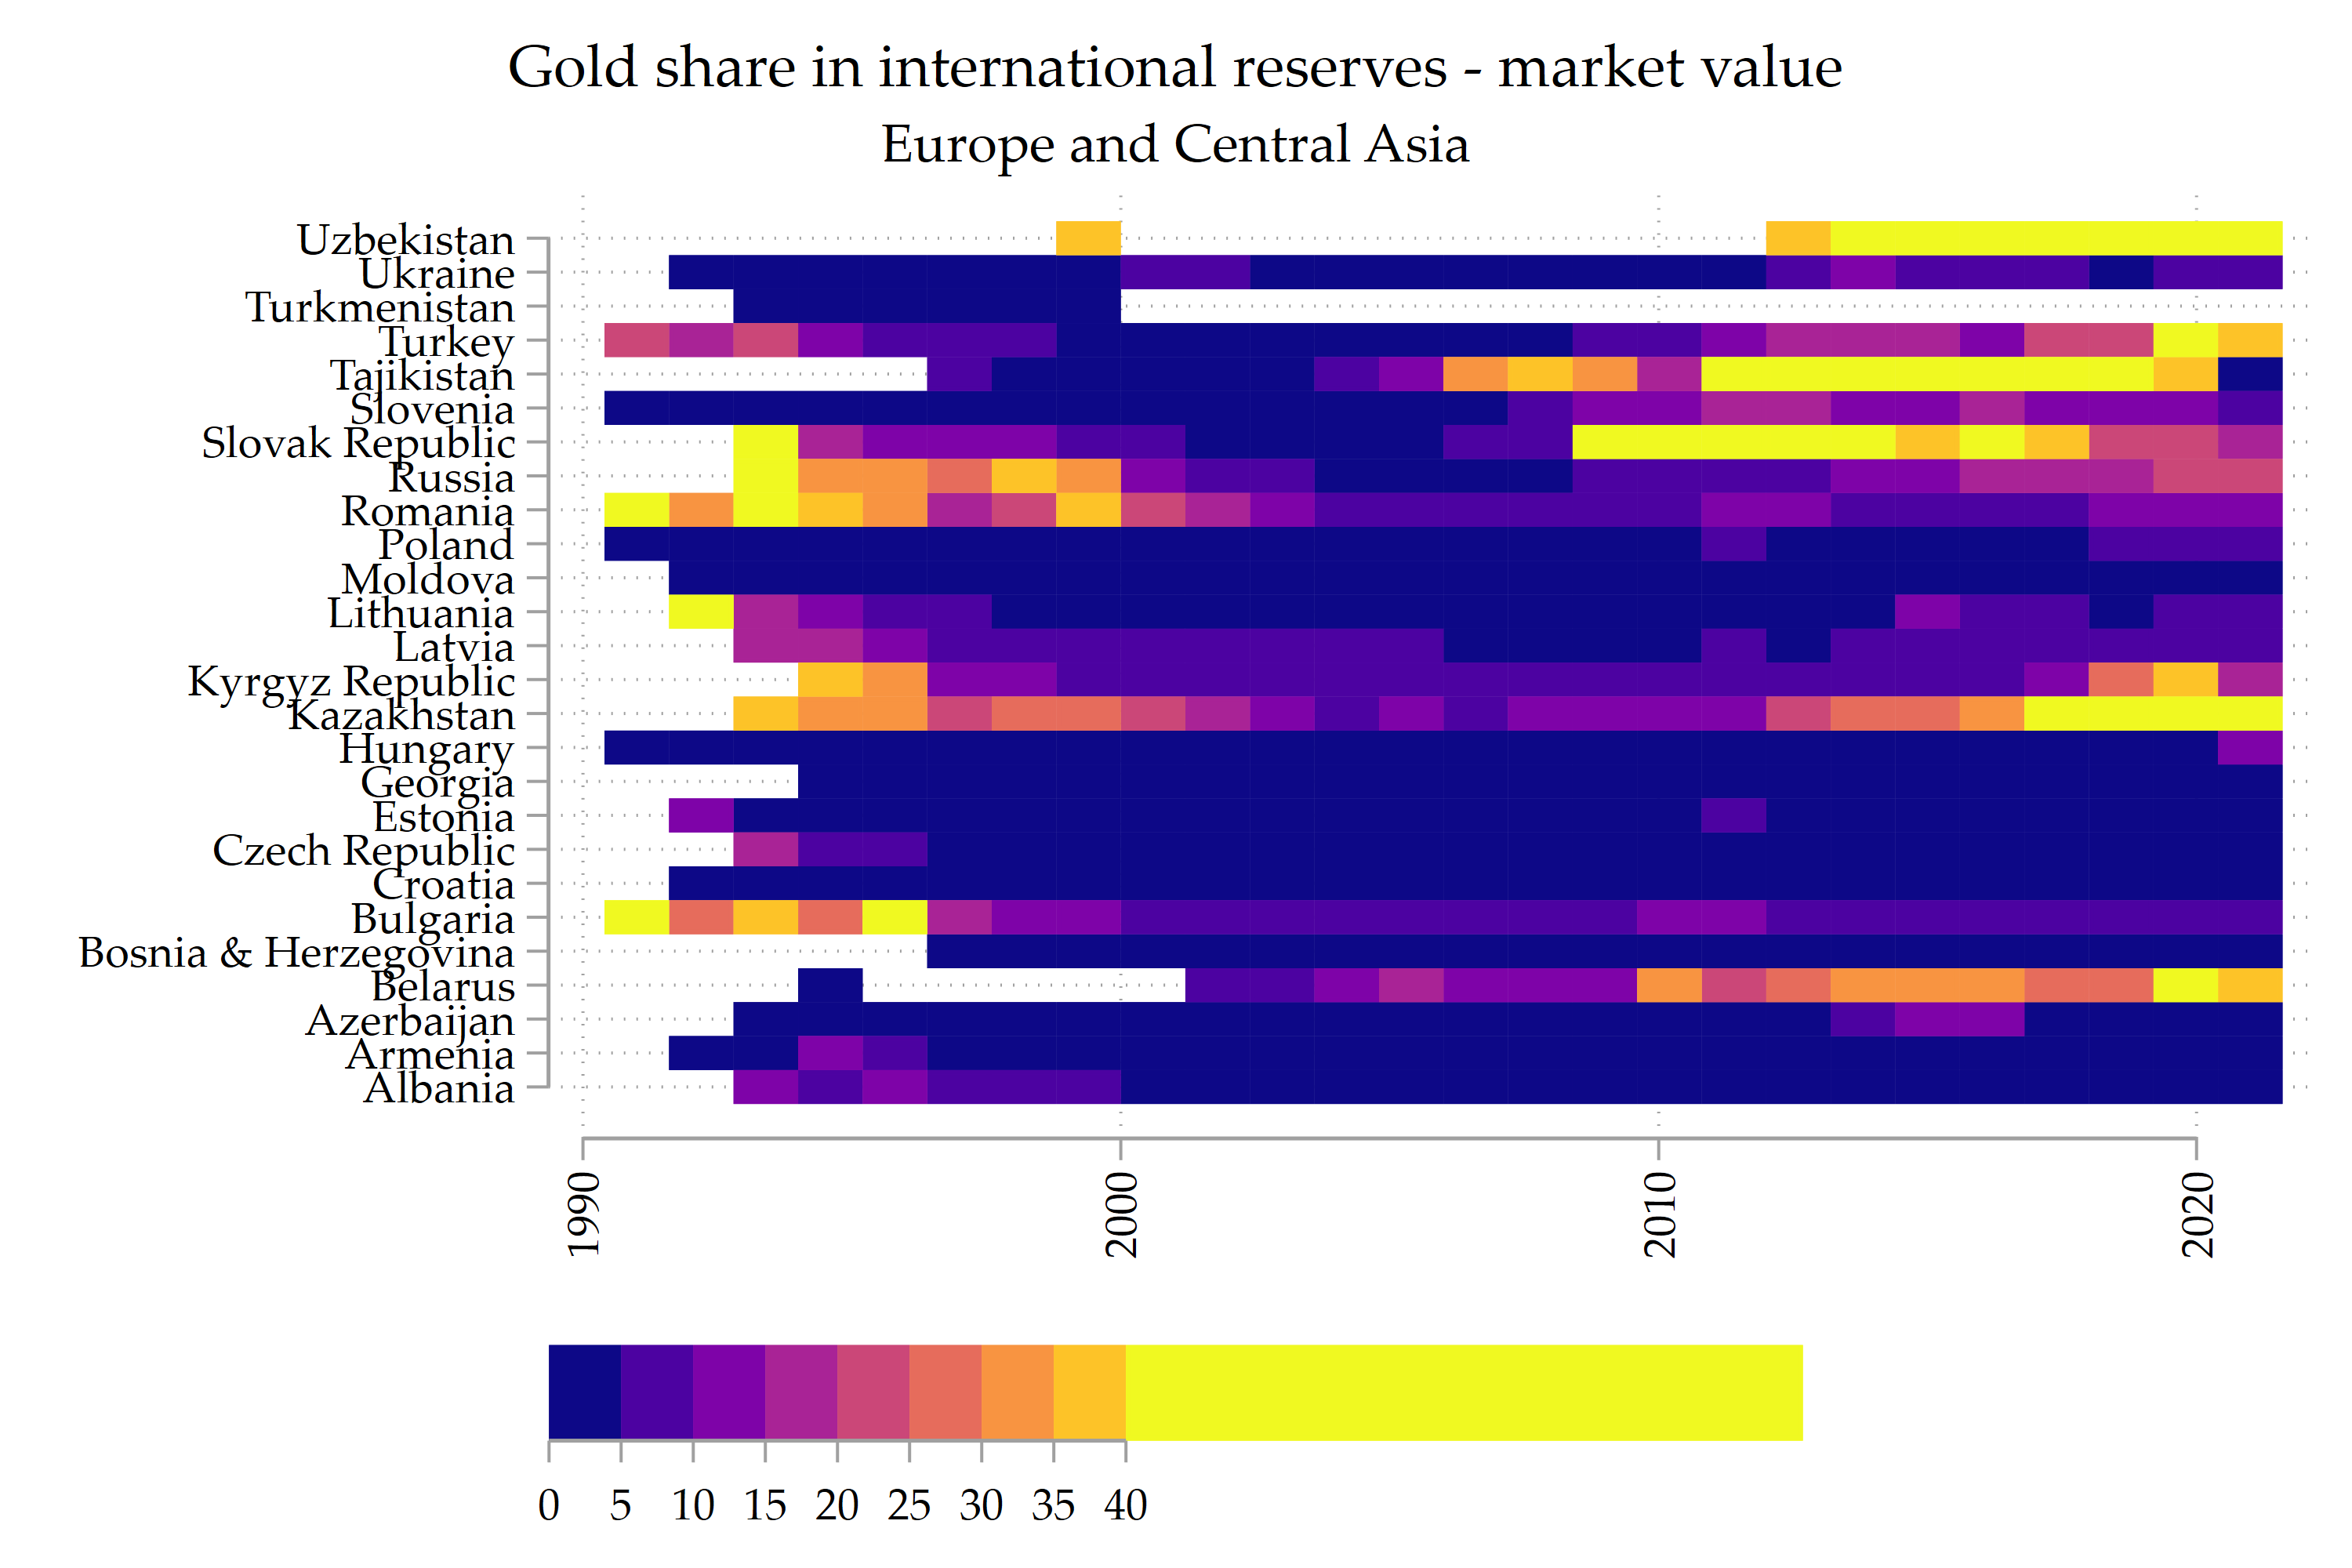
I will make a second post on the first dataset, but for now let us look at some heatmaps for the share of gold holdings in international reserves that we found in the second paper.

I add the code for replicating the heatmaps and maps of this blog.
**# Heatmaps

use "C:\Users\jamel\Dropbox\Currency_Database\10.2. Gold as international reserves (198 countries) 1980-2021 - panel_data.dta", clear

xtdes

*ssc install labmask

labmask num, values(country)

set scheme Cleanplots
graph set window fontface "Palatino Linotype"

gen GOLD = 100*gold_val_market
format GOLD  %4.2f

*ssc install heatplot

kountry country, from(other) stuck marker

rename _ISO3N_ iso3c
drop MARKER
kountry iso3c, from(iso3n) to(iso2c)
rename _ISO2C_ iso2c

kountry iso3c, from(iso3n) to(imfn)
rename _IMFN_ imfcode
drop if imfcode==.

// Create the country groups (requires the ado-file 'group_dummy')
rename imfcode cn
group_dummy
rename cn imfcode

summ GOLD if idc==1

heatplot GOLD country yr if idc==1 ///
    , ///
    cuts(0(10)90) ///
	color(plasma) ///
	ti("Gold share in international reserves - market value") ///
	xti("") yti("") ///
    ylabel(, angle(horizontal)) ///
    xlabel(, angle(vertical)) ///
	ramp(format(%4.0f) label(0(10)90) subtitle("")) ///
	name(GOLD_RODGER, replace)
graph export GOLD_IDC.png, as(png) width(3000) replace

summ GOLD if eca==1 & yr>2000, detail

heatplot GOLD country yr if eca==1 & yr>1990 ///
    , ///
    cuts(0(5)40) ///
	color(plasma) ///
	ti("Gold share in international reserves - market value") ///
	subtitle("Europe and Central Asia") ///
	xti("") yti("") ///
    ylabel(, angle(horizontal) labsize(small)) ///
    xlabel(, angle(vertical)) ///
	ramp(format(%4.0f) label(0(5)40) subtitle("")) ///
	name(GOLD_MONKEYD, replace)
graph export GOLD_ECA.png, as(png) width(3000) replace
**# Maps
cls
clear
// Start
**# Merge and draw the Maps
use maps_again.dta, clear
duplicates list IFScode
*drop if IFScode==.
drop ccode
rename IFScode imfcode
merge m:1 imfcode using gold2021.dta, nogenerate
spmap GOLD using coord_mercator_world.dta, ///
id(na_id_world) fcolor(BuYlRd) ///
osize(vvthin ..) ndsize(vvthin) ///
ndfcolor(gray%10) ///
clnumber(7) ///
title("Gold share in International Reserves in 2021") ///
note(`"Note: In some countries, the gold share can represent geopolitical alignment."', size(vsmall))
graph rename Graph GOLDMAP, replace
graph export GOLDMAP.png, replace width(4000)
**# End of the ProgramThat’s all for today folks! Comments and remarks are welcome.
1 Comment
[…] Chiṭu-Eichengreen-Mehl Global Currencies Database (CEMGCD) […]