The Bank for International Settlements provides access to daily exchange rates. It may be interesting to plot the evolution of exchange rates since the Inauguration Day of the new US President.
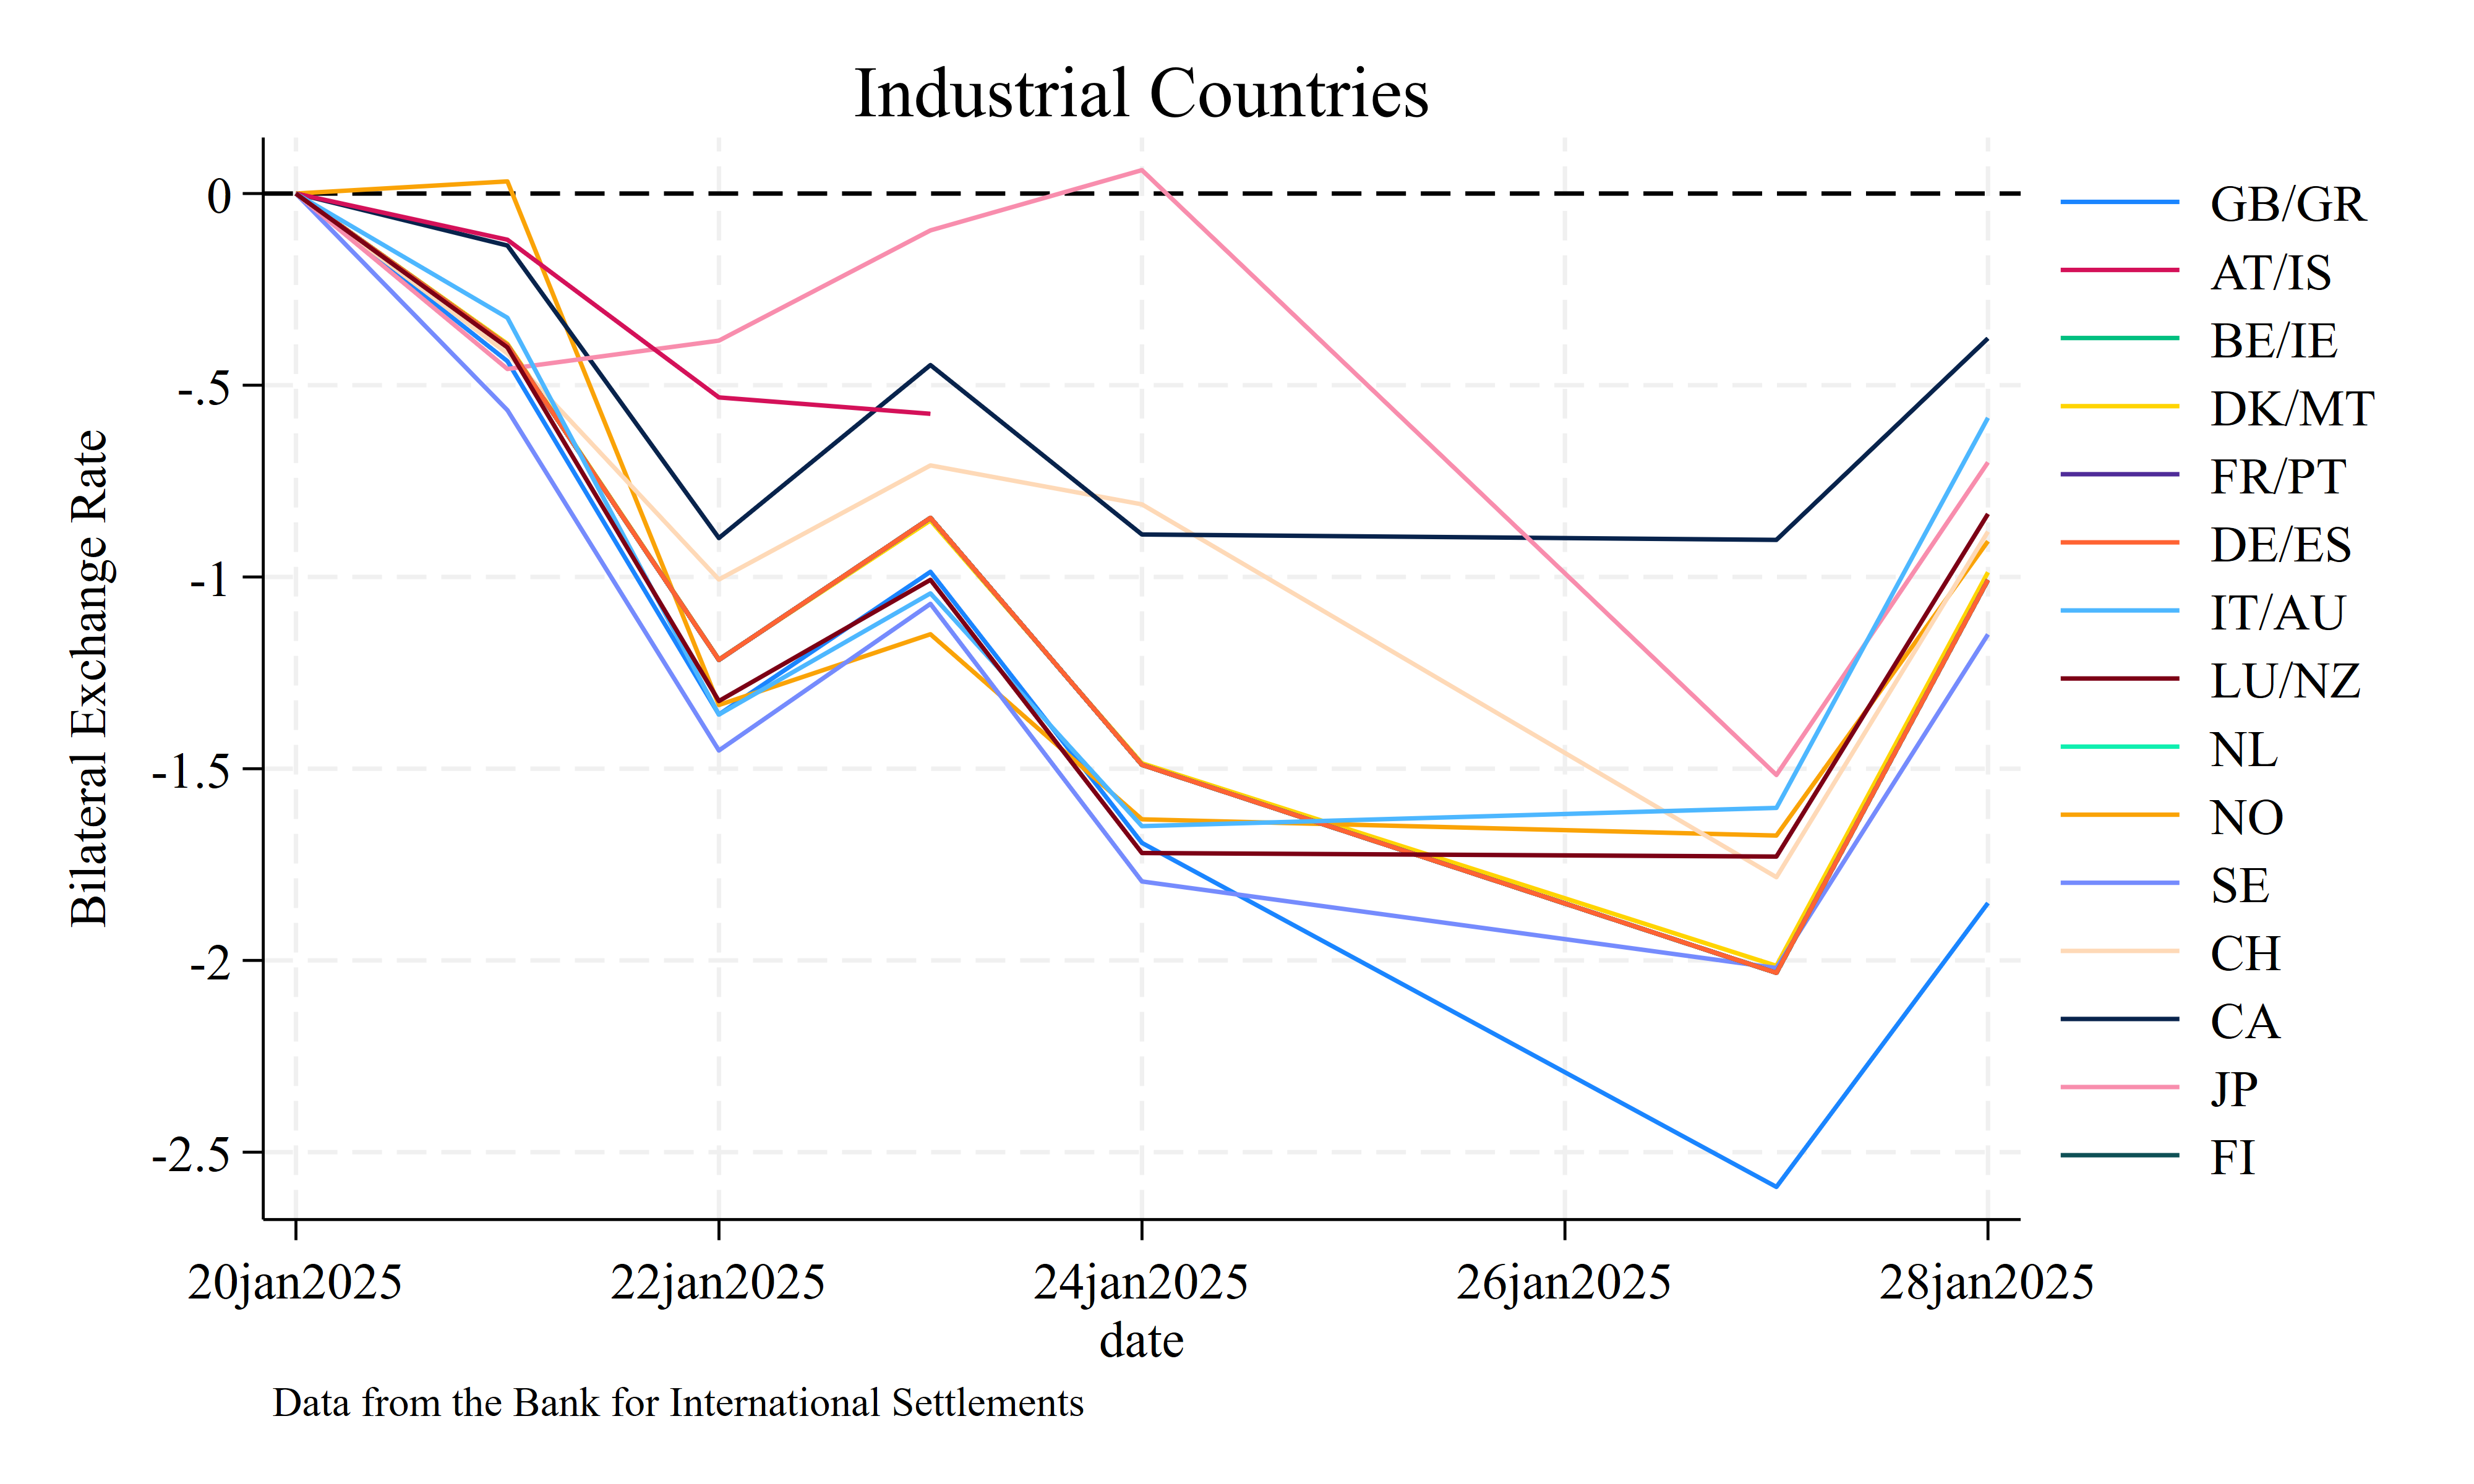
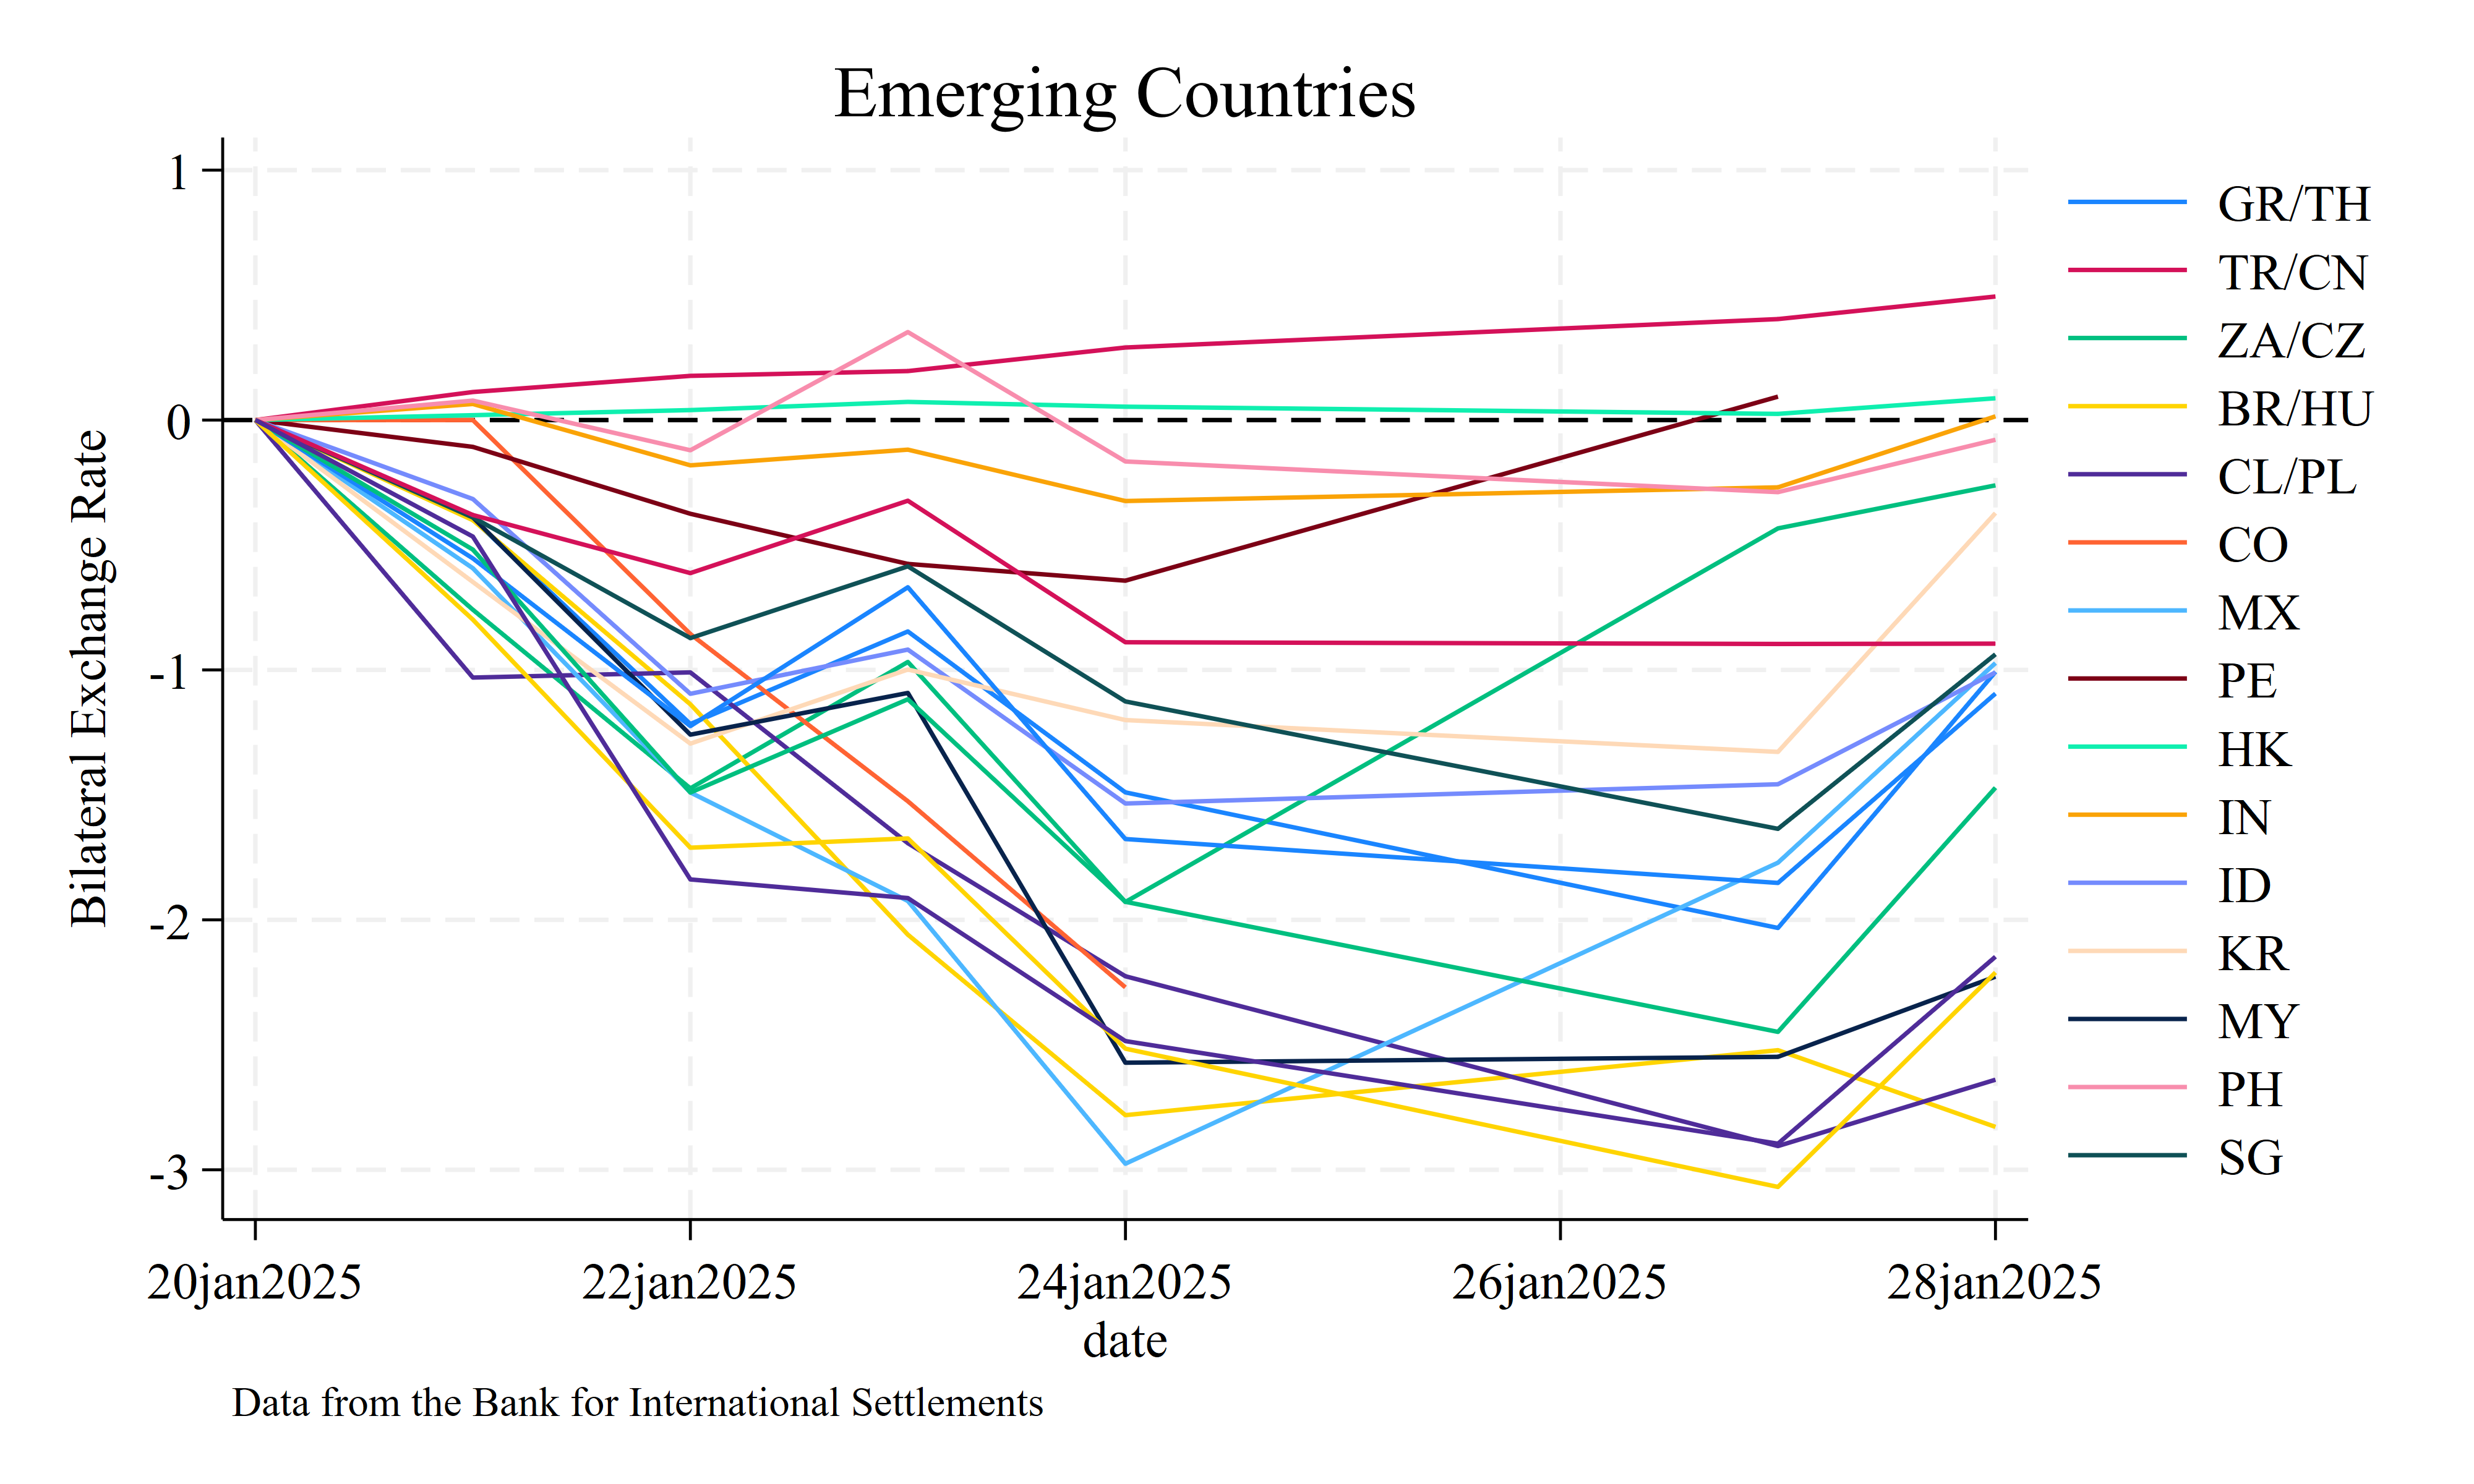
In this blog, I will show you how to use Jupyter and Stata to produce the following graphs below, representing the exchange rate depreciation since election day. Let me recommend you to read my previous blog on Central Bank Total Assets to reproduce the blog.
I also recommend consulting my series of blogs on DBnomics and Jupyter, since I will be a bit fast on some part that have been already covered on EconMacro.
We start by selecting the desired data on the web portal, then I chose ‘Export’, ‘Code snippet’, and ‘Jupyter’ for using the URL later in the Jupyter notebook. I selected all the countries and all the currencies. I can change the selection and the code snippet will change accordingly.
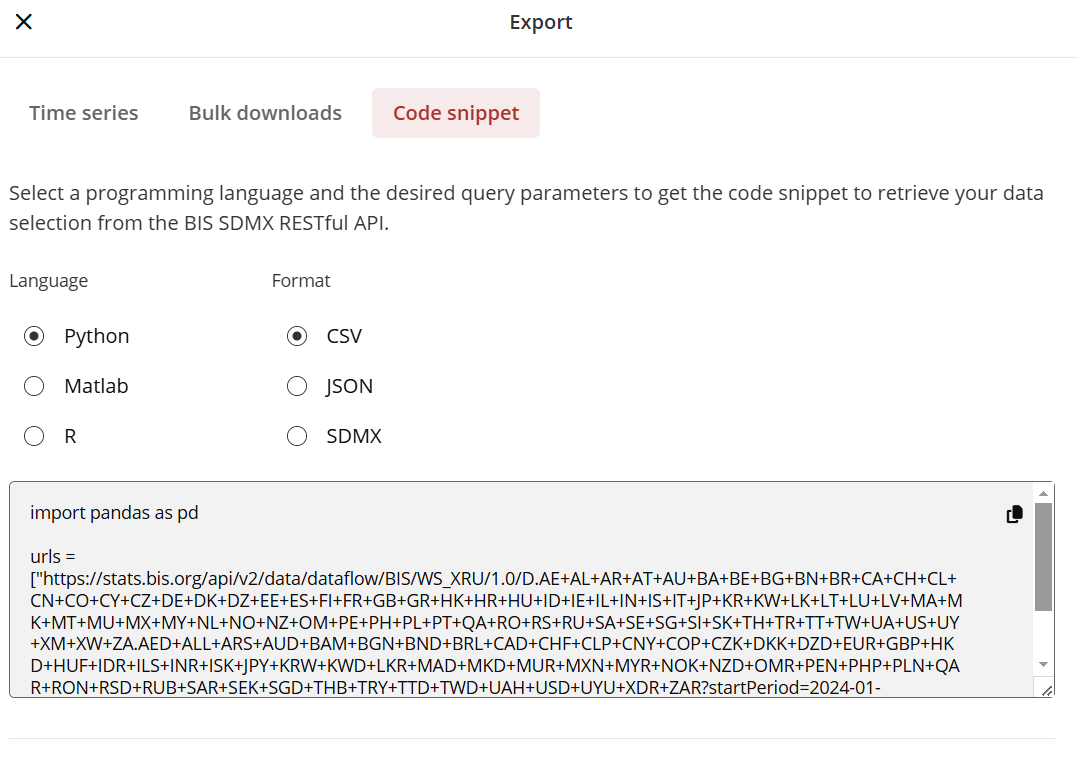
Now, I launch PyCharm and run the following code, where the URLs come from the previous step:
import pandas as pd
import requests

# Define the URL
url = "https://stats.bis.org/api/v2/data/dataflow/BIS/WS_XRU/1.0/D...A?startPeriod=2024-01-30&endPeriod=2025-01-30&format=csv"

try:
    # Fetch data from the API
    response = requests.get(url)
    response.raise_for_status()  # Raise an error for HTTP issues (4xx, 5xx)

    # Read the CSV content
    df = pd.read_csv(url)

    # Save data to an Excel file
    excel_filename = "BIS_exchange_rates.xlsx"
    df.to_excel(excel_filename, index=False)

    print(f"Data successfully saved to {excel_filename}")

except requests.exceptions.HTTPError as http_err:
    print(f"HTTP error occurred: {http_err}")
except requests.exceptions.RequestException as err:
    print(f"Other error occurred: {err}")
except Exception as e:
    print(f"An error occurred: {e}")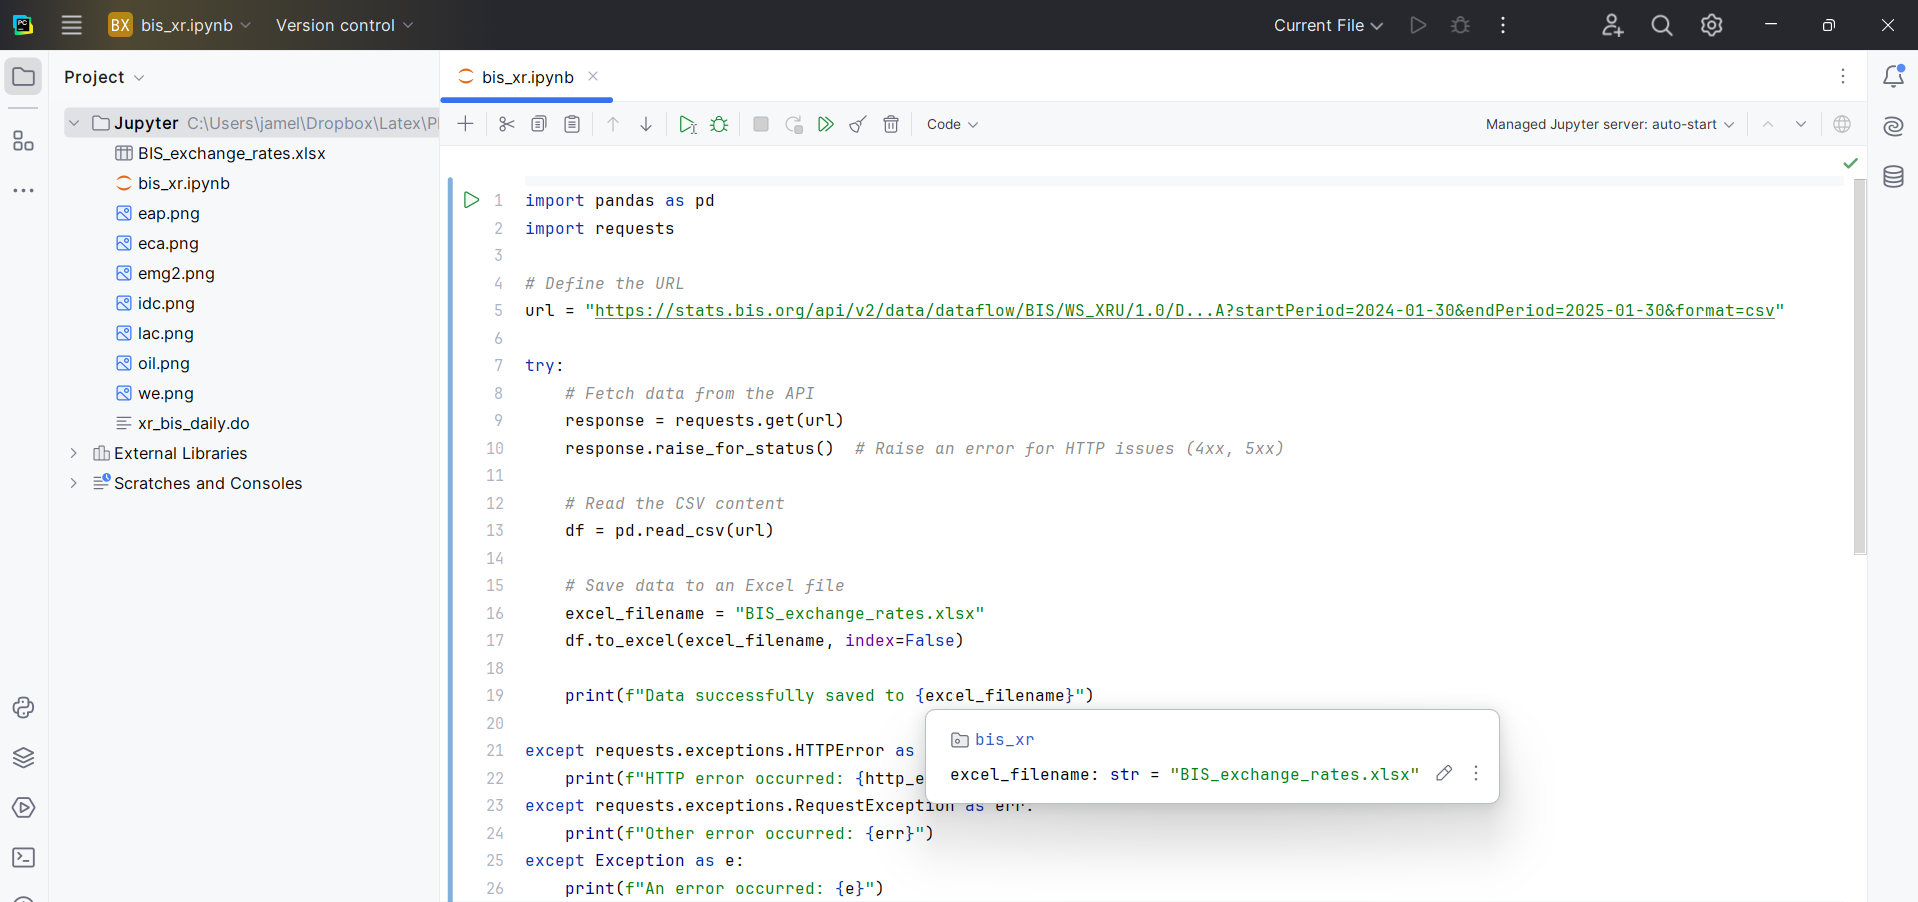
Now, I will rely on several Stata packages that I discussed in some of my previous posts to draw the figures presented at the top of this blog.
clear
cd "C:\Users\jamel\Dropbox\Latex\PROJECTS\"
cd "24-11-xr-trump-election\Jupyter\"
graph set window fontface "Times New Roman"
import excel "BIS_exchange_rates.xlsx", sheet("Sheet1") firstrow
des
kountry REF_AREA, from(iso2c)
rename NAMES_STD country
kountry REF_AREA, from(iso2c) to(imfn)
rename _IMFN_ imfcode
replace country = "United Arab Emirates" if REF_AREA == "AE"
replace country = "Euro Area" if REF_AREA == "XM"
drop if imfcode==.
split TIME_PERIOD, parse(-)
gen string = TIME_PERIOD3 + ///
"/" + TIME_PERIOD2 + ///
"/" + TIME_PERIOD1
gen date = date(string, "DMY")
format date %td
split TITLE, parse(-)
rename TITLE2 UNITS
rename OBS_VALUE XR
order imfcode date XR country REF_AREA UNITS
replace imfcode=999 if country=="Euro Area"
labmask imfcode, value(REF_AREA)
xtset imfcode date
tsfill, full
xtset imfcode date
xtdes
lab var XR "Bilateral Exchange rates"
rename imfcode cn
group_dummy
rename cn imfcode
gen XRDAY = XR if date==td(20jan2025)
by imfcode: egen TR = mean(XRDAY)
replace DXR = 100*(XR-TR)/TR
lgraph DXR date if date>=td(20jan2025) ///
& imfcode!=111 & DXR!=. & DXR!=0, ///
err(semean) yline(0) xlab(,angle(90)) ///
xti("") ti("Exchange rate variation")
label variable DXR "Bilateral Exchange Rate"
xtline DXR if idc==1 & date>=td(20jan2025) ///
& imfcode!=111 & DXR!=. & DXR!=0, yline(0) ///
overlay title("Industrial Countries") ///
note("Data from the Bank for International Settlements")
graph rename idc, replace
graph export idc.png, as(png) width(4000) replace
xtline DXR if emg2==1 & date>=td(20jan2025) ///
& imfcode!=111 & DXR!=. & DXR!=0, yline(0) ///
overlay title("Emerging Countries") ///
note("Data from the Bank for International Settlements")
graph rename emg2, replace
graph export emg2.png, as(png) width(4000) replace
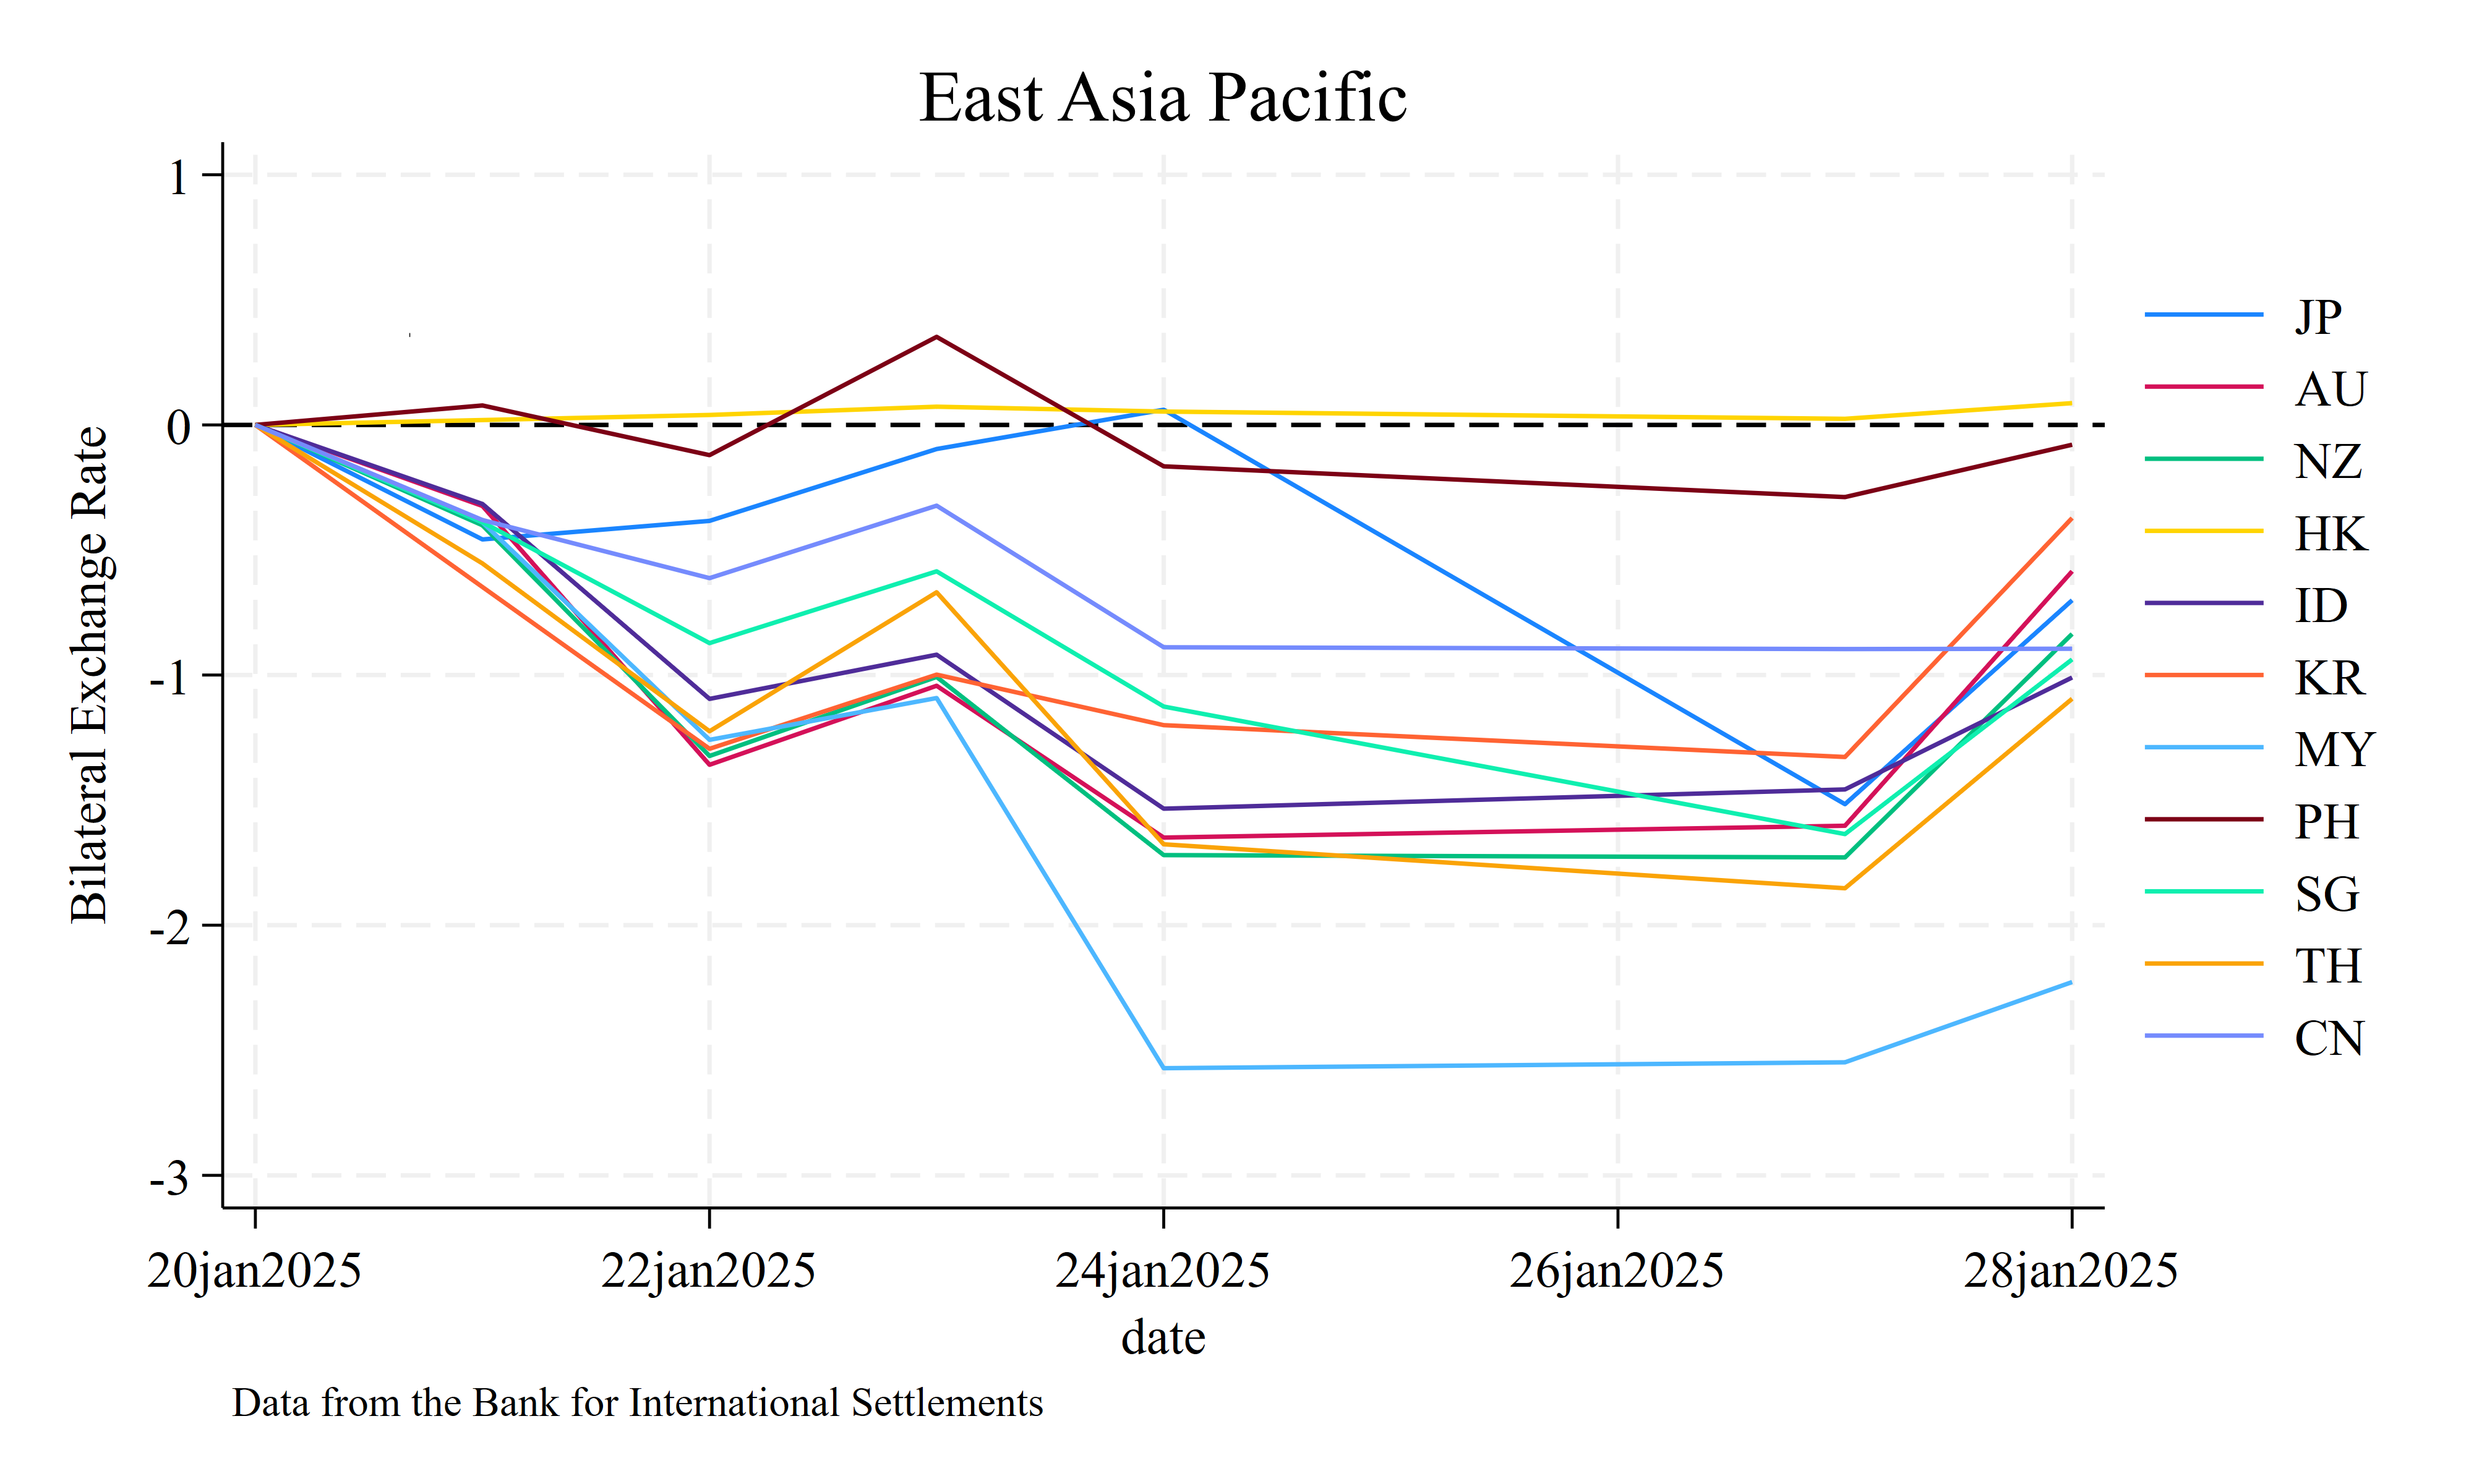
xtline DXR if eap==1 & date>=td(20jan2025) ///
& imfcode!=111 & DXR!=., yline(0) ///
overlay title("East Asia Pacific") ///
note("Data from the Bank for International Settlements")
graph rename eap, replace
graph export eap.png, as(png) width(4000) replace
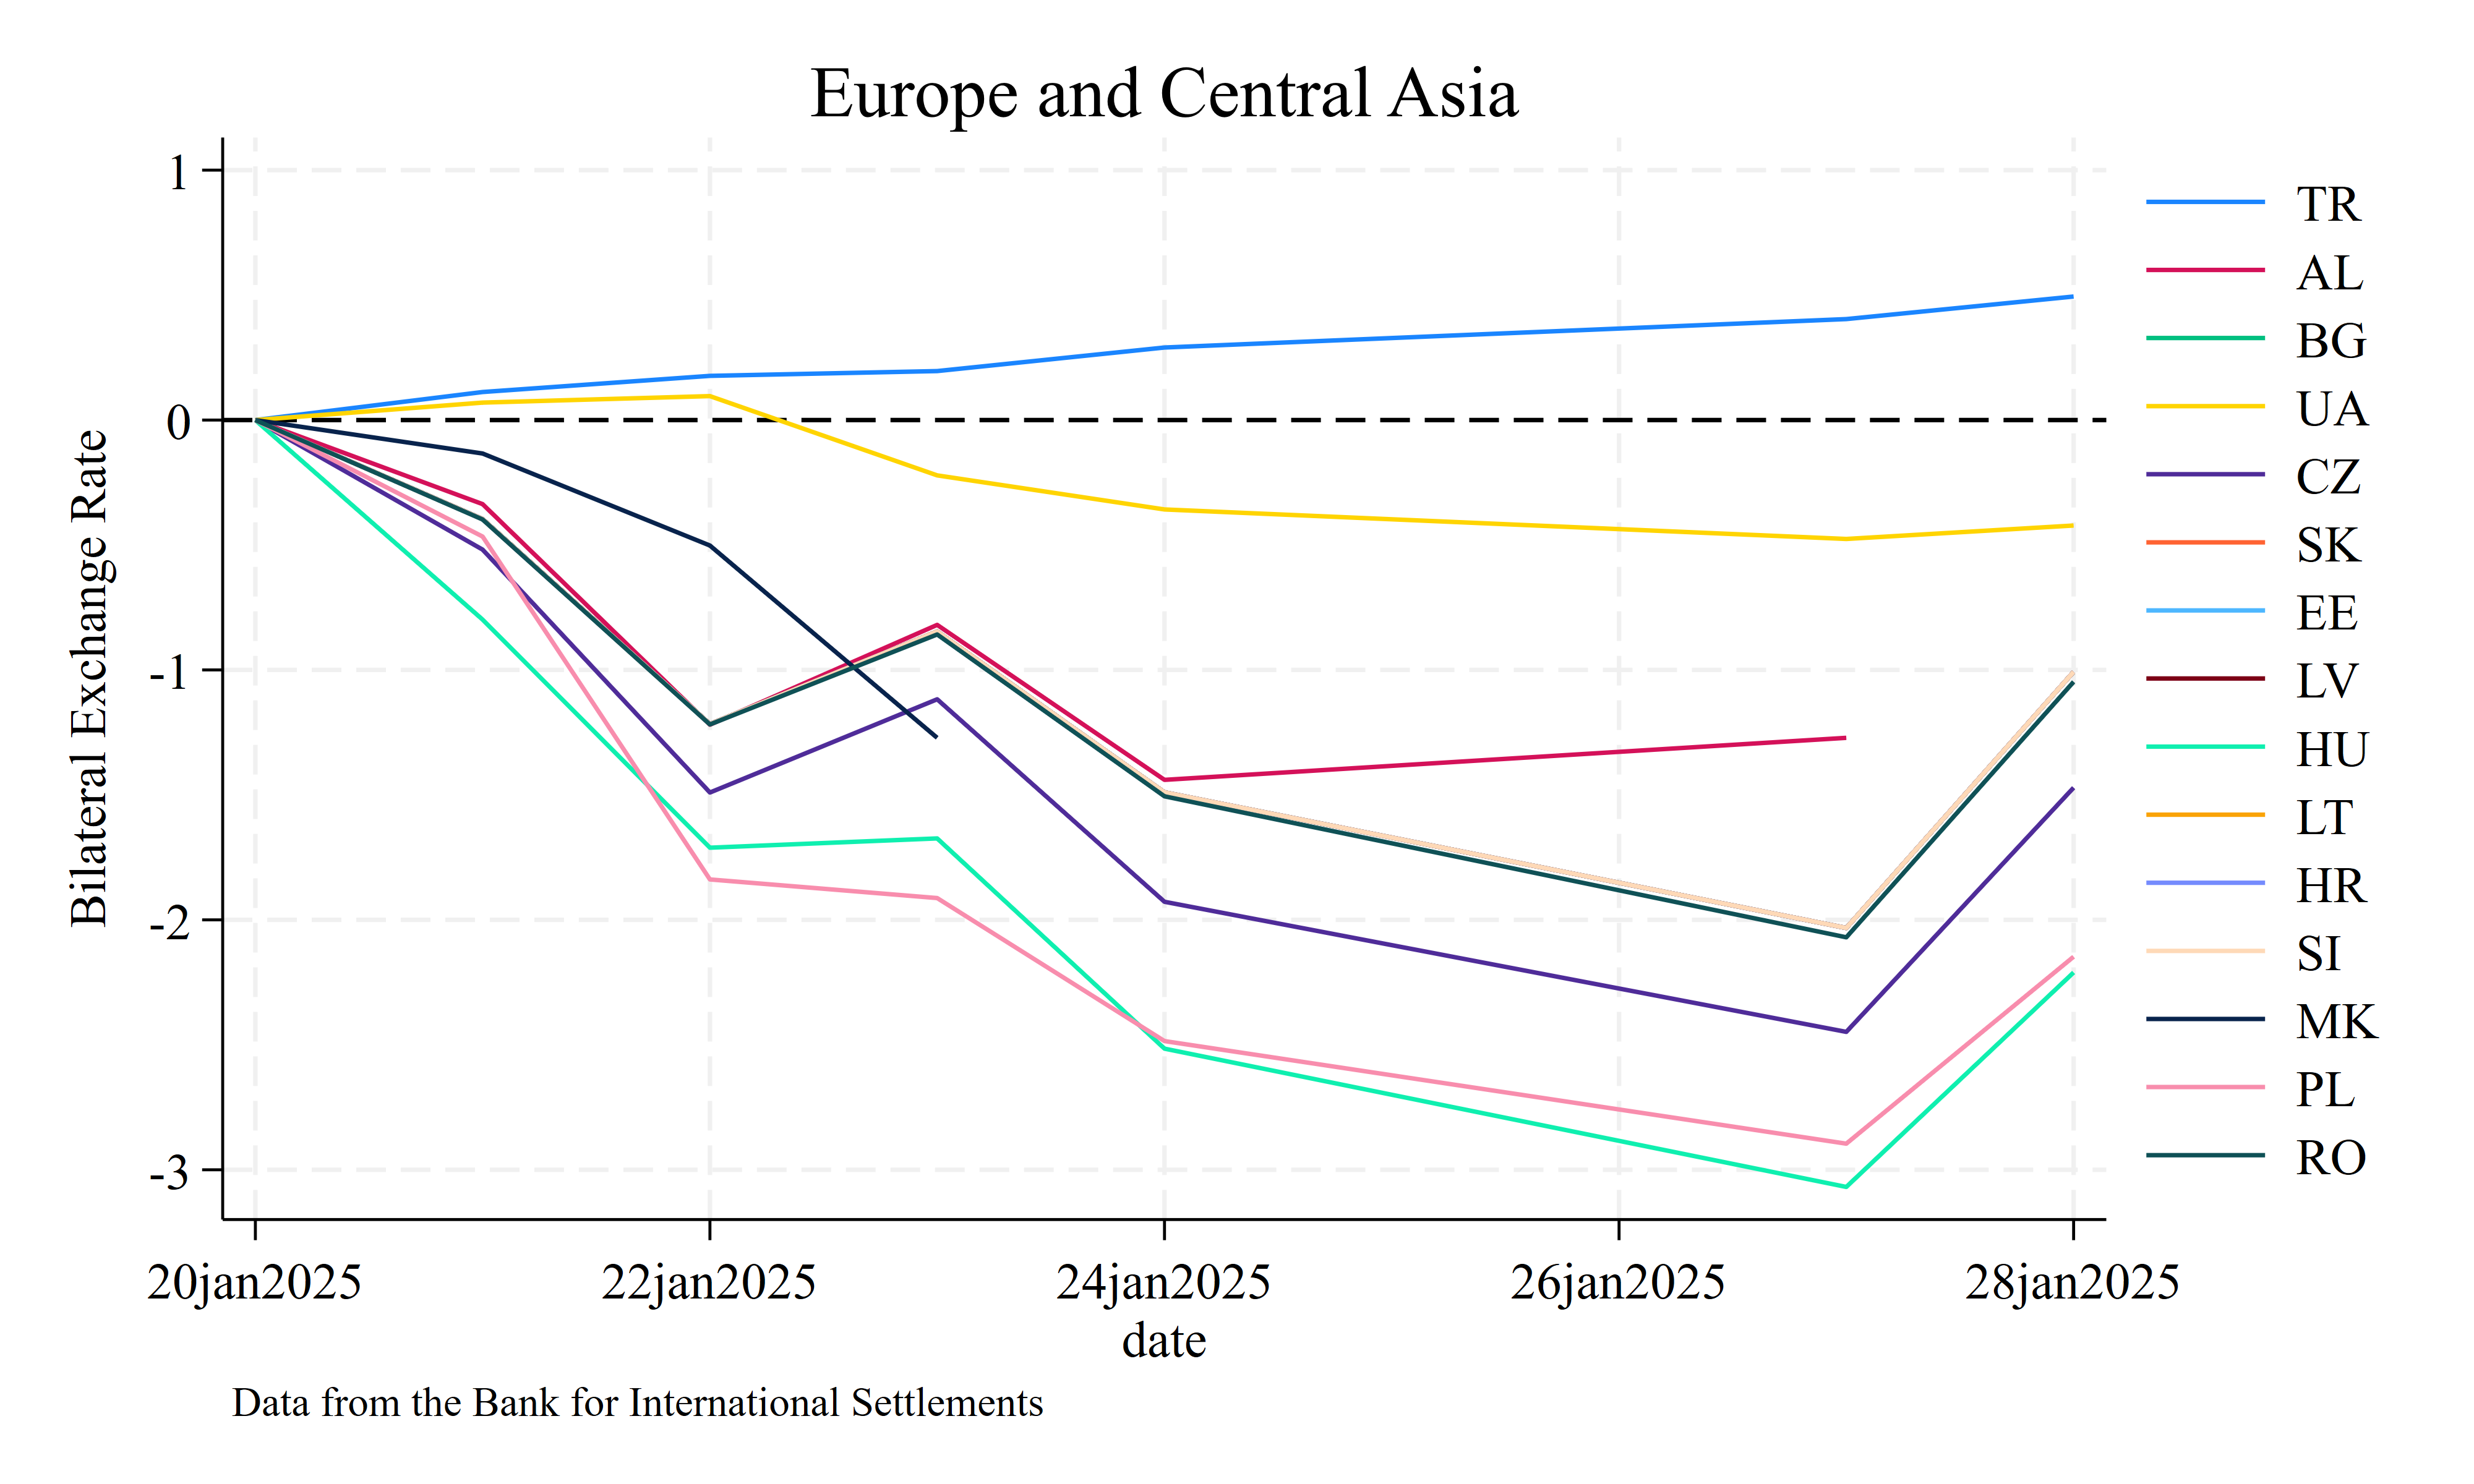
xtline DXR if eca==1 & date>=td(20jan2025) ///
& imfcode!=111 & DXR!=., yline(0) ///
overlay title("Europe and Central Asia") ///
note("Data from the Bank for International Settlements")
graph rename eca, replace
graph export eca.png, as(png) width(4000) replace
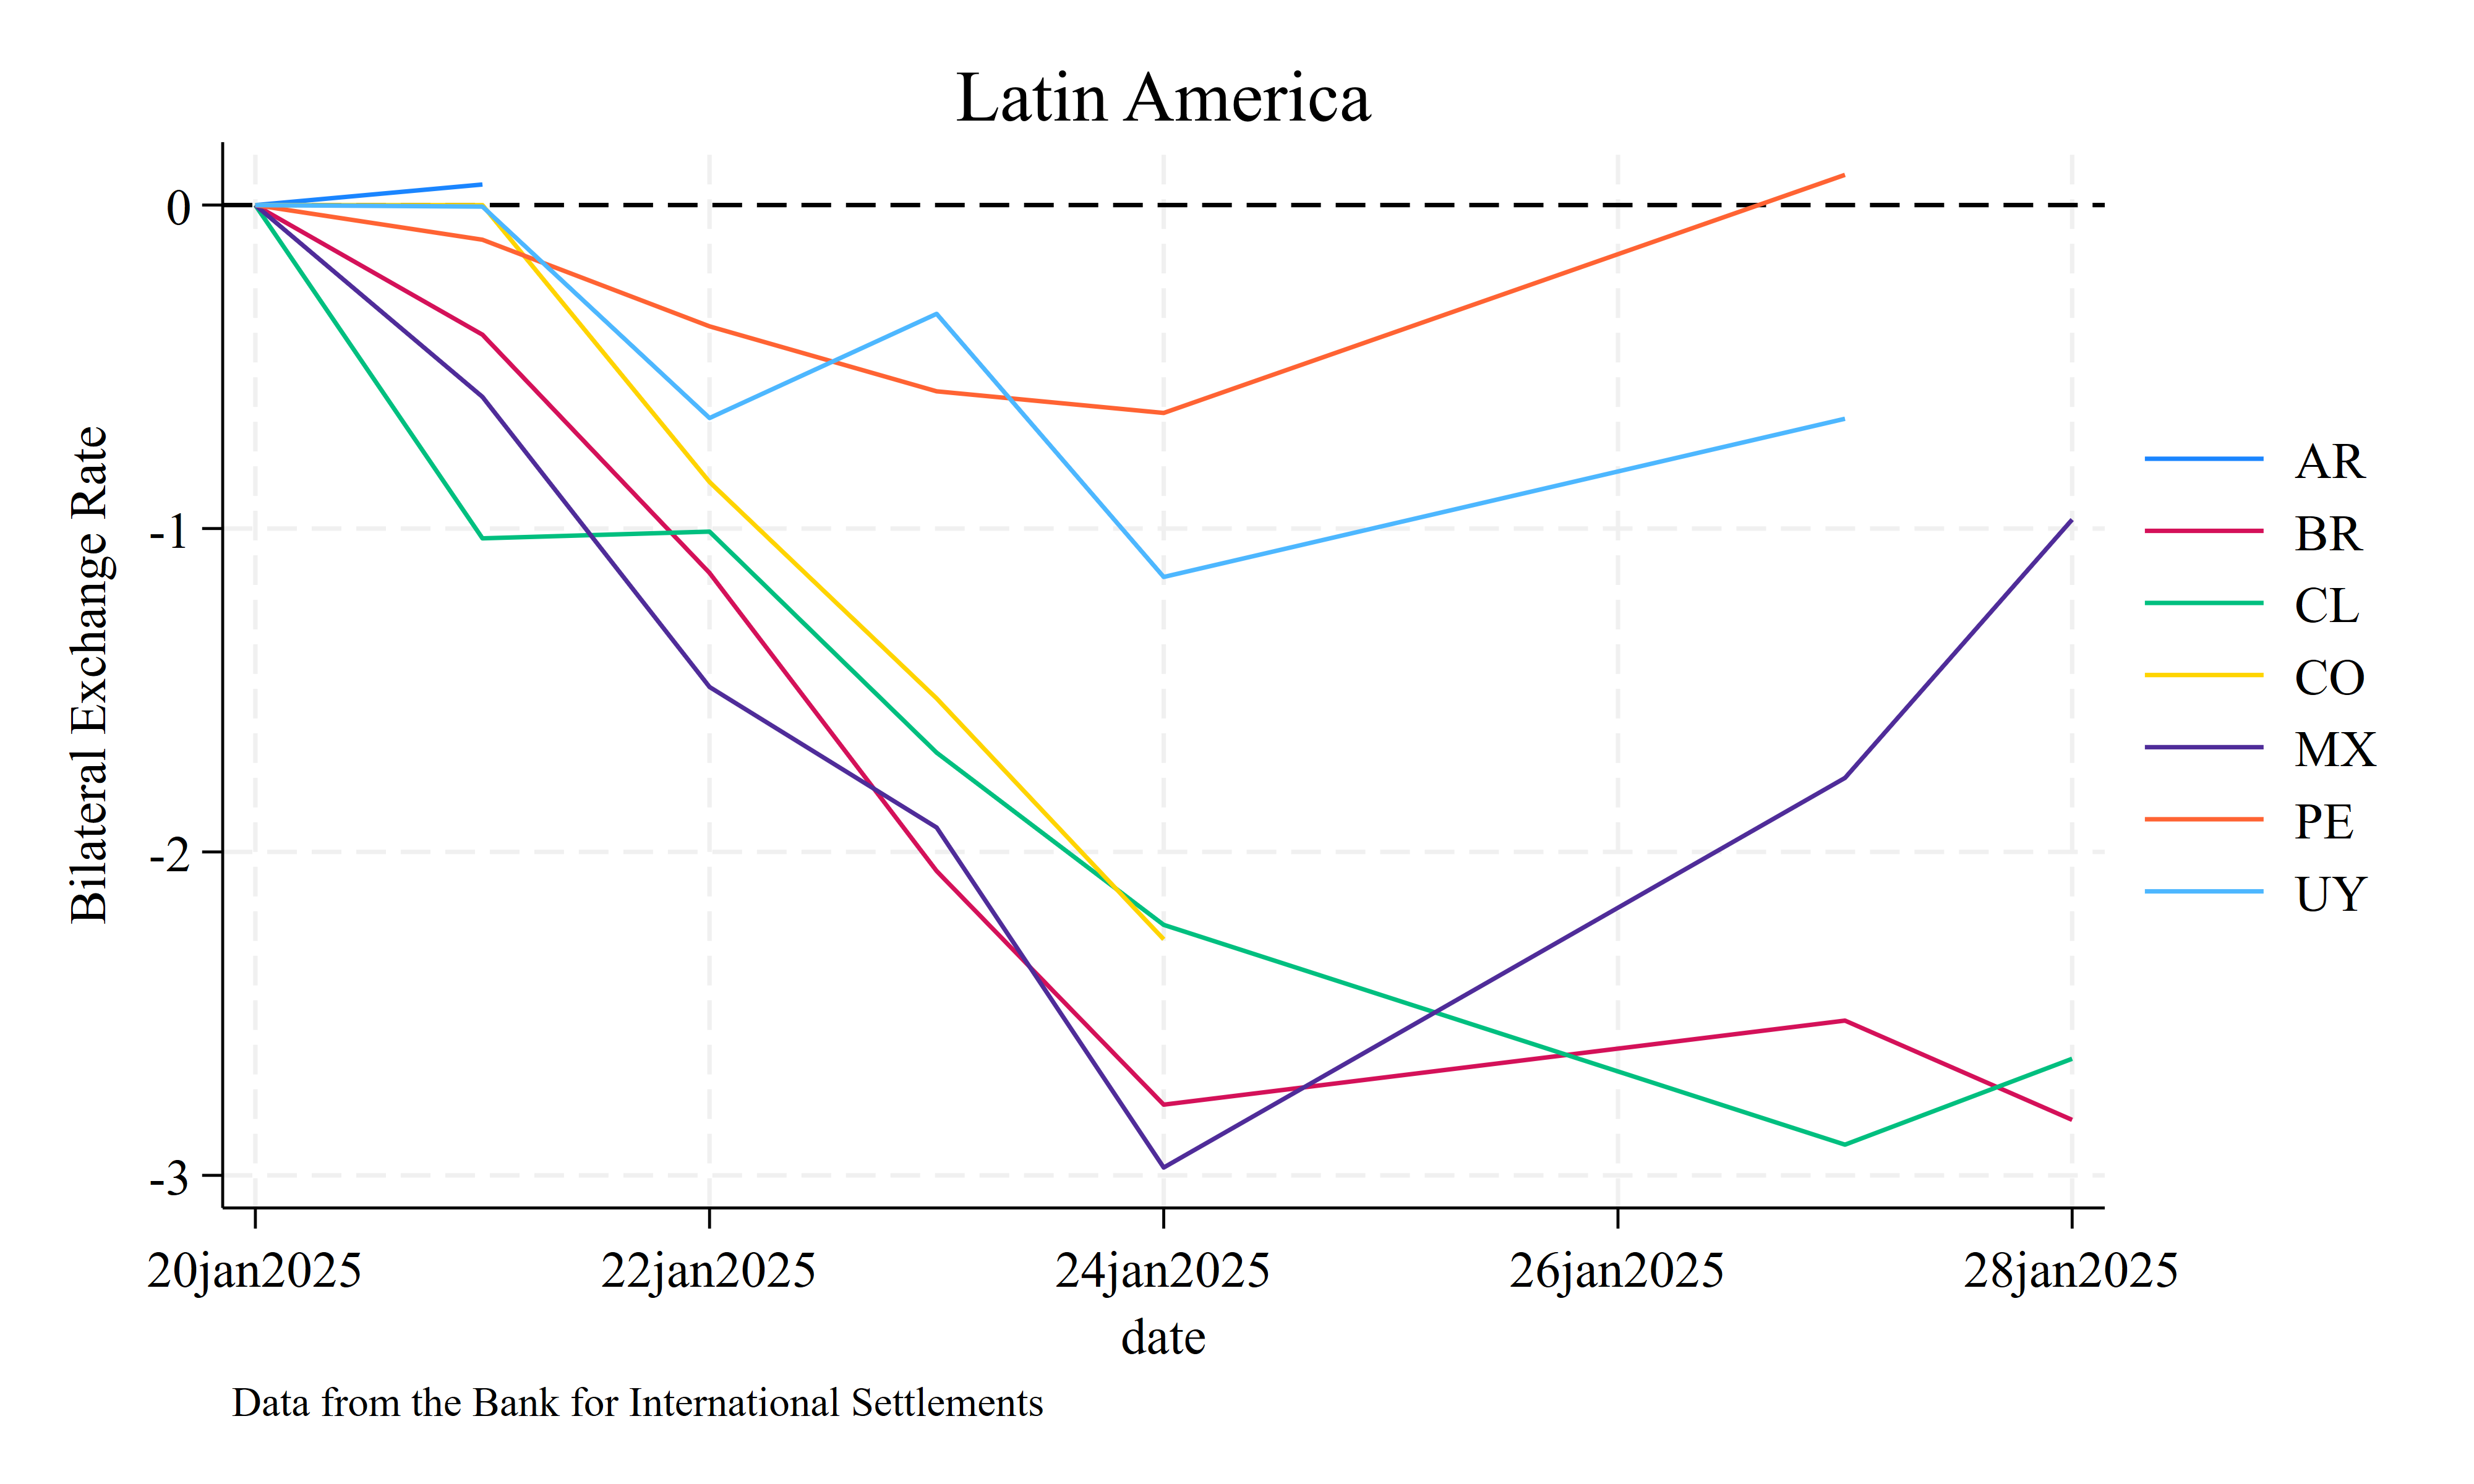
xtline DXR if lac==1 & date>=td(20jan2025) ///
& imfcode!=111 & DXR!=., yline(0) ///
overlay title("Latin America") ///
note("Data from the Bank for International Settlements")
graph rename lac, replace
graph export lac.png, as(png) width(4000) replace
xtline DXR if we==1 & date>=td(20jan2025) ///
& imfcode!=111 & DXR!=., yline(0) ///
overlay title("Western Europe") ///
note("Data from the Bank for International Settlements")
graph rename we, replace
graph export we.png, as(png) width(4000) replace
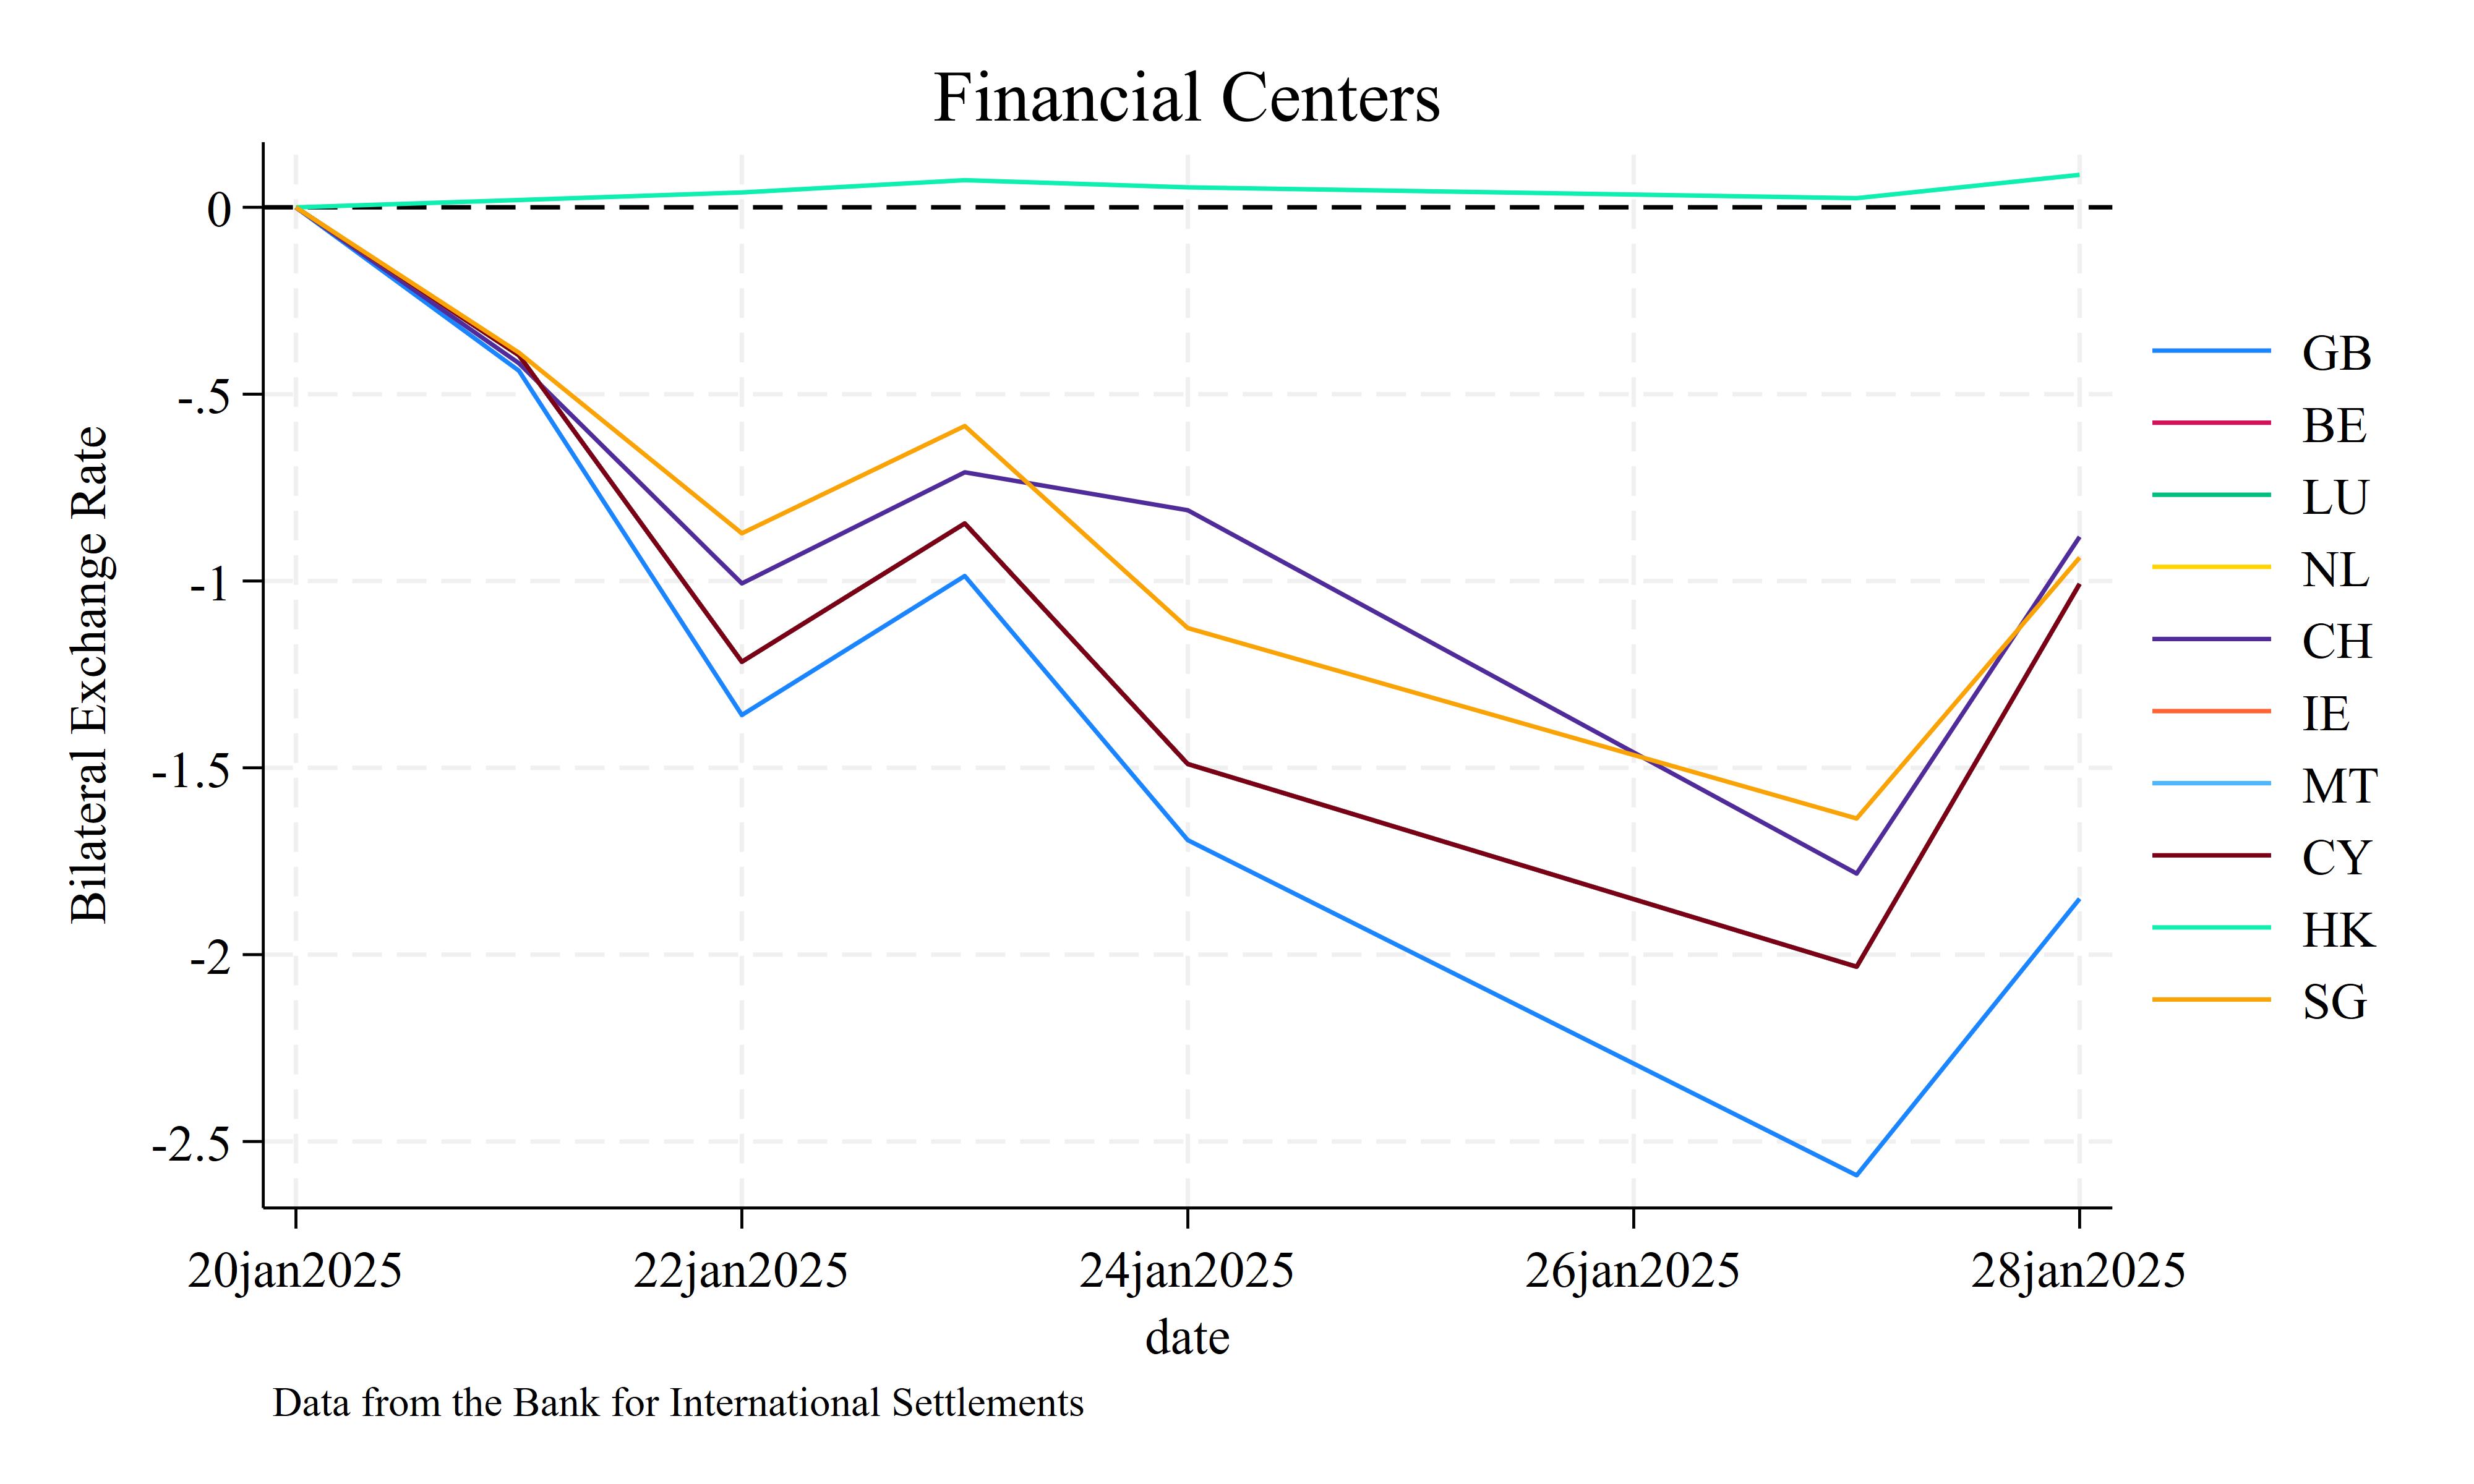
xtline DXR if fc==1 & date>=td(20jan2025) ///
& imfcode!=111 & DXR!=., yline(0) ///
overlay title("Financial Centers") ///
note("Data from the Bank for International Settlements")
graph rename fc, replace
graph export fc.png, as(png) width(4000) replace