It is a capital mistake to theorize before one has data. Insensibly one begins to twist facts to suit theories, instead of theories to suit facts.
Sherlock Holmes.
A Scandal in Bohemia, Sir Arthur Conan Doyle (1891).
After a first blog where I show how to use FRED with Stata (Using FRED with Stata), I will show you hot use FRED with Mathematica. First, you have to connect the database:
fred = ServiceConnect["FederalReserveEconomicData"]You will be asked to use the API key that you can request on the FRED website as explained in my previous blog.
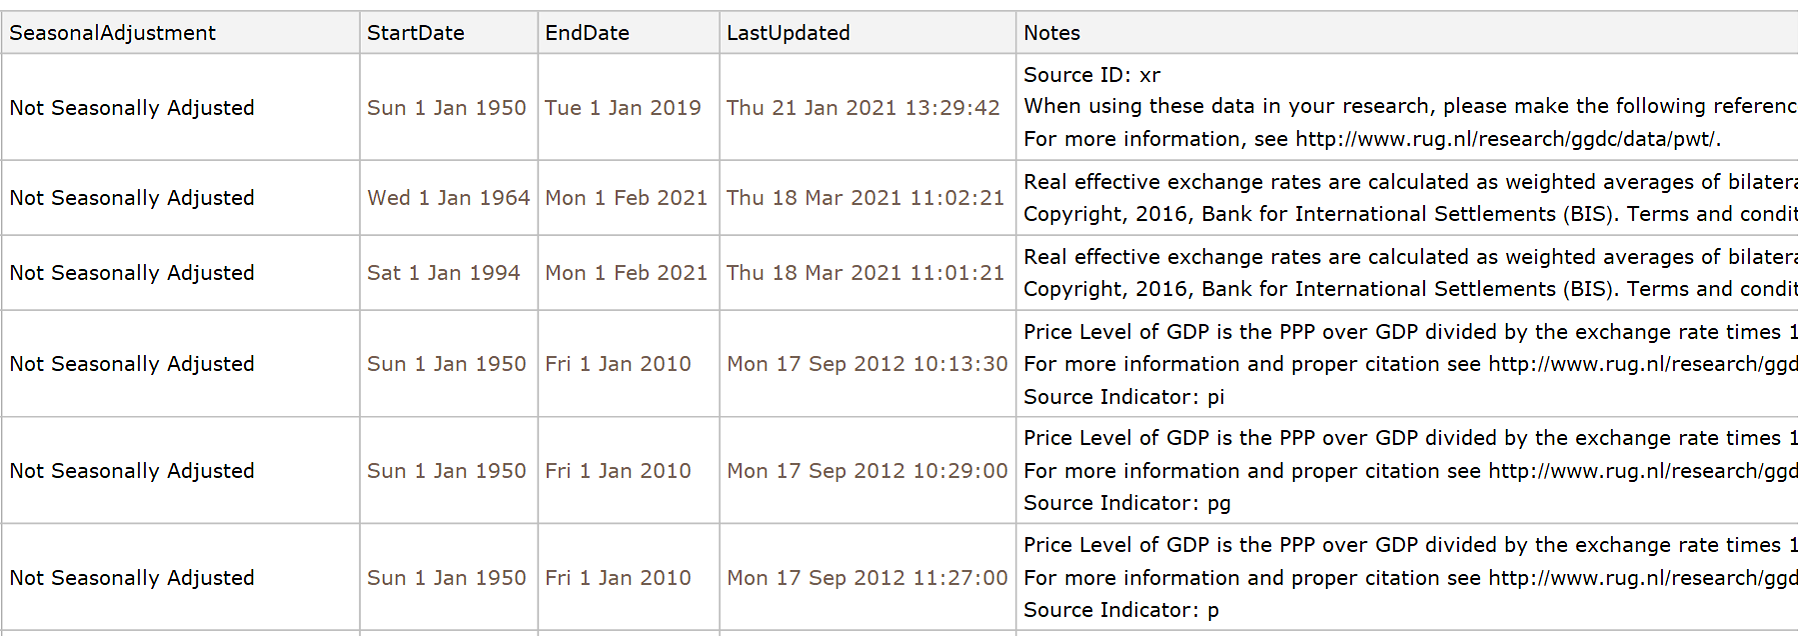
Once the service is connected, we will search data by tipping the following keywords “france exchange rate”. I have 98 results for this request. I show only the first lines:
fred["SeriesSearch", "Query" -> "france exchange rate",
  "SortBy" -> {"SeriesID", "Descending"}]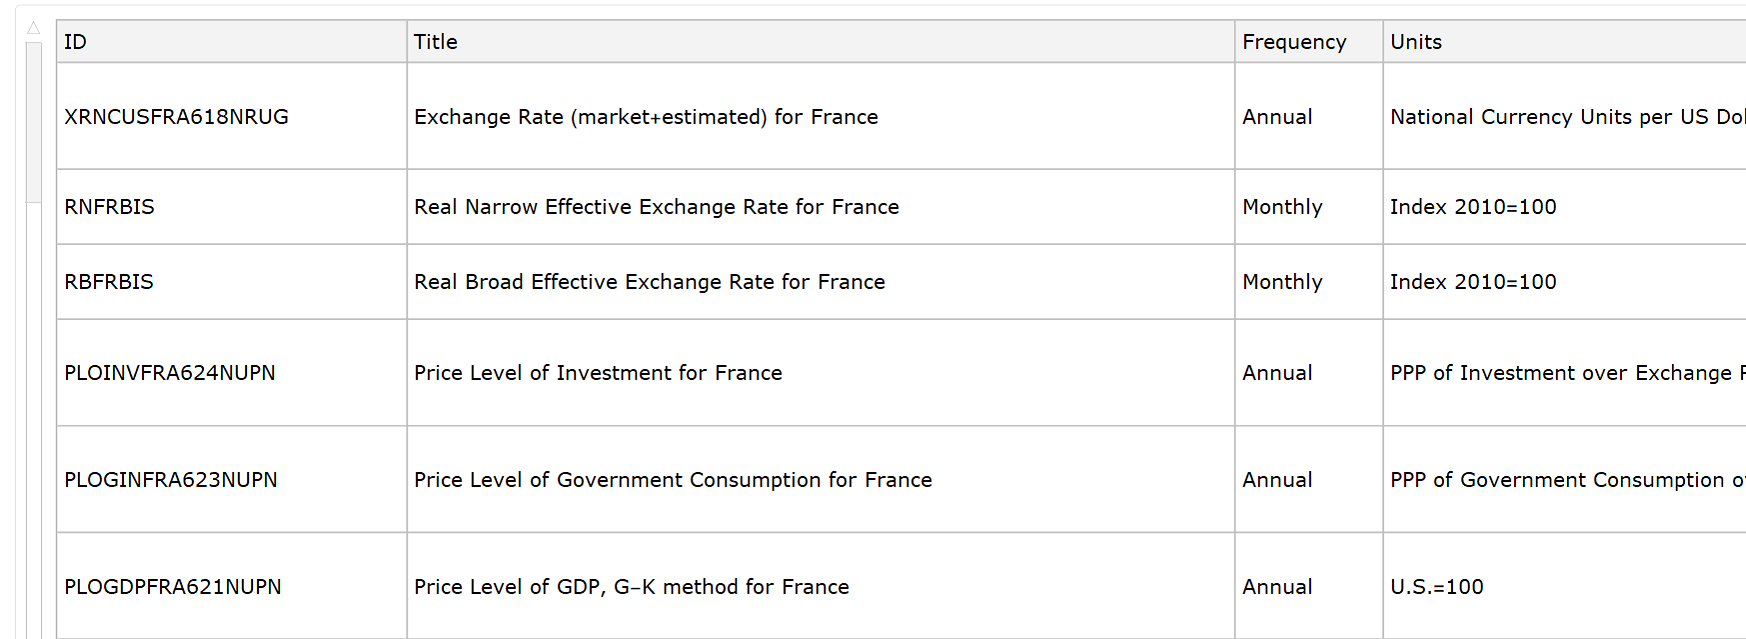
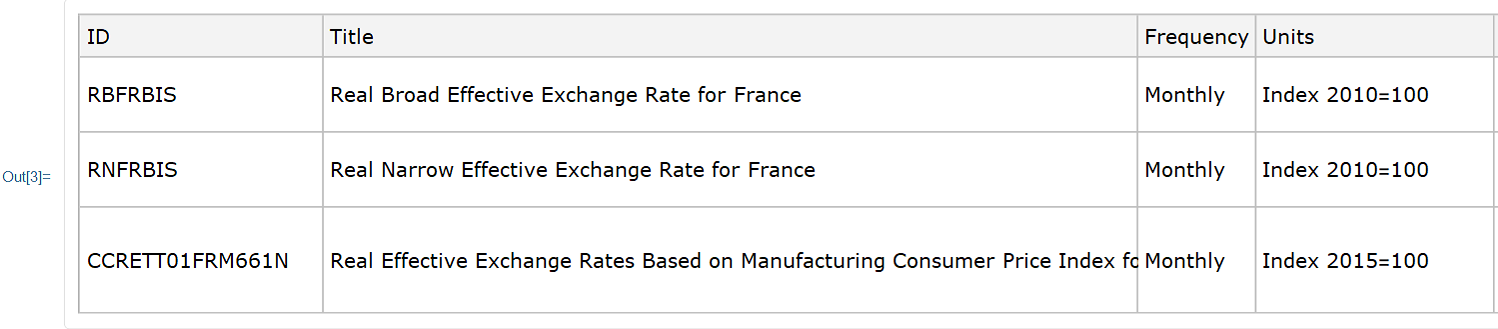
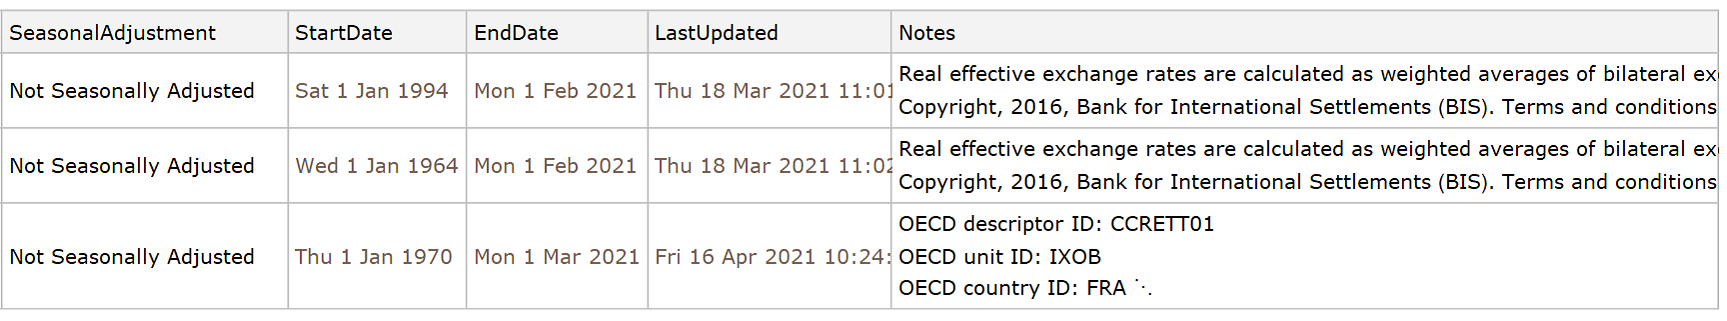
Then, I specify the frequency (Monthly, here) and limit the maximum number of results for readability purposes:
fred["SeriesSearch", "Query" -> "france real effective exchange rate",
  "Frequency" -> "Monthly", MaxItems -> 5]
I obtained the following series from the BIS and the OECD:
Secondly, I declare my data as time series and I store the series:
reerfrance = fred["SeriesData", "ID" -> {"RBFRBIS"}]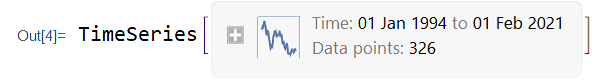
Finally, I reproduce the figure of my previous blog for the real effective exchange rate of France with the following command:
DateListPlot[reerfrance, Filling -> False,
 PlotLabel -> "Real effective exchange rate - France",
 GridLines -> Automatic, PlotStyle -> ColorData[1, 1],
 PlotTheme -> "Scientific", ImageSize -> Large]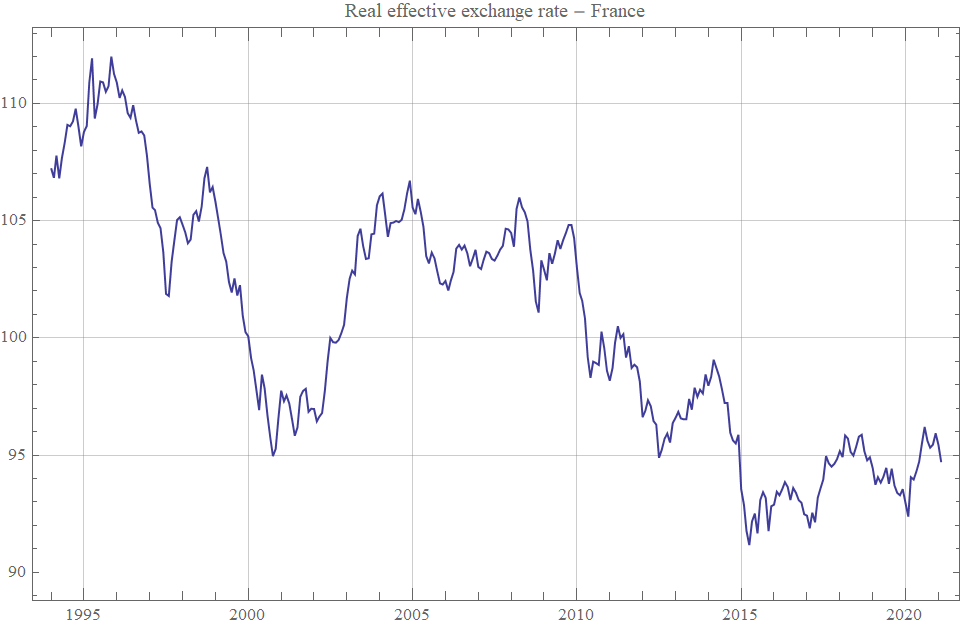
1 Comment
[…] below, I used the FRED connection with Mathematica 13.1, as I explained it in a previous blog: https://www.jamelsaadaoui.com/using-fred-with-mathematica/. The Wolfram documentation is very clear and self-explaining: […]