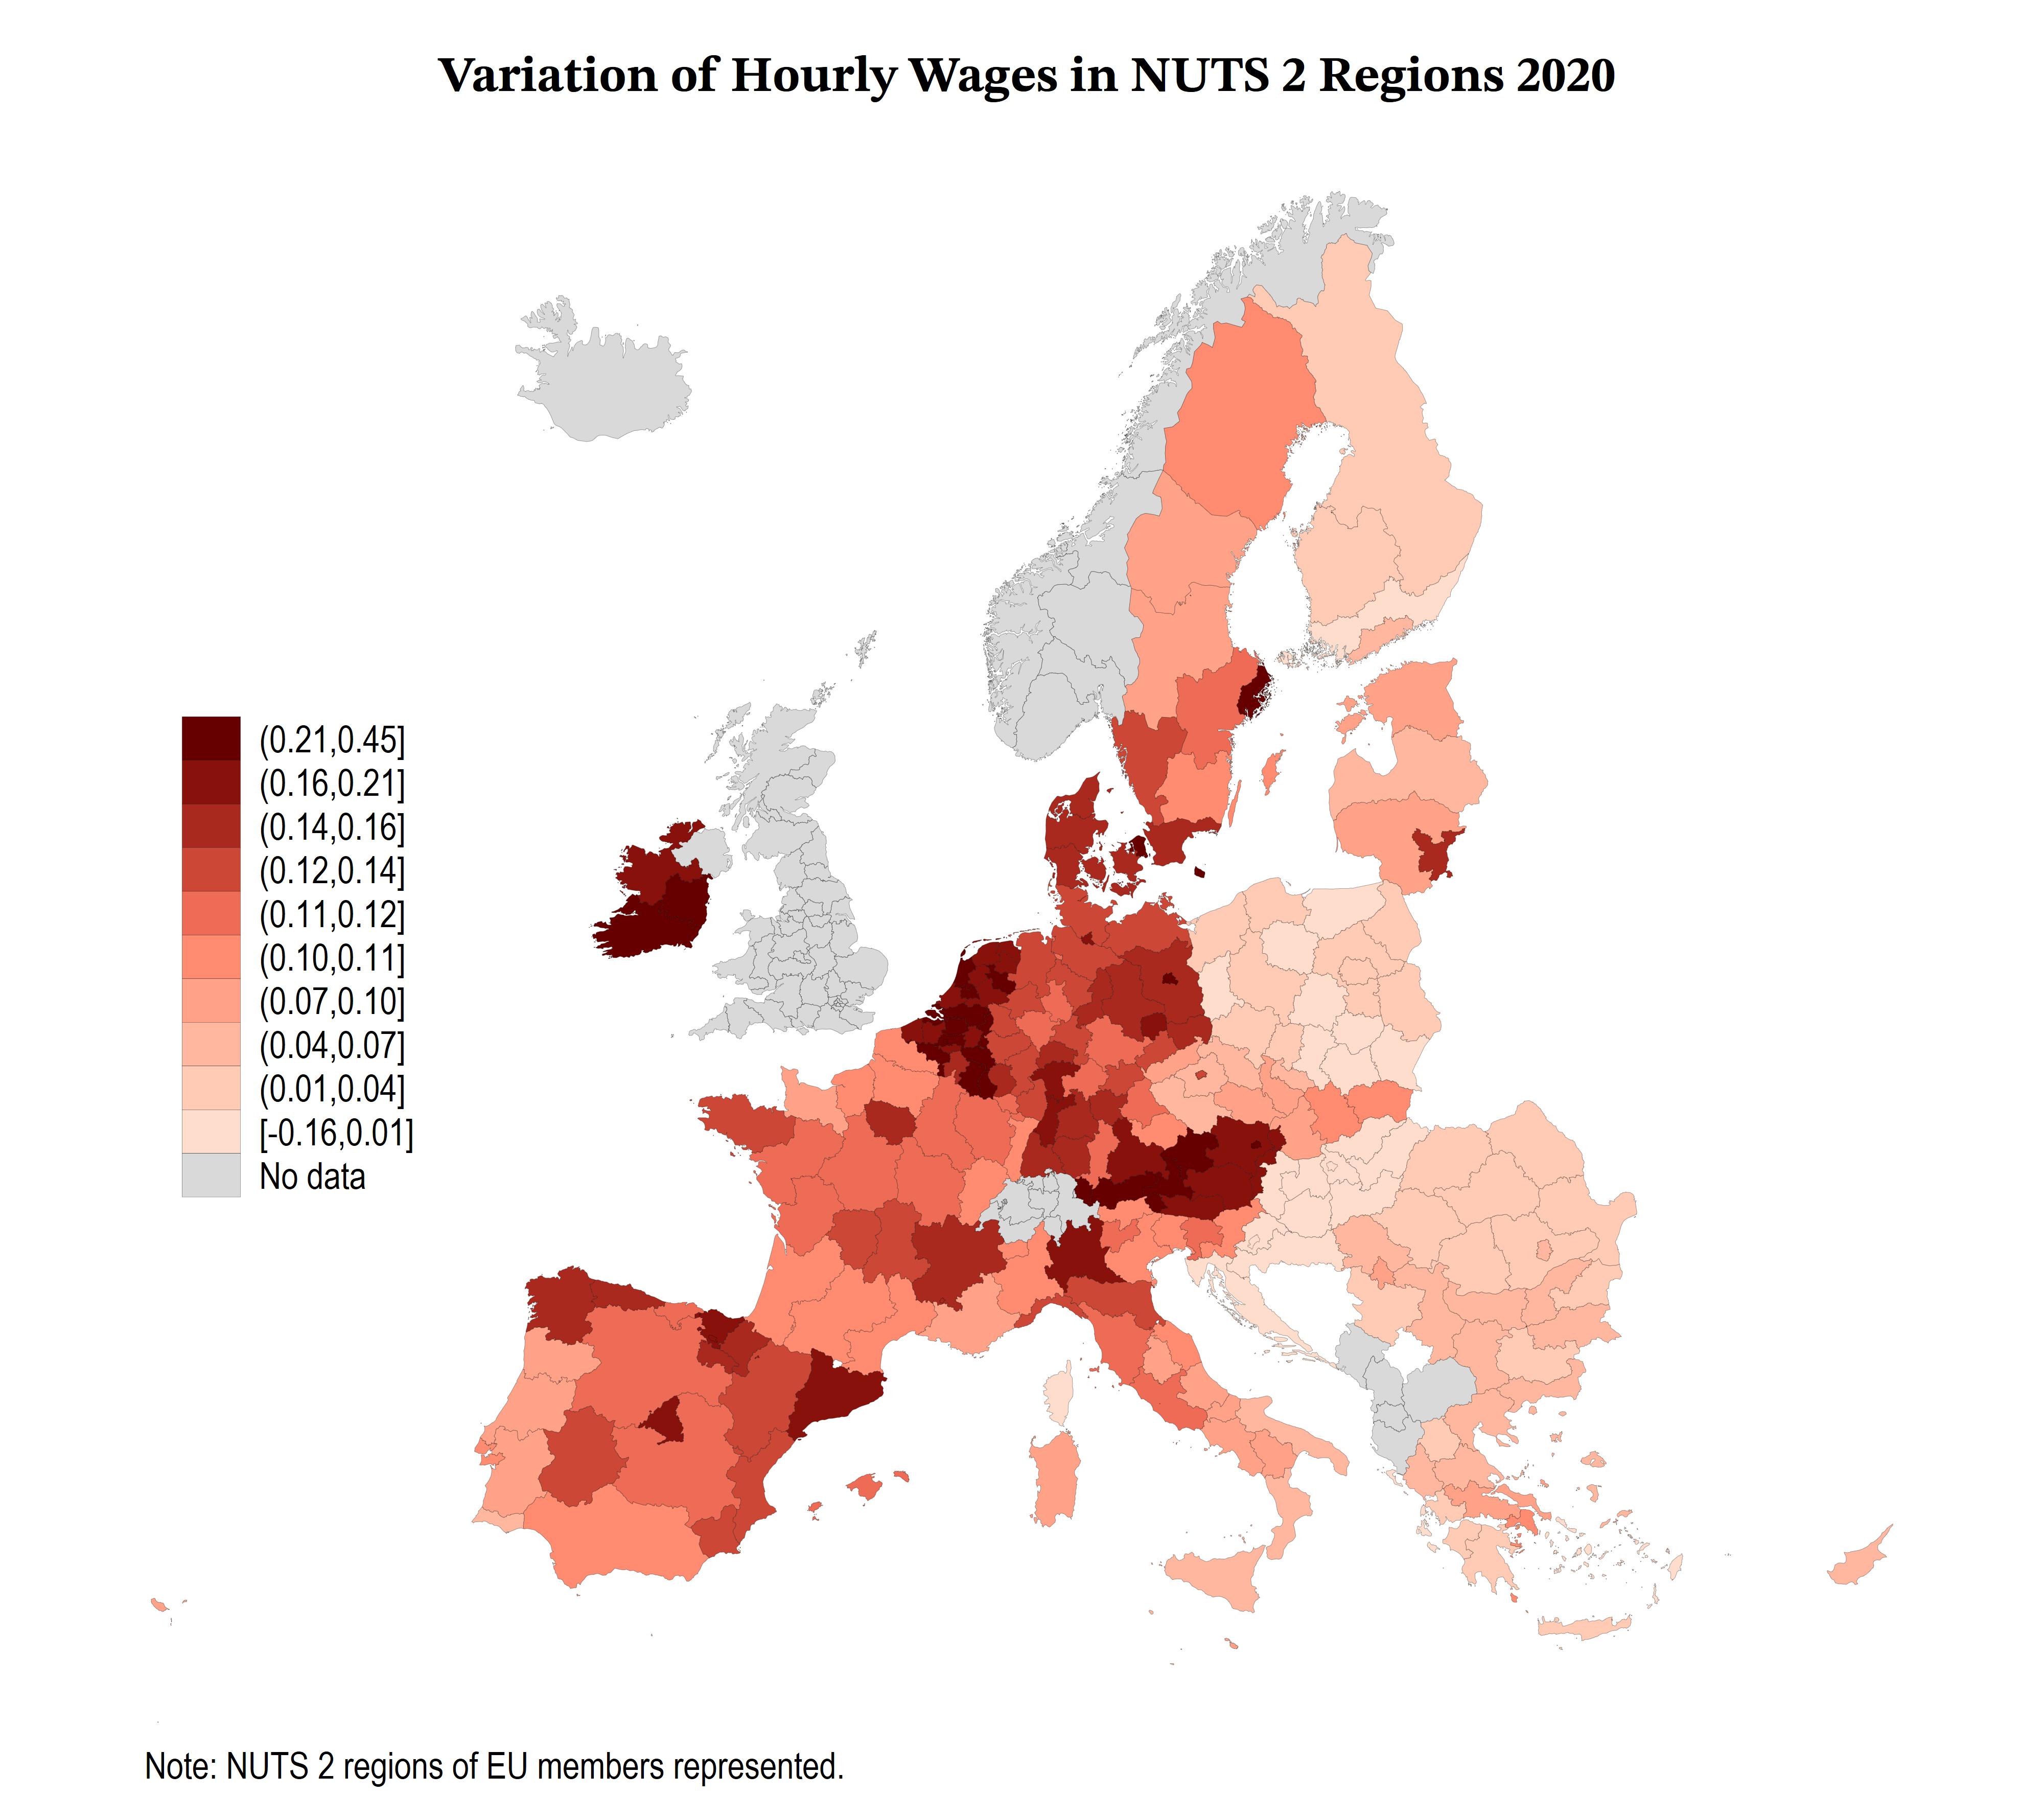
After two blogs on how to draw maps with Stata for the NUTS regions and on how to download data from DBnomics, this time I will show you how to draw maps for the NUTS 2 regions’ hourly wages evolution:
First, use the file with coordinates (NUTS_RG_03M_2021_4326_LEVL_2) to build the nuts2_shp.dta and nuts2.dta files. In the following part of the code, you can rid of some islands:
**# NUTS2 maps

spshape2dta NUTS_RG_03M_2021_4326_LEVL_2, replace saving(nuts2)

use nuts2_shp, clear

drop if _ID==325 // Remove Svalbard
keep _ID _X _Y
keep if _X > -25 & _Y >30 // get rid of the small islands
geo2xy _Y _X, proj (lambert_sphere) replace
sort _ID
save, replace
Then, you have to create NUTS_ID to merge the data:
**# Generate ID for the NUTS 2 regions

use PCurve_NUTS2.dta, clear

capture decode GEO, gen(NUTS_ID)

save PCurve_NUTS2.dta, replace

**# Merge with Maps IDs

use nuts2.dta, clear

foreach v in PCurve_NUTS2 {
		     merge 1:m NUTS_ID using `v'.dta
}

capture gen HourlywageVar100=HourlywageVar*100

format HourlywageVar100 %4.2f
Finally, you can draw the maps:
graph set window fontface "Arial Narrow"

forvalues v = 2001(1)2020 {
	 replace period=`v' if _merge==1
   spmap HourlywageVar100 using nuts2_shp ///
	 if period==`v' & CNTR_CODE!="TR", id(_ID) ///
	 fcolor(Reds2) clnumber(10)  ///
	 os(vvthin ..) ndsize(vvthin) ///
	 ndfcolor(gray%30 ..) ndocolor(black ..) ///
	 legend(pos(9) ring(0)) ///
	 title("{fontface STIX Two Text Bold: Variation of Hourly Wages in NUTS 2 Regions `v'}", margin(medium) position(12) span ///
	  size(small)) ///
	 note("Note: NUTS 2 regions of EU members represented.", ///
	  size(vsmall))

graph rename Graph map`v', replace
*graph export map`v'.png, as(png) width(4000) replace

}

save PCurve_NUTS2_maps.dta, replace

**# End of Program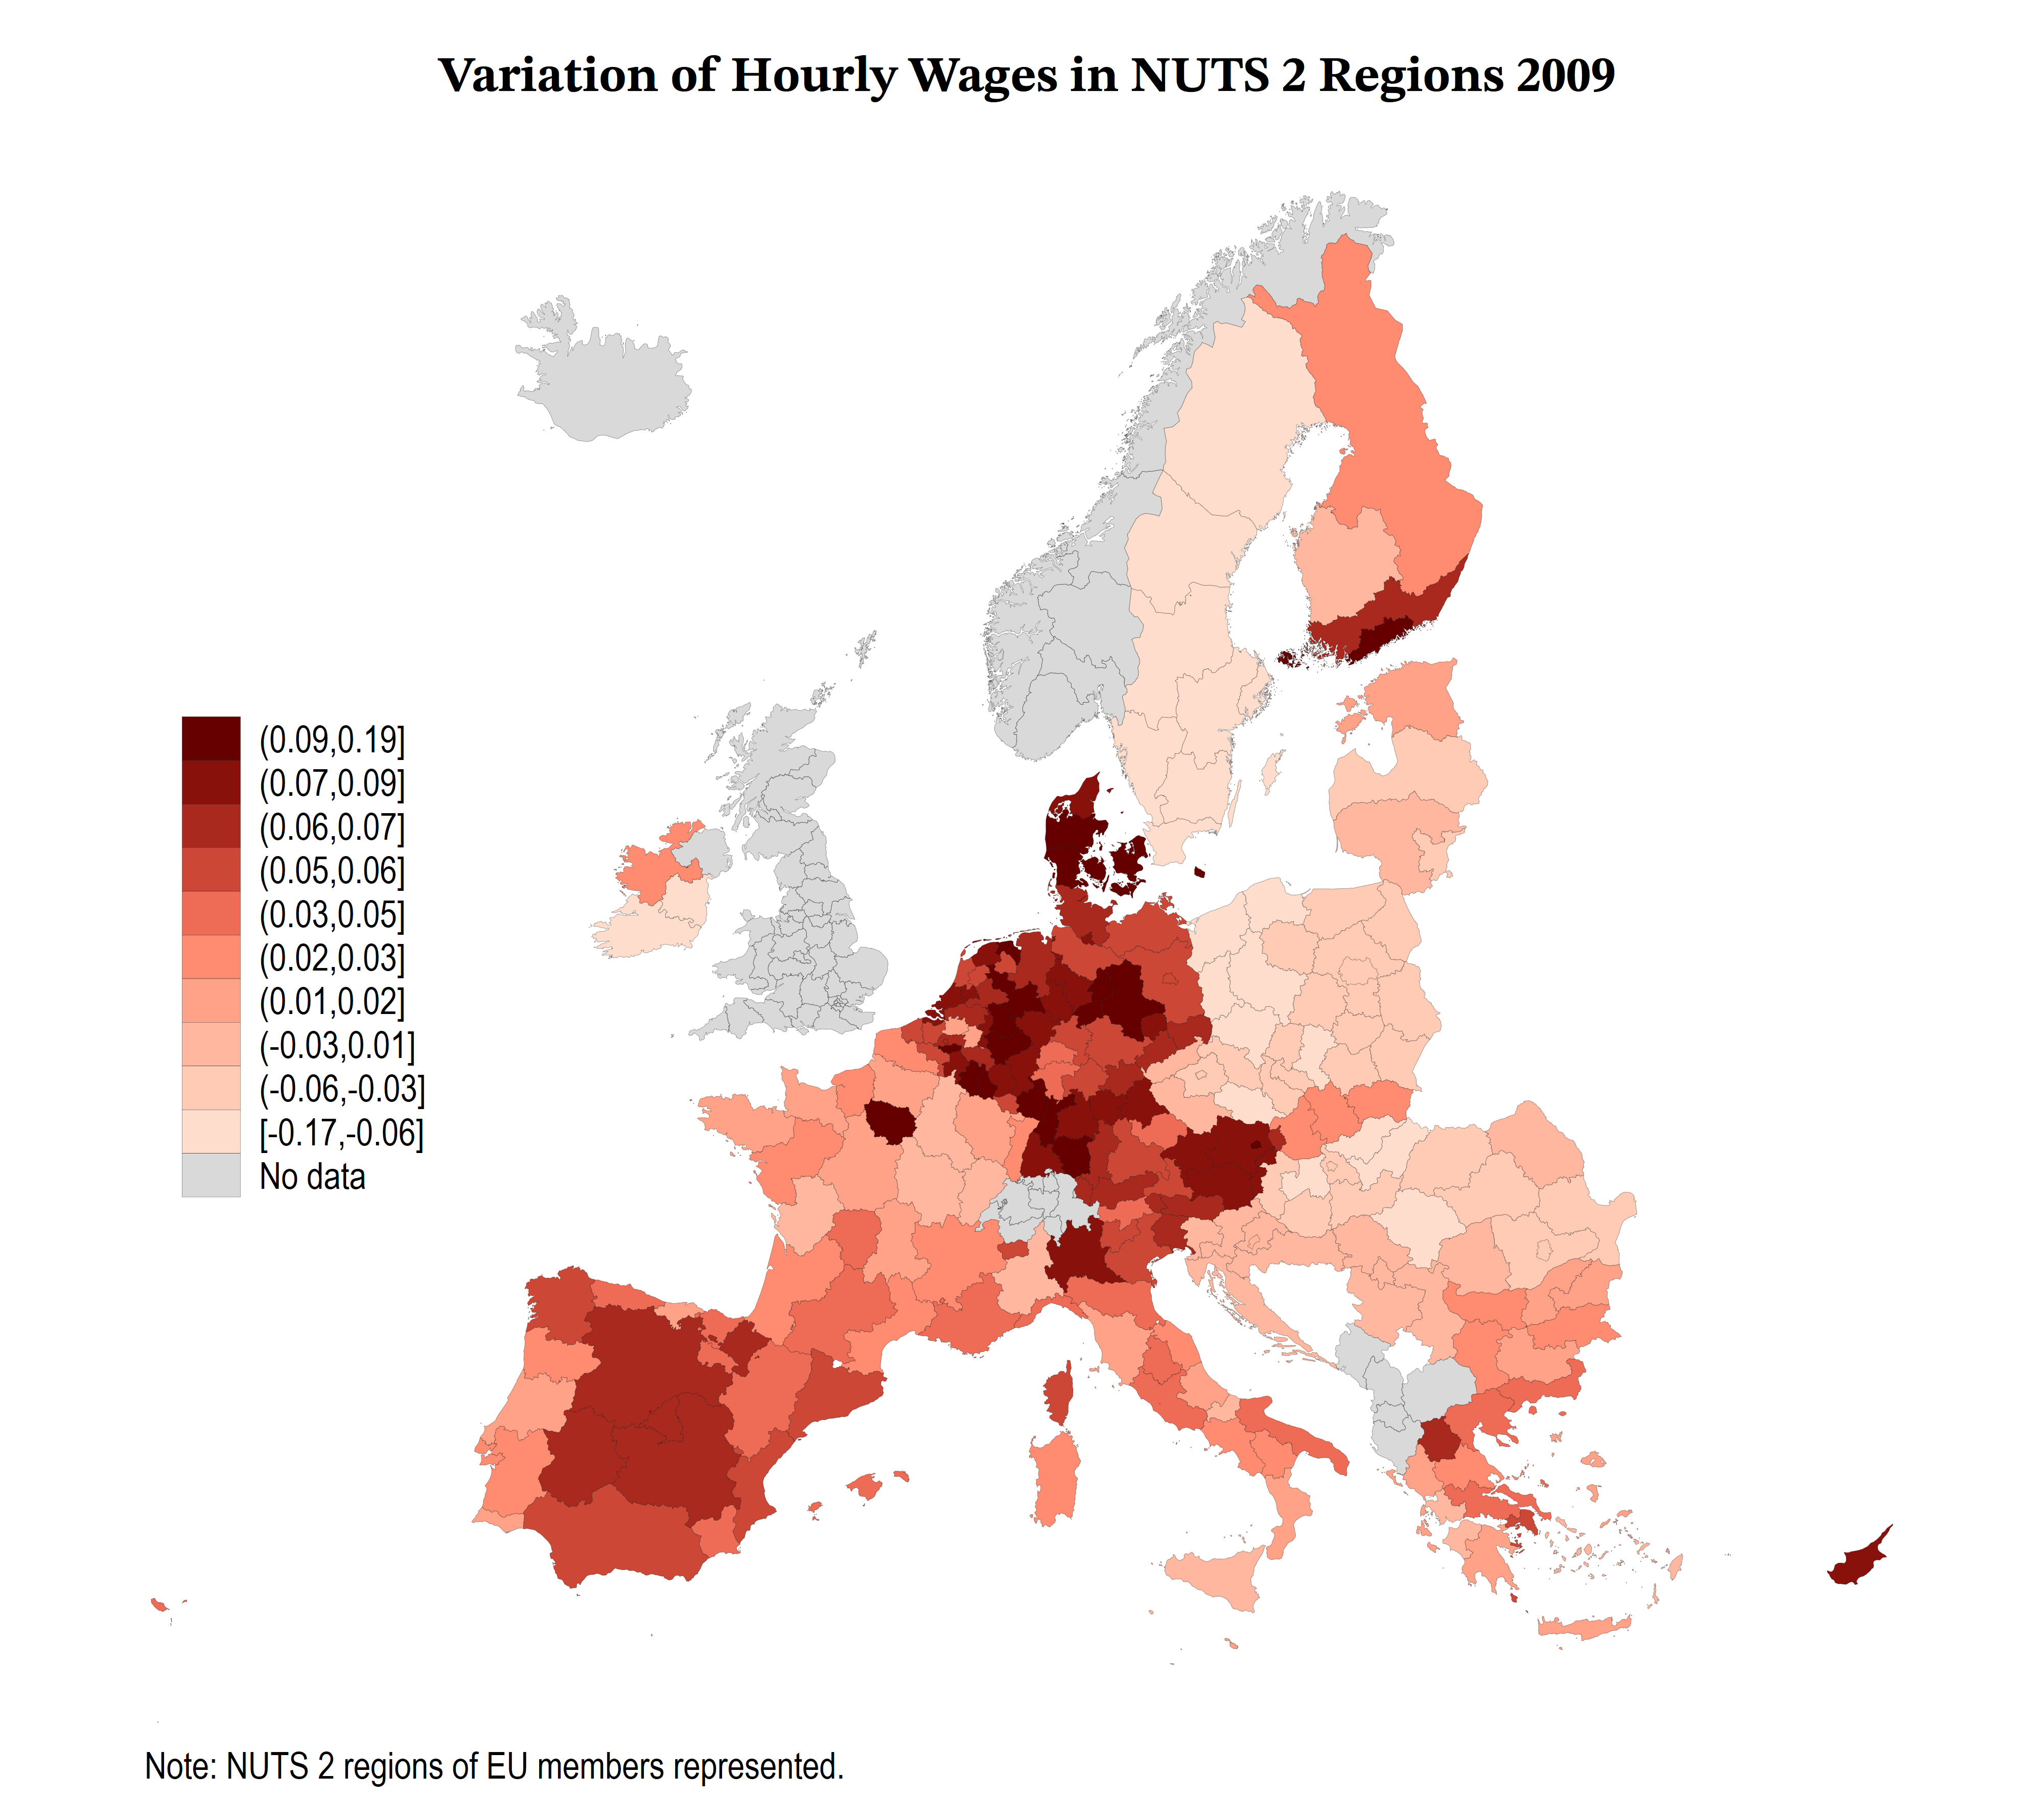
I was inspired by Scott Merryman and Asjad Naqvi:
https://medium.com/the-stata-guide/stata-graphs-get-those-fonts-right-c38d35625142
1 Comment
[…] Drawing maps with Stata for the NUTS regions NUTS Data with DBnomics Drawing maps with Stata for the NUTS regions (Hourly Wages) […]