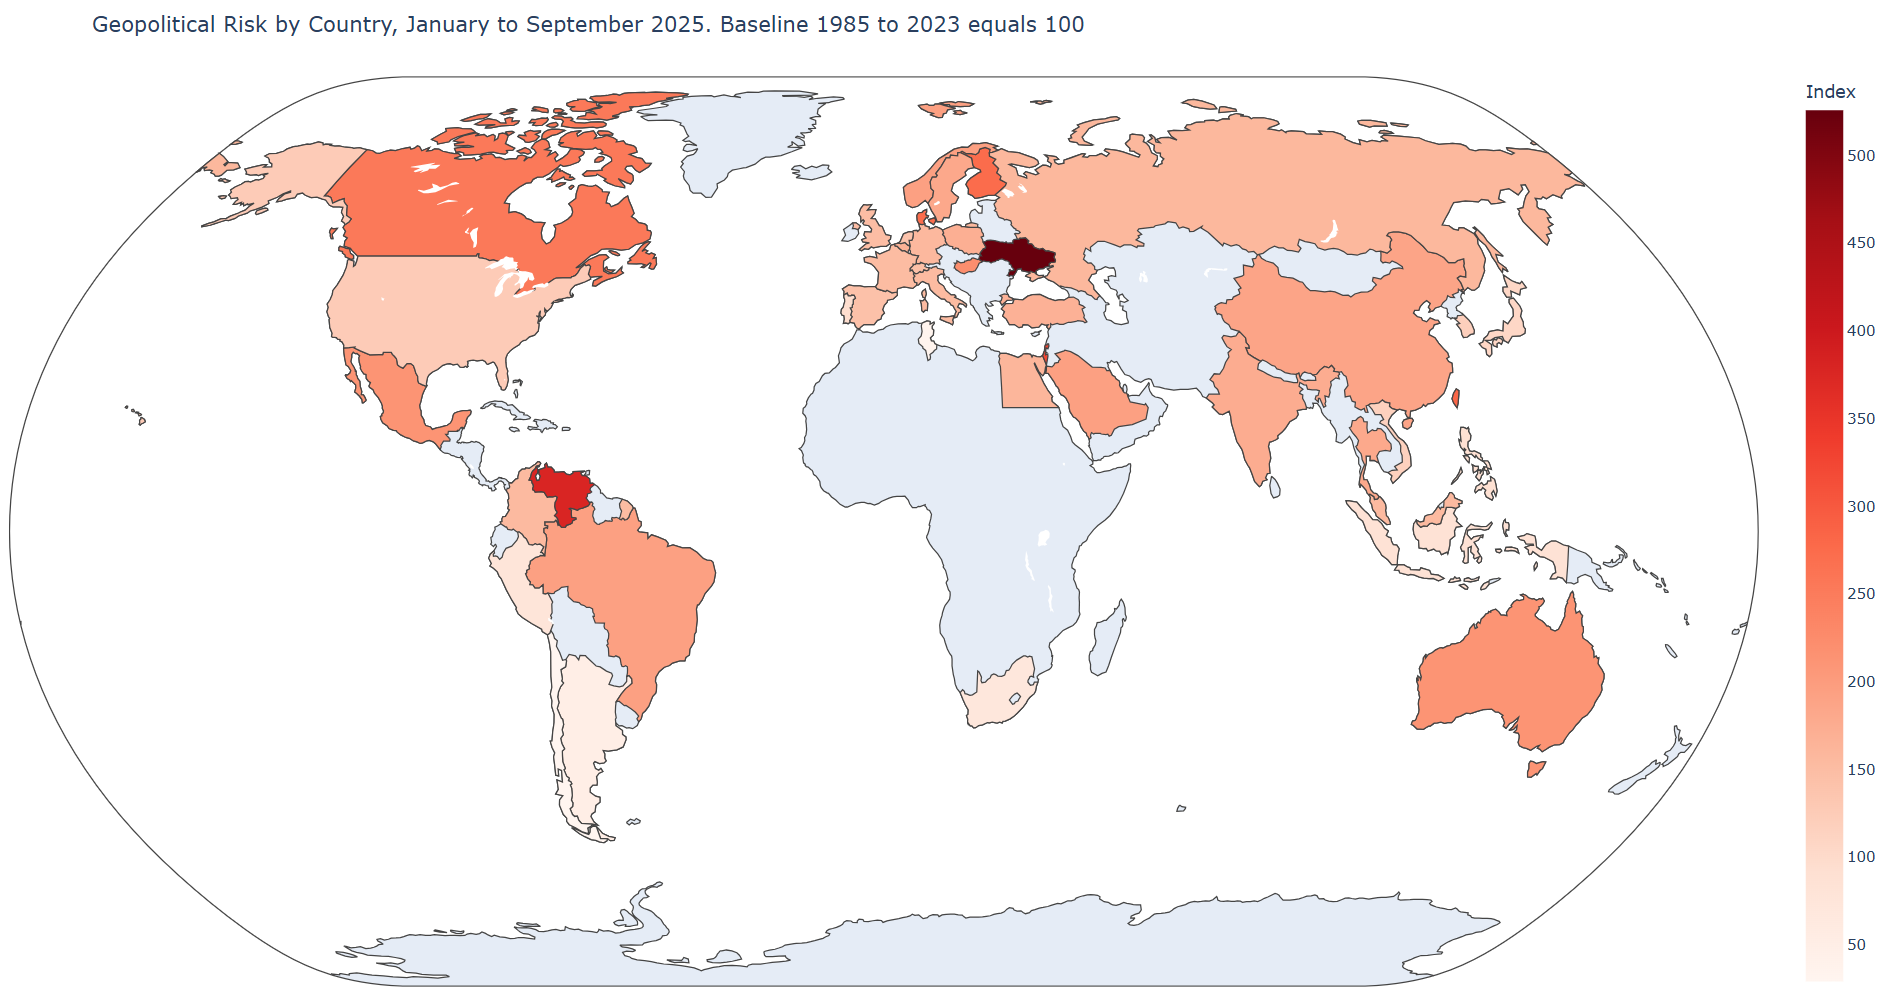
Over the past few years, geopolitical tensions have become one of the main macroeconomic risks facing the global economy. To track these developments more systematically, I recently produced a world map that illustrates country-specific geopolitical risk as of September 2025, rebased to the 1985–2023 historical average ( = 100 ).
Key Takeaways
- Global geopolitical risk remains structurally high.
The average level of geopolitical risk during January–September 2025 is around 40–60 percent higher than its long-term historical mean (1985–2023). - Regional heterogeneity is striking.
The index peaks in Eastern Europe and the Middle East, where ongoing conflicts and political instability persist, while it remains moderate in most advanced economies. - The macroeconomic consequences are stagflationary.
Elevated geopolitical risk tends to depress output and investment while raising commodity prices and inflation through supply-chain and energy-market disruptions. - Fiscal and external vulnerabilities amplify the effects.
Countries with weaker institutions, higher debt ratios, or limited financial depth experience larger increases in sovereign spreads and bond yields. - Quantitative measurement supports macro-financial modeling.
Normalizing geopolitical risk relative to its historical mean provides a coherent way to integrate these shocks into VARs, local projections, or state-dependent frameworks. - Next step: linking with other structural risks.
Combining geopolitical risk with indicators of climate vulnerability, financial development, and institutional resilience will help assess how multiple forms of uncertainty interact in shaping the global economic cycle.
1. Data and methodology
The analysis relies on monthly Geopolitical Risk (GPR) data derived from the frequency of newspaper articles referencing geopolitical tensions, conflict, and war-related terms. The data cover about 45 countries from January 1900 to September 2025.
Using a simple but informative normalization:
\text{Index}_{i,\,2025} =
\frac{\overline{\mathrm{GPR}_{i,\,\text{Jan–Sep}\,2025}}}
{\overline{\mathrm{GPR}_{i,\,1985–2023}}} \times 100
I compute a country-level index that compares the average level of geopolitical risk in 2025 with its long-run historical mean. An index above 100 implies higher-than-usual tensions, while an index below 100 suggests a relatively calm environment by historical standards.
All computations are performed directly in Jupyter Notebook (Python) using pandas and plotly. The map is interactive and updates automatically when new monthly data are added.
fig = px.choropleth(
    index_df,
    locations="iso_a3",
    color="Index",
    color_continuous_scale="Reds",
    projection="natural earth",
    title="Geopolitical Risk by Country, Jan–Sep 2025 (Baseline 1985–2023 = 100)"
)
fig.show()
Full code
import pandas as pd
import plotly.express as px
import plotly.io as pio
from pathlib import Path
import threading, webbrowser, http.server, socketserver

# 1. Load and prepare data
path_xlsx = Path(r"C:/Users/jamel/Dropbox/Latex/PROJECTS/25-09-skema-data-analytics-geopolitics/data/data.xlsx")
df = pd.read_excel(path_xlsx, sheet_name="Feuil1")
df = df.drop(columns=[c for c in df.columns if "Unnamed" in c])
df["Time"] = pd.to_datetime(df["Time"])

baseline = df[(df["Time"] >= "1985-01-01") & (df["Time"] <= "2023-12-01")]
target   = df[(df["Time"] >= "2025-01-01") & (df["Time"] <= "2025-09-01")]

iso_cols = [c for c in df.columns if c != "Time"]
baseline_mean = baseline[iso_cols].mean(axis=0, skipna=True)
target_mean   = target[iso_cols].mean(axis=0, skipna=True)

index_vals = (target_mean / baseline_mean) * 100
index_df = index_vals.rename("Index").reset_index().rename(columns={"index": "iso_a3"})

# 2. Build the map
fig = px.choropleth(
    index_df,
    locations="iso_a3",
    color="Index",
    color_continuous_scale="Reds",
    projection="natural earth",
    title="Geopolitical Risk by Country, January to September 2025. Baseline 1985 to 2023 equals 100"
)
fig.update_layout(margin=dict(l=10, r=10, t=60, b=10))

# 3. Show inside Jupyter  this never hits your browser security model
fig.show()

# 4. Save a self contained HTML  no external fetches required
out_dir = path_xlsx.parent
out_html = out_dir / "gpr_map_2025.html"
fig.write_html(out_html, include_plotlyjs="inline", full_html=True)
print(f"Saved HTML to: {out_html}")

# 5. Optional. Serve the same folder over localhost to avoid file URL restrictions
#    Then open the HTML in your default browser
PORT = 8000
Handler = http.server.SimpleHTTPRequestHandler
httpd = socketserver.TCPServer(("127.0.0.1", PORT), Handler)

def run_server():
    import os
    os.chdir(out_dir)
    httpd.serve_forever()

thread = threading.Thread(target=run_server, daemon=True)
thread.start()

url = f"http://127.0.0.1:{PORT}/{out_html.name}"
print(f"Open in browser: {url}")
webbrowser.open(url)
2. Main results
The resulting map highlights three key developments:
- Persistent stress in Eastern Europe. Geopolitical risk remains extremely elevated for Ukraine, Russia, and neighboring countries. The regional spillovers of the ongoing war continue to weigh on both economic confidence and energy markets.
- Renewed tensions in parts of the Middle East and South Asia, reflecting conflicts and domestic instability.
- A moderate but broad-based rise in geopolitical risk across advanced economies, reflecting uncertainty around global trade, technology, and defense realignments.
Overall, the world average GPR level between January and September 2025 stands roughly 40–60 percent above the long-term historical mean. This persistence underscores that the global economy is now operating under a structurally higher level of geopolitical uncertainty.
3. Implications for macroeconomics
Why does this matter for economists? Elevated geopolitical risk typically acts as a stagflationary shock—it tends to reduce investment and output while putting upward pressure on commodity prices and inflation. The transmission channels include trade disruptions, supply bottlenecks, financial risk repricing, and precautionary savings behavior.
In my recent research, we integrate such indices into econometric frameworks—such as Structural VARs and Local Projections—to estimate their dynamic macro-financial effects. The results consistently point to:
- A decline in output and investment after geopolitical shocks,
- Rising commodity prices and inflation,
- A deterioration in fiscal and external positions for vulnerable economies.
4. Looking ahead
The next step is to extend this map to a panel-VAR-compatible dataset, allowing researchers and policy institutions to analyze how country-specific shocks propagate across borders. Combining the GPR index with climate vulnerability, financial development, and institutional strength could provide a unified framework for quantifying macro-risk exposure in an era of heightened fragmentation.
Conclusion
The global economy is entering a period characterized by persistently high geopolitical risk and increasing structural uncertainty. The evidence presented in the map and the accompanying index suggests that geopolitical tensions have not only become more frequent but also more globally synchronized. This persistent elevation in risk levels signals a potential shift in the baseline volatility of the world economy.
From a macroeconomic standpoint, understanding the spatial and temporal dynamics of geopolitical shocks is crucial for both policymakers and investors. Such shocks alter the transmission of monetary and fiscal policy, influence cross-border capital flows, and reshape expectations about long-term growth and inflation. Quantifying these effects through data-driven tools—such as the country-level geopolitical risk index presented here—provides a necessary empirical foundation for anticipating how international fragmentation may affect macro-financial stability.
The next step will involve integrating this geopolitical risk index into panel-based and time-varying econometric models, thereby allowing for a more systematic evaluation of how shocks propagate across countries. This approach will contribute to a better understanding of the intersection between geopolitics and macroeconomics, an increasingly central theme in global policy debates.
Further reading
Caldara, D., & Iacoviello, M. (2022). Measuring geopolitical risk. American Economic Review, 112(4), 1194-1225. https://www.aeaweb.org/articles?id=10.1257/aer.20191823
Mignon, V., & Saadaoui, J. (2024). How do political tensions and geopolitical risks impact oil prices? Energy Economics, 129, 107219. https://doi.org/10.1016/j.eneco.2023.107219
1 Comment
[…] Drawing an Interactive Map for the Geopolitical Risks with Jupyter […]