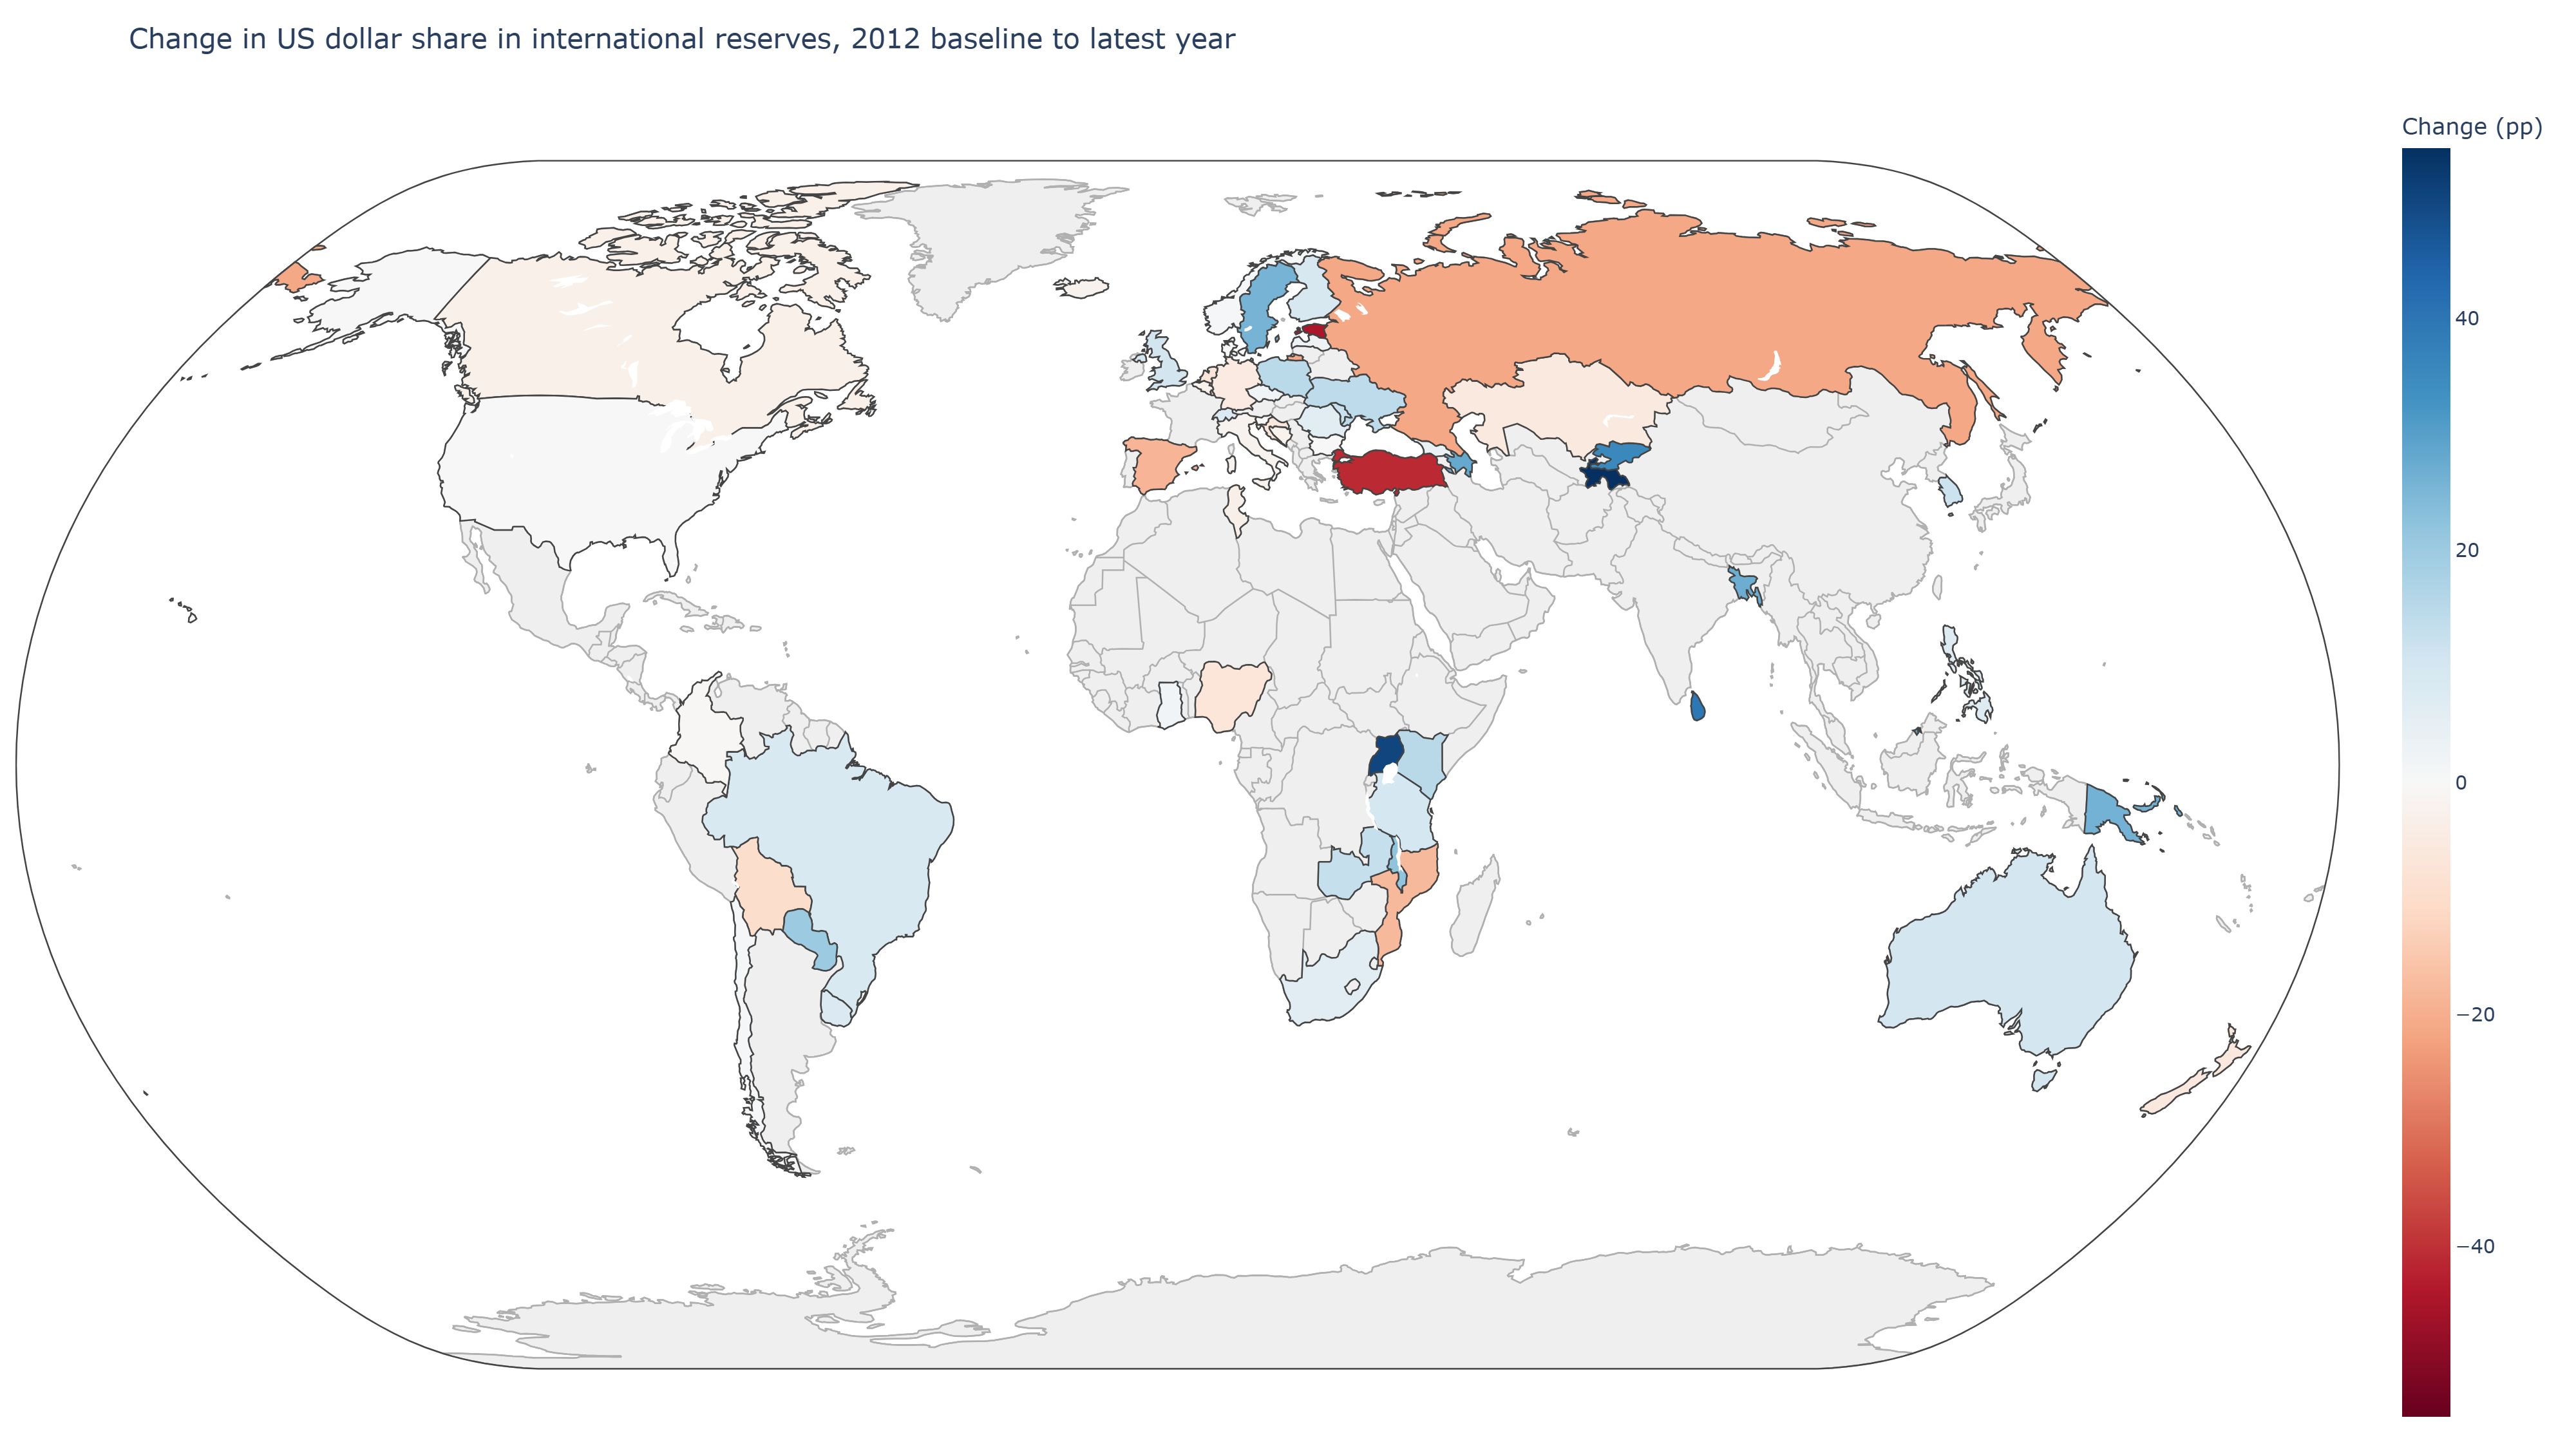
How do the shares of the USD reserves in total reserves since 2012? The map reveals a divergent adjustment in reserve currency composition since 2012. The US dollar’s share has remained broadly stable across most advanced economies, but significant regional variations are visible:
- Increases (blue shades) appear mainly among a few commodity exporters and emerging markets in Africa and Oceania, reflecting a return to dollar-denominated assets amid external vulnerability or stronger trade links with dollar areas.
- Declines (red shades) are concentrated in Eurasia and Latin America, where several central banks have diversified toward the euro, the renminbi, or gold.
- The overall pattern points to slow-moving de-dollarization, driven more by gradual portfolio rebalancing than by abrupt shifts in monetary strategy.
Despite these regional reallocations, the US dollar retains its central role as the dominant reserve currency, supported by deep liquidity in US Treasury markets and its unparalleled status as a global transaction medium. The recent diversification mainly reflects hedging motives and risk management, rather than a structural challenge to dollar dominance.
This the second post on the Chiṭu-Eichengreen-Mehl Global Currencies Database (CEMGCD), I made a first post on it:
Besides, I relied on a previous post on geopolitical risks to make the map:
Full code for pedagogical purposes:
import plotly.express as px
import plotly.io as pio
from pathlib import Path
import pandas as pd

# change_df must already exist with columns: iso_a3, Change_pp, Country, ISO2, IFS, BaselineYear, LatestYear, BaselineValue, LatestValue

# renderer for inline display
try:
    pio.renderers.default = "notebook_connected"
except Exception:
    pio.renderers.default = "plotly_mimetype"

# symmetric color limits
v = change_df["Change_pp"].dropna()
vmax = float(v.abs().max()) if not v.empty else 1.0

fig = px.choropleth(
    change_df,
    locations="iso_a3",
    color="Change_pp",
    color_continuous_scale="RdBu",
    range_color=(-vmax, vmax),
    projection="natural earth",
    title="Change in US dollar share in international reserves, 2012 baseline to latest year",
    hover_name="Country",
    hover_data={
        "ISO2": True,
        "IFS": True,
        "BaselineYear": True,
        "LatestYear": True,
        "BaselineValue": ':.2f',
        "LatestValue": ':.2f',
        "Change_pp": ':.2f'
    }
)

# lighter grey background and clearer borders
fig.update_geos(
    showcountries=True,
    showcoastlines=True,
    showland=True,
    landcolor="#EFEFEF",        # lighter grey
    countrycolor="#B0B0B0",
    coastlinecolor="#B0B0B0"
)

fig.update_layout(
    margin=dict(l=10, r=10, t=60, b=10),
    coloraxis_colorbar=dict(title="Change (pp)")
)

# save a self-contained HTML
out_html = Path(r"C:\Users\jamel\Dropbox\Currency_Database\usd_share_change_from2012.html")
fig.write_html(out_html, include_plotlyjs="inline", full_html=True)
print(f"HTML saved to: {out_html}")