A strong dollar creates uneven pressures across economies. During the 2021–22 U.S. monetary tightening cycle, countries that entered the episode with larger foreign exchange reserves experienced smaller currency depreciations. The reserves accumulated before the shock helped shape the adjustment that followed.
Our paper, On the Effectiveness of Foreign Exchange Reserves During the 2021–22 U.S. Monetary Tightening Cycle, written with Rashad Ahmed, Joshua Aizenman, and Gazi Salah Uddin, was published in Economics Letters in 2023.
The central finding is economically substantial: an additional 10 percentage points of reserves relative to GDP held before the tightening were associated with approximately 1.5–2 percentage points less currency depreciation against the dollar. The buffer was stronger in economies with less developed financial institutions. The paper also examines how reserve holdings and foreign exchange intervention work together.
Read the published paper (PDF) · Journal article · NBER version and online appendix · Stata replication files
The tightening behind the dollar surge
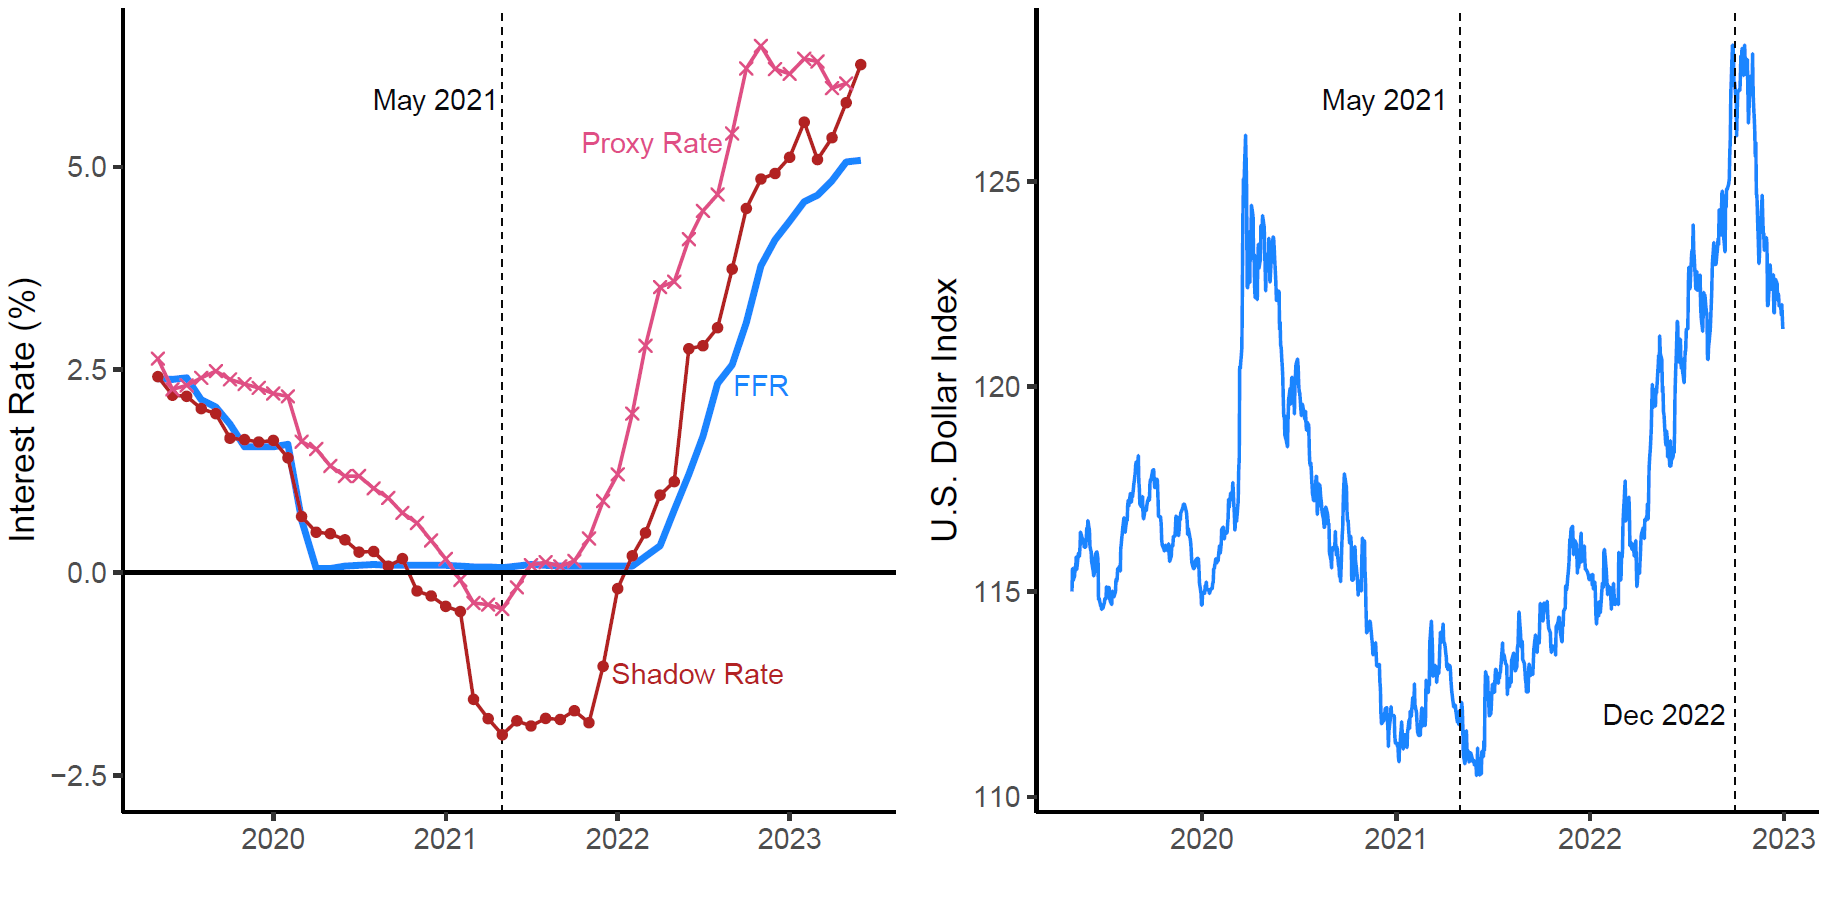
Between May 2021 and September 2022, the broad U.S. dollar appreciated by more than 15%. The starting date captures the earlier shift in monetary conditions visible in the shadow and proxy policy rates. These measures incorporate aspects of the policy stance beyond the federal funds rate, including the withdrawal of monetary accommodation before conventional rate increases began.
Figure 1 places the episode in context. The left panel tracks three measures of U.S. monetary policy; the right panel shows the dollar appreciation over the period used in the main analysis. This common external pressure generated substantial differences in currency adjustment across countries.
The value of reserves held before the shock
The empirical design relates subsequent currency depreciation to countries’ initial reserve positions and other fundamentals. The paper motivates the cross-sectional regression through a two-period specification with country and time effects. Taking the change between the two periods removes the country effects and yields:
\[ \Delta p_i=\alpha+\boldsymbol{\beta}’\mathbf{X}_i+u_i. \tag{1} \]
Here, \(\Delta p_i\) is country \(i\)’s depreciation against the dollar over the tightening episode, expressed in percent. The vector \(\mathbf{X}_i\) contains the initial country characteristics, including foreign exchange reserves relative to GDP in 2020. Across specifications, the analysis accounts for policy rates, financial development and openness, income, inflation, external positions, exchange rate stability, and trade exposure. Extended specifications also examine policy-rate changes during the episode and foreign exchange intervention.
Among the depreciating currencies in Table 1, column 2, the reserve coefficient is −0.1734. A reserve ratio higher by 10 percentage points therefore corresponds to approximately 1.73 percentage points less depreciation, conditional on the included controls. The interaction estimates further show that the reserve buffer is stronger at lower levels of financial development.
Holding reserves and using them
Reserves can support a currency through two related channels. The balance-sheet channel operates through the strength of the country’s external liquidity position: substantial reserve holdings can reduce perceived currency risk. The intervention channel operates when the central bank sells foreign currency to support the domestic currency.
The paper examines these channels by including foreign exchange intervention and its interaction with initial reserves. The reserve coefficient remains negative and significant when intervention is zero, supporting a balance-sheet effect. Reserve sales provide additional estimated protection for countries entering the episode with sufficiently large reserve holdings. In the specification reported in Table 1, column 6, the crossover occurs at approximately 46% of GDP.
This result connects the effectiveness of intervention to the resources available before the shock. A country’s capacity to deploy reserves and the strength of its initial reserve position jointly shape the currency response.
Evidence around the June 2021 FOMC announcement
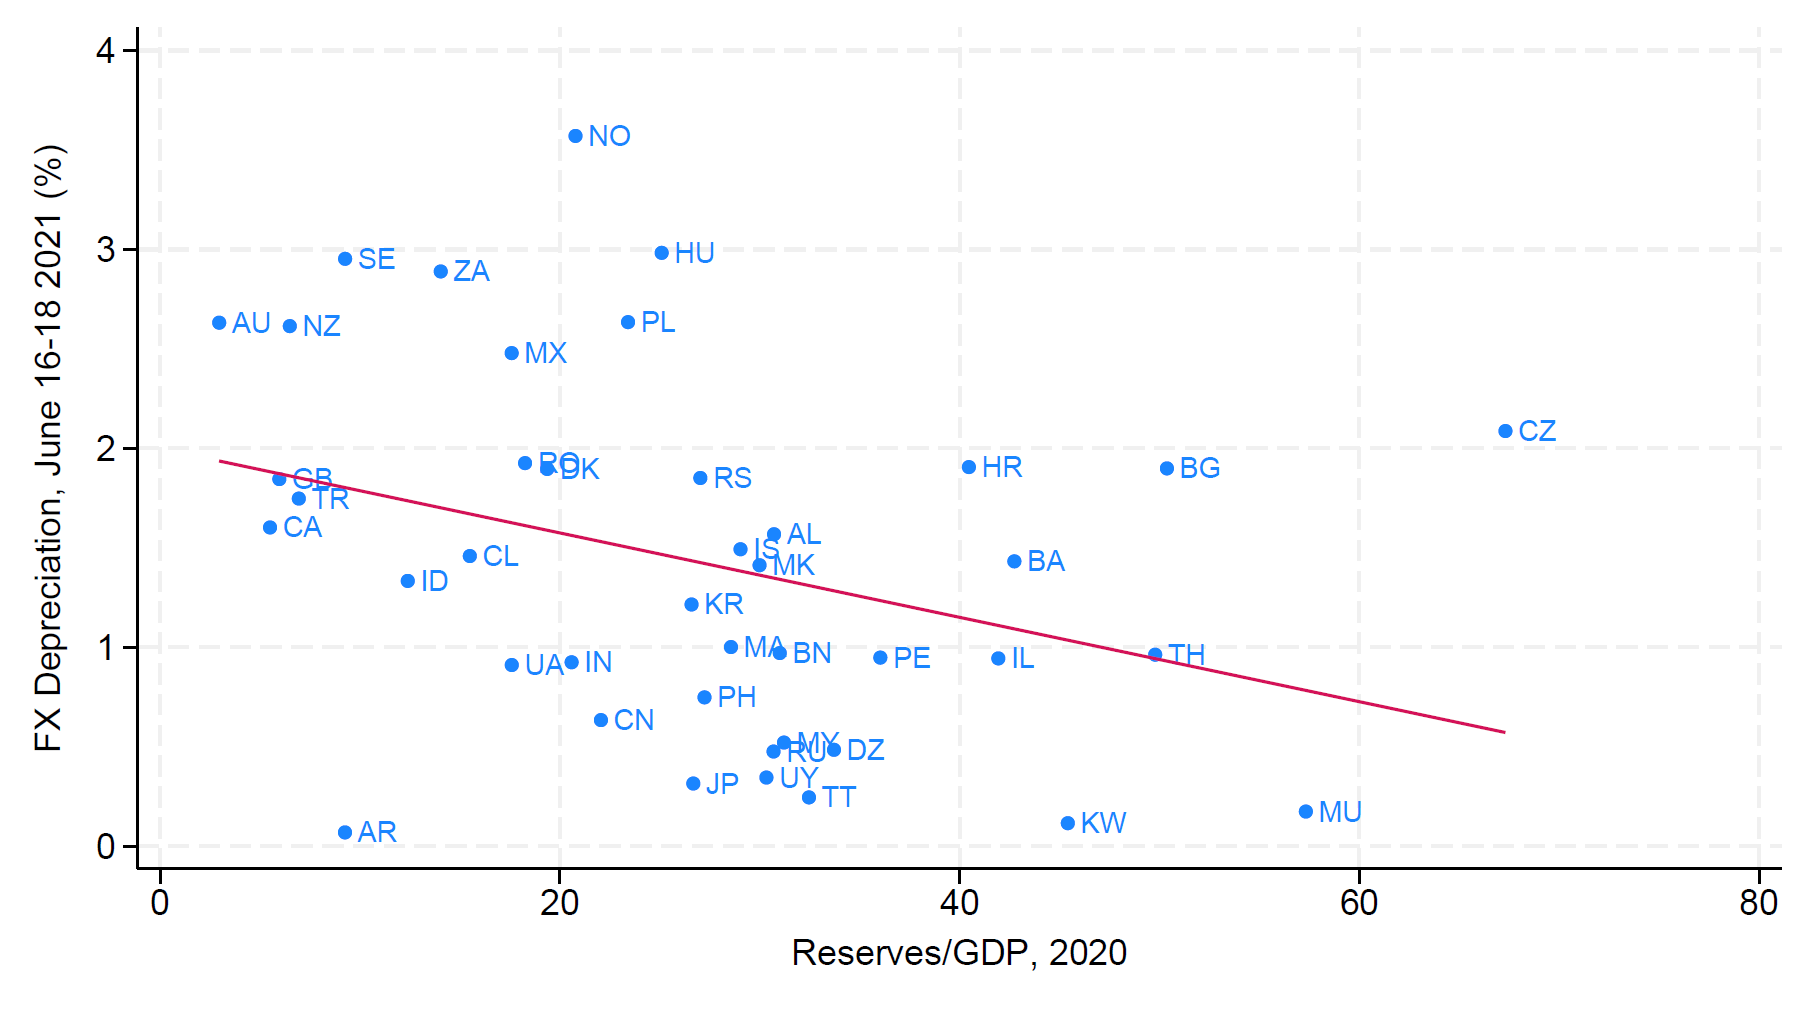
The paper also examines a short window around the 16 June 2021 FOMC announcement, which brought forward expectations of the end of quantitative easing and future interest-rate increases. The broad dollar appreciated by 1.31% on the following day, its largest daily increase within the study’s main episode.
Figure 2 relates initial reserves to currency depreciation between 16 and 18 June 2021 for 42 countries. The event-window interpretation rests on U.S. monetary policy being the principal driver of exchange rate movements over these days. Countries with larger reserve holdings experienced smaller depreciations; the estimated relationship is statistically significant at the 5% level.
| Period | Estimated difference in depreciation | Source |
|---|---|---|
| May 2021–September 2022 | −1.73 percentage points | Table 1, column 2 |
| 16–18 June 2021 | −0.21 percentage points | Figure 3 of the paper |
The first estimate comes from the regression with controls over the full episode; the second comes from the bivariate relationship over the announcement window. The short-window evidence corroborates the direction of the reserve buffer at the moment of a major U.S. monetary policy surprise.
Reserves and monetary policy space
The broader economic message concerns the capacity to absorb global financial spillovers. Reserves accumulated before a tightening episode can cushion currency pressure, with a particularly strong association in less financially developed economies. The paper also finds that higher initial policy rates are associated with smaller depreciations, especially in financially open economies.
These findings suggest some substitutability between reserve holdings and interest-rate policy in exchange rate management. By limiting depreciation pressures, reserves may give domestic monetary policy greater room to respond to domestic conditions. The contribution is to document this buffer during the 2021–22 dollar surge and connect it to both external balance-sheet strength and the use of reserves.
Read the paper
Ahmed, R., Aizenman, J., Saadaoui, J., and Uddin, G. S. (2023). On the effectiveness of foreign exchange reserves during the 2021–22 U.S. monetary tightening cycle. Economics Letters, 233, 111367. https://doi.org/10.1016/j.econlet.2023.111367.
Read the published paper (PDF) · NBER version and online appendix · Stata replication files
Selected references
Adler, G., Chang, K. S., Mano, R., and Shao, Y. (2021). Foreign Exchange Intervention: A Dataset of Public Data and Proxies. International Monetary Fund.
Choi, J., Doh, T., Foerster, A., and Martinez, Z. (2022). Monetary policy stance is tighter than federal funds rate. FRBSF Economic Letter, 2022-30.
Wu, J. C., and Xia, F. D. (2016). Measuring the macroeconomic impact of monetary policy at the zero lower bound. Journal of Money, Credit and Banking, 48(2–3), 253–291.