A modest change in the average investment forecast can coexist with a substantial deterioration in the downside. Our new paper shows where geopolitical risk leaves its clearest mark.
I am pleased to share that Geopolitical Risk and U.S. Investment-at-Risk, written with Fabio Anobile, Francesco Frangiamore, and Marco Maria Matarrese, has been accepted for publication in Economics Letters.
The central finding is economically substantial. A 30-point rise in the historical geopolitical risk index predicts a 1.8-percentage-point decline in the fifth conditional percentile of next-quarter U.S. investment growth. The corresponding change at the mean is just 0.15 percentage points. Median and upper-tail estimates are close to zero.
This contrast changes the information we take from an investment forecast. Geopolitical tensions can leave its center relatively stable while making an adverse investment outcome considerably more severe.
Read the accepted manuscript (PDF) · Earlier working-paper version on SSRN
The information in the lower tail
Investment-at-risk brings the distribution of future capital formation into the analysis. The fifth conditional percentile describes the severity of an adverse outcome at a fixed 5% conditional probability. A fall in this percentile means a worse downside scenario.
The quarterly exercise uses U.S. real gross private domestic investment, including inventory investment, over an underlying sample from 1947Q1 to 2025Q1. Investment growth is \(y_t=100\Delta\log I_t\), and the historical GPR index of Caldara and Iacoviello (2022) is averaged within each quarter. Following the at-risk approach of Adrian, Boyarchenko, and Giannone (2019), the baseline specification is:
\[ Q_\tau(y_{t+1}\mid g_t,y_t) =\alpha_\tau+\beta_\tau g_t+\gamma_\tau y_t \tag{1} \]
Here, \(g_t\) denotes geopolitical risk. The coefficient \(\beta_\tau\) measures its predictive association with a particular quantile of next-quarter growth, holding current investment growth fixed. At \(\tau=0.05\), the estimated coefficient is approximately −0.06.
| Forecast object | Reported coefficient | Implied change |
|---|---|---|
| Fifth conditional percentile | ≈ −0.060 | ≈ −1.80 pp |
| Conditional mean | −0.005 | −0.15 pp |
Changes are in percentage points of next-quarter investment growth, holding current growth fixed. The 30-point comparison is a change in index units; the quarterly estimates describe predictive associations.
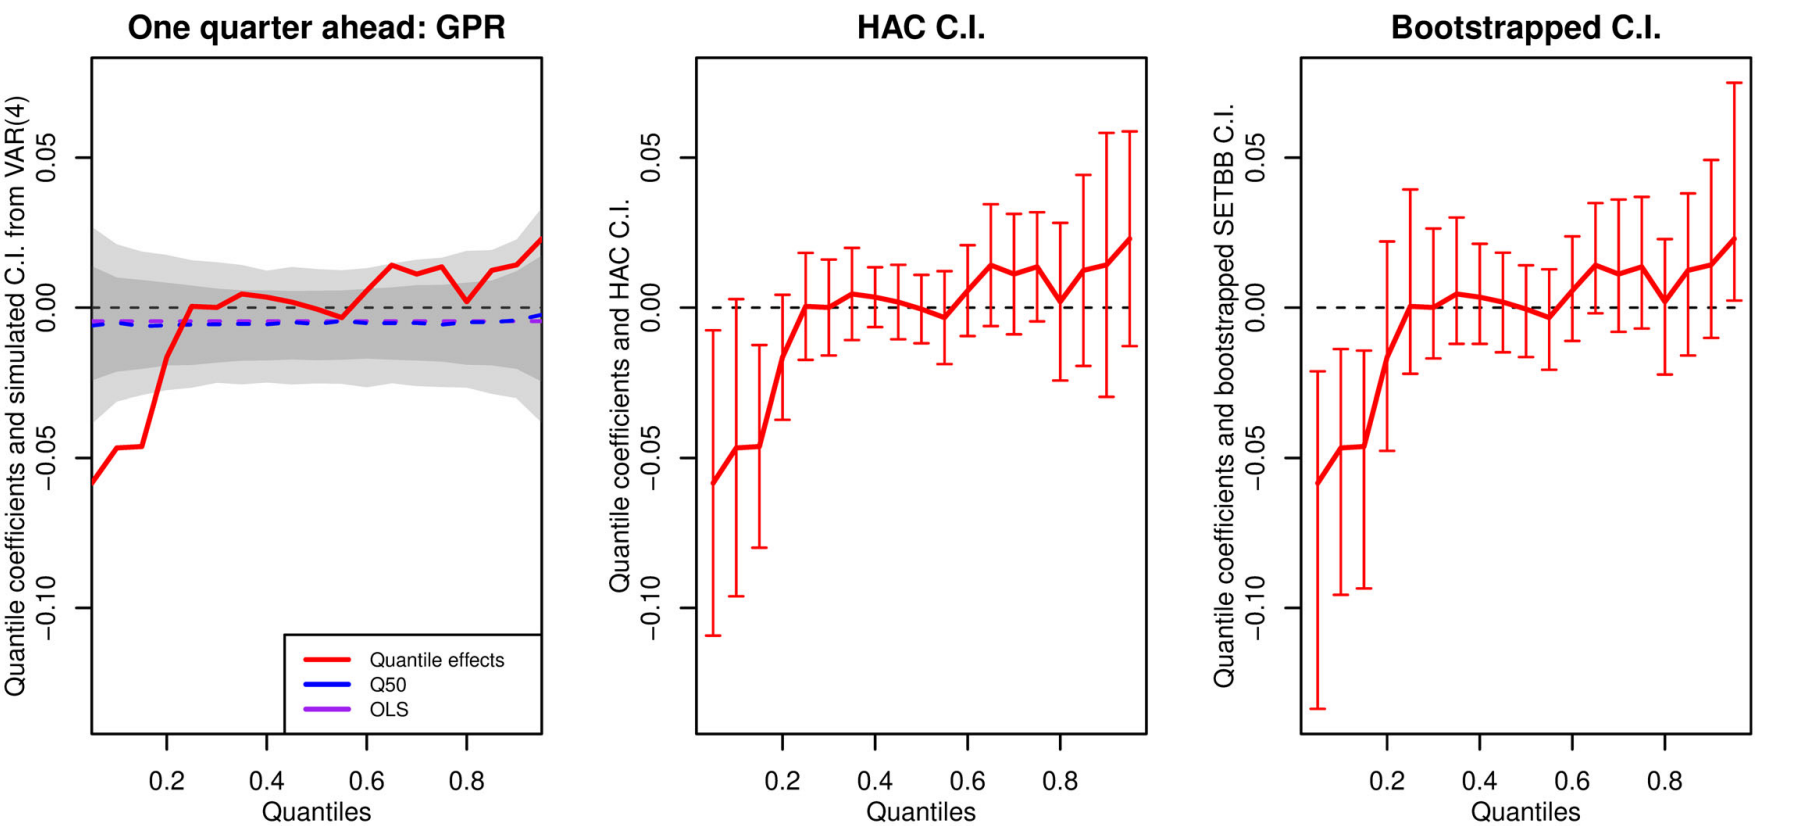
The lower-tail pattern persists when the specification includes the corporate credit spread, current GDP growth, or the long-run financial-stress proxy. Distribution regressions provide a complementary finding: higher GPR predicts a greater probability of crossing severe negative growth thresholds.
The historical dimension also matters. In the 1971–2025 subsample, the fifth-percentile coefficient is smaller and its 90% confidence interval includes zero. Excluding the earliest Korean War observations likewise attenuates the estimate. These results make the timing of the investment-risk response a central part of the paper.
How geopolitical shocks reshape downside investment risk
The monthly analysis examines how a geopolitical shock changes the investment-risk outlook over time. Using Barrett’s (2025) estimated U.S. national accounts for 1990M1–2025M1, we first construct fitted one-month-ahead investment-growth quantiles following Loria, Matthes, and Zhang (2025). Time-varying local projections, estimated with the path estimator of Inoue, Rossi, and Wang (2024), then trace their responses to a one-standard-deviation GPR innovation across dates and horizons.
Figure 2 below reproduces Figure 3 of the paper and focuses on the fifth-percentile-minus-median gap:
\[ D_t=q_{0.05,t}-q_{0.50,t} \tag{2} \]
Here, \(q_{\tau,t}\) is the fitted conditional quantile of next-month investment growth. A decline in \(D_t\) means that the adverse investment scenario deteriorates relative to the median. A common movement in both quantiles cancels from the gap. The forecast horizon remains one month throughout; the local-projection horizon measures how this risk outlook responds over the subsequent 0–15 months.
The black line reports the constant-parameter response. Each green line is a point-estimate response for a particular date, allowing the strength and persistence of transmission to vary over time. The left panel displays the full set of dated responses. The right panel retains dates when GPR exceeds its sample 75th percentile, providing a descriptive view of responses during high-tension episodes.
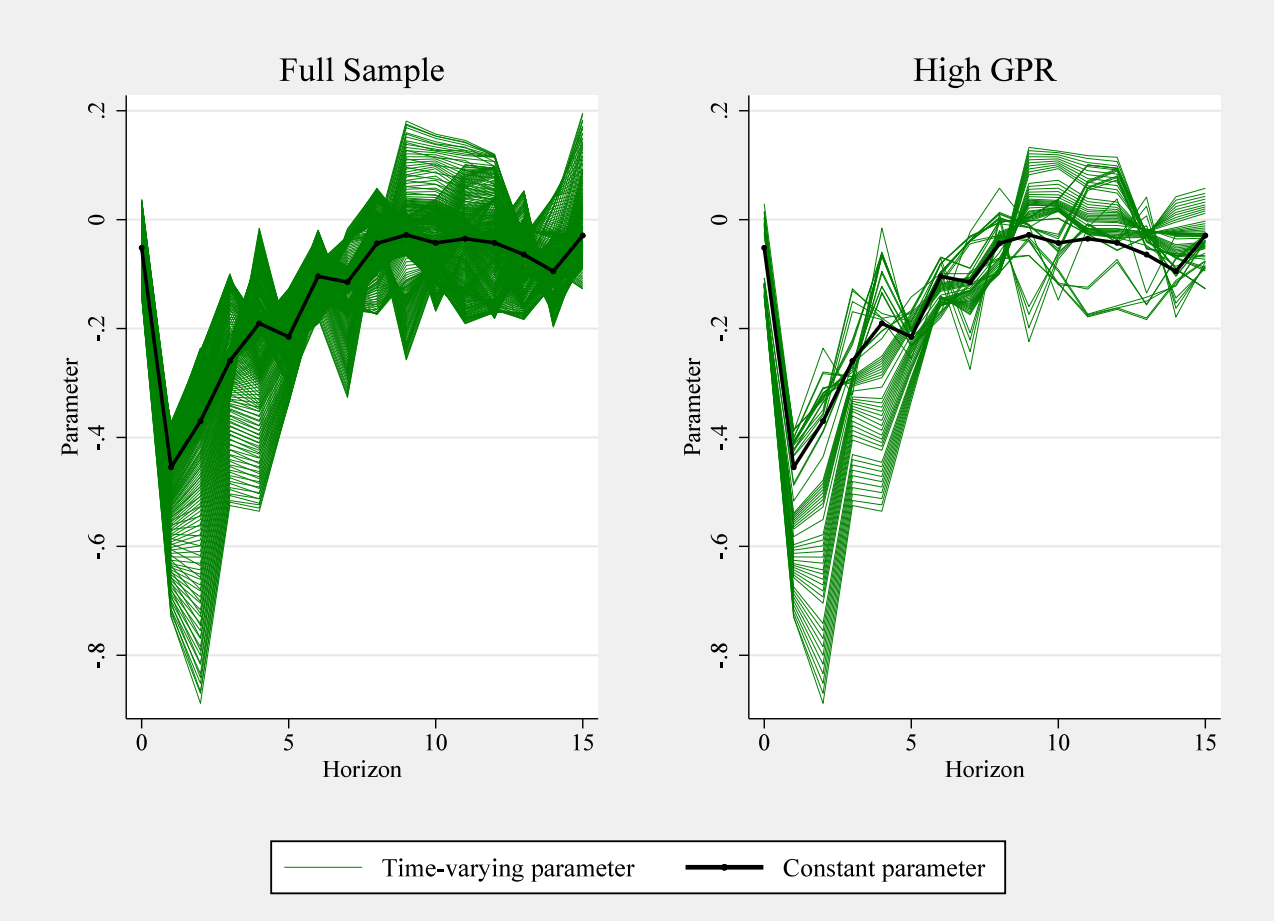
The constant-parameter response reaches approximately −0.4 percentage points after one month and remains negative for roughly seven months. Selected high-GPR responses approach −0.9 percentage points at short horizons, revealing substantially sharper downside deterioration at particular dates.
The economic message is that geopolitical shocks can worsen the adverse investment scenario more strongly than the central outlook, with the intensity of this deterioration varying across historical episodes. The paper’s complete time-varying results show how this pattern differs across quantiles and horizons.
The investment decision behind the result
Capital expenditure often commits resources that are costly to recover. Greater uncertainty can therefore increase the option value of waiting: firms postpone projects until the outlook becomes clearer. This mechanism, developed in the investment-under-uncertainty literature, makes the lower tail of investment growth a natural place to look for geopolitical effects.
The paper examines geopolitical threats and realized acts separately. Threats have more negative lower-tail point estimates. The formal comparison leaves their ranking statistically unresolved: the joint test at the fifth and tenth percentiles gives a bootstrap p-value of 0.843. Supplementary consumption results also show a stronger lower-tail association for durables. Together, these patterns are consistent with postponement under uncertainty; the paper discusses their interpretation alongside trade, physical-disruption, and financial channels.
From GPR innovations to structural responses
The monthly exercise places GPR first in a recursive ordering. Conditional on the included history, other economic shocks are excluded from affecting GPR within the same month. Geopolitical shocks can immediately affect investment risk, volatility, and sentiment, and feedback is allowed at later horizons. The paper motivates this restriction using the timing of sudden geopolitical events and the index’s construction.
The projections condition on lags 1–24 of the relevant fitted quantile, GPR, VIX, and Michigan consumer sentiment. Lag conditioning accounts for predictable history; the contemporaneous restriction supplies the structural interpretation. Current volatility and sentiment remain available as transmission channels.
Two related EconMacro posts
My post AR Filtering or Lag Controls? What the Frisch-Waugh-Lovell Theorem Really Says explains how filtering GPR and including lag controls relate in a matched linear specification. It clarifies the separate roles of removing predictable variation and establishing exogeneity.
My post Can Local Projections Have Short-Run Restrictions? explains how recursive restrictions identify a shock that can then enter a local projection. The impact restriction defines the shock, while the projection estimates its propagation across horizons.
Read the paper
The contribution is to identify capital formation as a distinct margin of geopolitical downside risk. A stable central forecast can coexist with a worsening adverse investment scenario, and the monthly evidence shows how that deterioration persists and varies across historical episodes.
The paper brings these distributional and dynamic results together. Its online appendix provides the financial-control specifications, sample comparisons, full time-varying response paths, and formal threats–acts comparison. I hope the findings will be useful to readers working on investment, geopolitical risk, and macroeconomic surveillance.
Anobile, F., Frangiamore, F., Matarrese, M. M., and Saadaoui, J. Geopolitical Risk and U.S. Investment-at-Risk. Accepted for publication in Economics Letters.
Read the accepted manuscript (PDF) · Earlier version: SSRN 5536200
Selected references and data
Adrian, T., Boyarchenko, N., and Giannone, D. (2019). Vulnerable growth. American Economic Review, 109(4), 1263–1289.
Barrett, P. (2025). Estimated monthly national accounts for the United States. IMF Working Paper 2025/134.
Caldara, D., and Iacoviello, M. (2022). Measuring geopolitical risk. American Economic Review, 112(4), 1194–1225. GPR data and documentation.
Dixit, A. K., and Pindyck, R. S. (1994). Investment under Uncertainty. Princeton University Press.
Inoue, A., Rossi, B., and Wang, Y. (2024). Local projections in unstable environments. Journal of Econometrics, 244(2), 105726.
Loria, F., Matthes, C., and Zhang, D. (2025). Assessing macroeconomic tail risk. Economic Journal, 135(665), 264–284.
Plagborg-Møller, M., and Wolf, C. K. (2021). Local projections and VARs estimate the same impulse responses. Econometrica, 89(2), 955–980.
Quarterly investment: U.S. Bureau of Economic Analysis, Real Gross Private Domestic Investment (GPDIC1), via FRED.