In this blog, I will show you how to download and plot high-frequency data (HFD) for the EURUSD currency pair. The data comes from Polygon.io (you need to create an API key), and the code used in this blog is available in the following GitHub folder: https://github.com/JamelSaadaoui/EconMacroBlog.
It is based on the following NBER working paper: Aizenman, J., & Saadaoui, J. (2024). How Institutions Interact with Exchange Rates After the 2024 US Presidential Election: New High-Frequency Evidence (No. w33193). National Bureau of Economic Research.
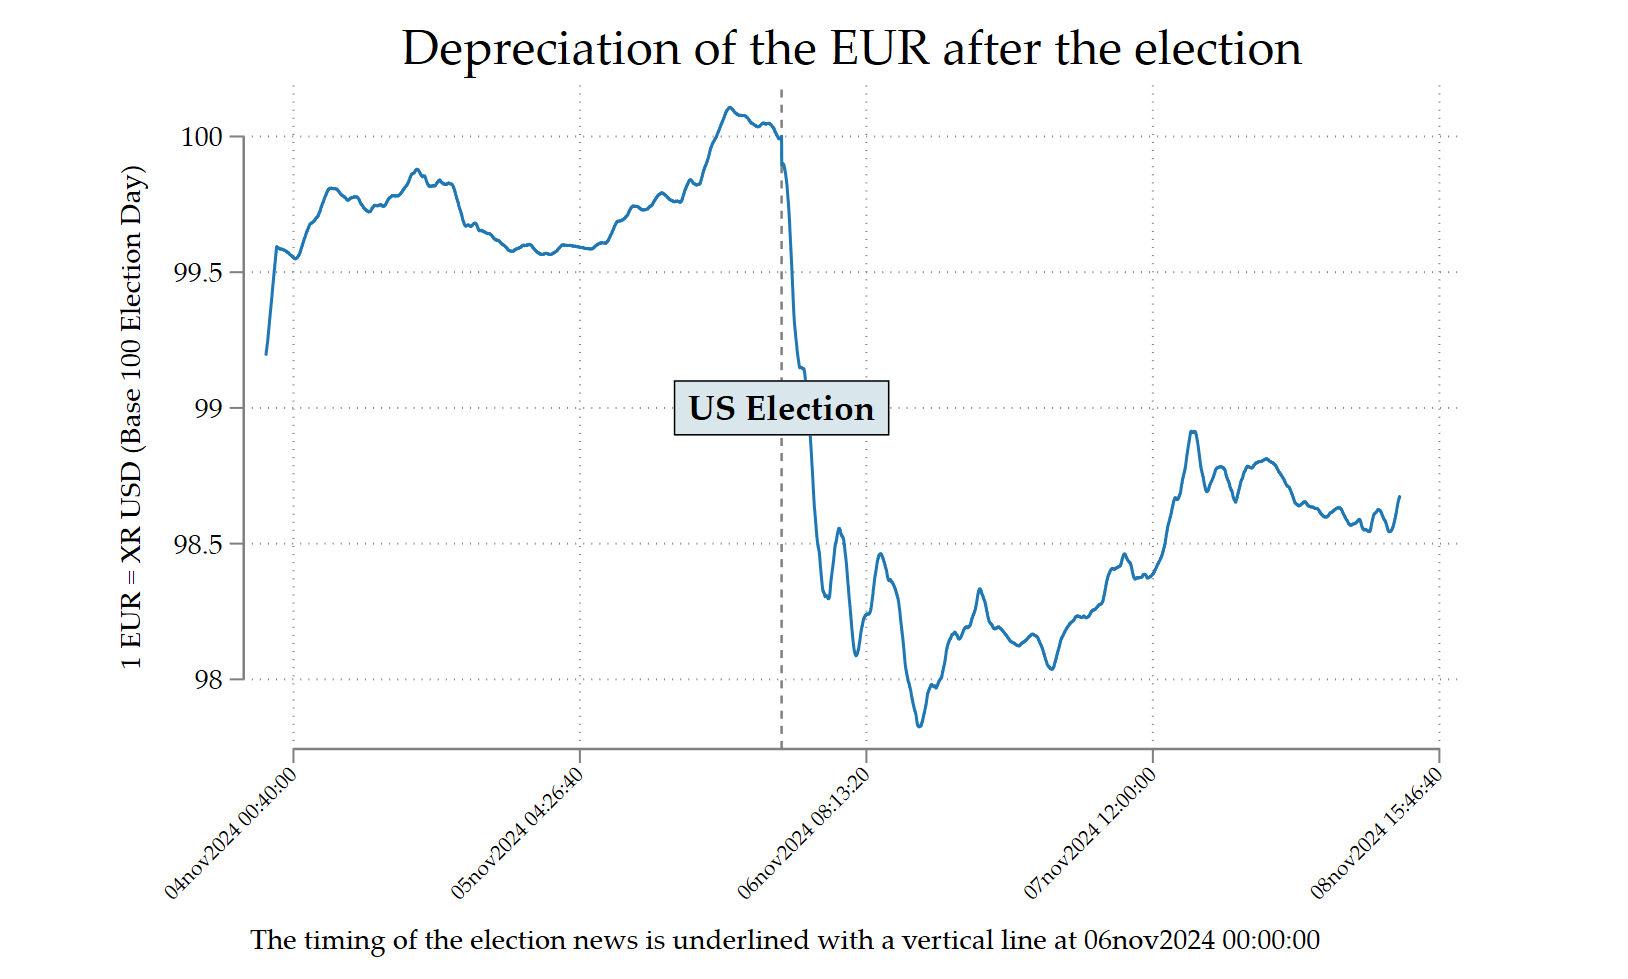
The objective is to replicate the following figure below with quitting Stata. You will need to install Python before. I have a small series of blogs on Python/Stata integration: https://www.jamelsaadaoui.com/?s=python. I used ChatGPT 5 for the first part.
The code is commented in each step and fully reproduced below:
capture log close _all
log using HFD.smcl, name(HFD) smcl replace

// Download and plot high-frequency data

cls
clear

**# Only once locate and initiate python

python search

*python set exec "C:/Users/jamel/AppData/Local/Programs/Python/Python313/python.exe", permanently

**# Use python to install the client

python:
import sys, subprocess
subprocess.check_call([sys.executable, '-m', 'pip', 'install', 'polygon-api-client'])
end

**# Create the RESTClient

python:
from polygon import RESTClient
client = RESTClient(api_key="REPLACE_API_KEY")
print("RESTClient created:", client)
end

**# Import the data

python:
import pandas as pd

ticker = "C:EURUSD"

# Retrieving aggregations from the API
aggs = list(client.list_aggs(
    ticker=ticker,
    multiplier=1,
    timespan="minute",
    from_="2024-09-06",
    to="2025-03-01",
    limit=50000
))

# Convert in DataFrame
df = pd.DataFrame(aggs)

# Conversion of the 'timestamp' column in 'datetime'
df['datetime'] = pd.to_datetime(df['timestamp'], unit='ms')

# Sauvegarde en CSV
df.to_csv('EURUSD_data.csv', index=False)

print("Les données ont été correctement sauvegardées dans EURUSD_data.csv.")

end

python:
print(df[['timestamp', 'datetime']].head())
end

python:
import sys, subprocess
subprocess.check_call([sys.executable, '-m', 'pip', 'install', 'openpyxl'])
end

python:
import pandas as pd

# Read existing CSV
df = pd.read_csv('EURUSD_data.csv')

# Save as Excel file
df.to_excel('EURUSD_data.xlsx', index=False)
print("Excel file EURUSD_data.xlsx created successfully.")
end

**# Import and visualize high-frequency data

// Set the current directory
*cd "C:\Users\jamel\Dropbox\Latex\PROJECTS\"
*cd "24-11-xr-trump-election\Data-HFD"

// Import the data and select

import excel "EURUSD_data.xlsx", ///
 sheet("Sheet1") firstrow clear

// Because %tc values can be so large,
// whenever you use the function clock(),
// you must store the results in a double, as we do below:
// https://www.stata.com/manuals13/u24.pdf

set varabbrev off

gen double date2 = clock(datetime, "YMDhms")
gen double date3 = clock(datetime, "YMDhms")

// Format the variable to see all the digits in browser mode
format %100.0g date3

// Format the date variable
format %tc date2

// Declare the time series
tsset date2

// Rename the closing value C_EURUSD
rename open C_EURUSD

// Create base 1 from the Election Day
cap drop FX
gen FX=100*(C_EURUSD[_n]/C_EURUSD[60950])

// Create an artifical time variable
gen time = _n-1

// Choose a nice scheme
set scheme white_tableau

// Find a specific date
scalar a = tc(03nov2024 12:00:00)
di %100.0g scalar(a)
scalar c = tc(06nov2024 00:00:00)
di %100.0g scalar(c)
scalar b = tc(08nov2024 12:00:00)
di %100.0g scalar(b)

tsset time
cap drop maFX
tssmooth ma maFX=FX, window(60 0 0)

tsset date2

// Create base 100 from the Election Day (locate election day's row)
replace maFX=100*(maFX[_n]/maFX[60950])

// Make a more in-depth graph
twoway ///
 (tsline maFX if date3>2046254400000 & date3<2046686400000, ///
  title("Depreciation of the EUR after the election") ///
  xlabel(, ///
  angle(45) labsize(vsmall)) ///
  ytitle("1 EUR = XR USD (Base 100 Election Day)") ///
  tlabel(, grid) ysize(6) xline(2046470400000 ///
  ) xsize(10) xti("") ///
  text(99 2046470400000 "{bf:US Election}", box ///
       margin(l+1 t+1 b+1 r+1)) ///
  graphregion(margin(l+10 r+15)) ///
  , name(EURUSDZOOM, replace) ///
  note(The timing of the election news is underlined with a vertical line at 06nov2024 00:00:00))
graph export EURUSDZOOM.pdf, replace
graph export EURUSDZOOM.png, width(4000) replace


// Unit root test
tsset time
dfuller C_EURUSD, lags(60)

// Save the data
save EURUSD_data_8august2025.dta, replace


log close _all
exit

**# End of Program