In this blog, I will show you how to download and plot daily bilateral exchange rates. The data comes from the BIS, and the code used in this blog is available in the following GitHub folder: https://github.com/JamelSaadaoui/EconMacroBlog.
It is based on the following NBER working paper: Aizenman, J., & Saadaoui, J. (2024). How Institutions Interact with Exchange Rates After the 2024 US Presidential Election: New High-Frequency Evidence (No. w33193). National Bureau of Economic Research.
The objective is to replicate the following figure below with quitting Stata. You will need to install Python before. I have a small series of blogs on Python/Stata integration: https://www.jamelsaadaoui.com/?s=python.
We are going to reproduce the two Figures below:
This post is a major update of two previous posts (see below). Thus, I recommend taking a look at these two previous blogs:
The code is commented in each step and fully reproduced below:
capture log close _all
log using BIS.smcl, name(BIS) smcl replace
// Download and plot high-frequency data
cls
clear
**# Only once locate and initiate python
python search
*python set exec "C:/Users/jamel/AppData/Local/Programs/Python/Python313/python.exe", permanently
**# Use python to install pandas
python:
import sys, subprocess
subprocess.check_call([sys.executable, '-m', 'pip', 'install', 'pandas[excel]'])
end
**# Import the data from the BIS
python:
import pandas as pd
import requests
# Define the URL
url = "https://stats.bis.org/api/v2/data/dataflow/BIS/WS_XRU/1.0/D...A?startPeriod=2024-01-30&endPeriod=2025-08-08&format=csv"
try:
# Fetch data from the API
response = requests.get(url)
response.raise_for_status() # Raise an error for HTTP issues (4xx, 5xx)
# Read the CSV content
df = pd.read_csv(url)
# Save data to an Excel file
excel_filename = "BIS_exchange_rates.xlsx"
df.to_excel(excel_filename, index=False)
print(f"Data successfully saved to {excel_filename}")
except requests.exceptions.HTTPError as http_err:
print(f"HTTP error occurred: {http_err}")
except requests.exceptions.RequestException as err:
print(f"Other error occurred: {err}")
except Exception as e:
print(f"An error occurred: {e}")
end
**# Prepare data and draw the graphs with Stata
graph set window fontface "Palatino Linotype"
import excel "BIS_exchange_rates.xlsx", sheet("Sheet1") firstrow
des
kountry REF_AREA, from(iso2c)
rename NAMES_STD country
kountry REF_AREA, from(iso2c) to(imfn)
rename _IMFN_ imfcode
kountry REF_AREA, from(iso2c) to(iso3c)
rename _ISO3C_ iso3c
replace country = "United Arab Emirates" if REF_AREA == "AE"
replace country = "Euro Area" if REF_AREA == "XM"
drop if imfcode==.
split TIME_PERIOD, parse(-)
gen string = TIME_PERIOD3 + ///
"/" + TIME_PERIOD2 + ///
"/" + TIME_PERIOD1
gen date = date(string, "DMY")
format date %td
split TITLE, parse(-)
rename TITLE2 UNITS
rename OBS_VALUE XR
order imfcode date XR country REF_AREA UNITS
replace imfcode=999 if country=="Euro Area"
labmask imfcode, value(iso3c)
xtset imfcode date
tsfill, full
xtset imfcode date
xtdes
lab var XR "Bilateral Exchange rates"
rename imfcode cn
group_dummy
rename cn imfcode
gen XRDAY = XR if date==td(6nov2024)
by imfcode: egen TR = mean(XRDAY)
gen DXR = 100*(XR-TR)/TR
label define emg 0 "Emerging Markets" ///
1 "Other countries", replace
label values emg emg
display td(8oct2024)
display td(29oct2024)
display td(6nov2024)
display td(12nov2024)
display td(19nov2024)
display td(26nov2024)
display td(3dec2024)
drop if UNITS==" Euro "
drop if UNITS==" Russian rouble "
graph bar DXR if date==23657 & DXR!=0 & DXR!=., ///
over(imfcode, label(angle(90) labsize(vsmall)) ///
gap(25) sort(1) descending) ///
yti("") yline(0) ///
ti("Depreciation in percent 4 weeks before", ///
size(small)) ///
name(G1, replace)
graph bar DXR if date==23678 & DXR!=0 & DXR!=., ///
over(imfcode, label(angle(90) labsize(vsmall)) ///
gap(25) sort(1) descending) ///
yti("") yline(0) ///
ti("Depreciation in percent 1 week before", ///
size(small)) ///
name(G2, replace)
graph bar DXR if date==23692 & DXR!=0 & DXR!=., ///
over(imfcode, label(angle(90) labsize(vsmall)) ///
gap(25) sort(1) descending) ///
yti("") yline(0) ///
ti("Depreciation in percent 1 week after", ///
size(small)) ///
name(G3, replace)
graph bar DXR if date==23713 & DXR!=0 & DXR!=., ///
over(imfcode, label(angle(90) labsize(vsmall)) ///
gap(25) sort(1) descending) ///
yti("") yline(0) ///
ti("Depreciation in percent 4 weeks after", ///
size(small)) ///
name(G4, replace)
graph combine G1 G2 G3 G4, ti("Exchange Rate Behavior around the US 2024 Presidential Election") ///
scale(0.95) row(2)
graph export XR.png, as(png) width(4000) replace
*ssc install lgraph
lgraph DXR date if date>=td(23oct2024) & ///
date<=td(20nov2024) ///
& imfcode!=111 & DXR!=. & DXR!=0, ///
yline(0) xlab(,angle(90)) xline(23686) ///
xti("") ti("Exchange Rate Depreciation") ///
note("Data from the Bank for International Settlements" ///
"Average for an intial sample of 73 currency pairs." ///
"US, missing and fixed echange rates excluded.")
label variable DXR "Bilateral Exchange Rate"
xtline DXR if idc==1 & date>=td(23oct2024) & ///
date<=td(20nov2024) ///
& imfcode!=111 & DXR!=. & DXR!=0, yline(0) ///
overlay title("Industrial Countries") ///
note("Data from the Bank for International Settlements")
graph rename idc, replace
graph export idc.png, as(png) width(4000) replace
xtline DXR if date>=td(23oct2024) & ///
date<=td(20nov2024) ///
& imfcode!=111 & DXR!=. & DXR!=0 ///
& emg==1, yline(0) ///
overlay title("Emerging Countries") ///
note("Data from the Bank for International Settlements")
graph rename emg2, replace
graph export emg2.png, as(png) width(4000) replace
xtline DXR if eap==1 & date>=td(20jan2025) ///
& imfcode!=111 & DXR!=., yline(0) ///
overlay title("East Asia Pacific") ///
note("Data from the Bank for International Settlements")
graph rename eap, replace
graph export eap.png, as(png) width(4000) replace
xtline DXR if eca==1 & date>=td(20jan2025) ///
& imfcode!=111 & DXR!=., yline(0) ///
overlay title("Europe and Central Asia") ///
note("Data from the Bank for International Settlements")
graph rename eca, replace
graph export eca.png, as(png) width(4000) replace
xtline DXR if lac==1 & date>=td(20jan2025) ///
& imfcode!=111 & DXR!=., yline(0) ///
overlay title("Latin America") ///
note("Data from the Bank for International Settlements")
graph rename lac, replace
graph export lac.png, as(png) width(4000) replace
xtline DXR if we==1 & date>=td(20jan2025) ///
& imfcode!=111 & DXR!=., yline(0) ///
overlay title("Western Europe") ///
note("Data from the Bank for International Settlements")
graph rename we, replace
graph export we.png, as(png) width(4000) replace
xtline DXR if fc==1 & date>=td(20jan2025) ///
& imfcode!=111 & DXR!=., yline(0) ///
overlay title("Financial Centers") ///
note("Data from the Bank for International Settlements")
graph rename oil, replace
graph export oil.png, as(png) width(4000) replace
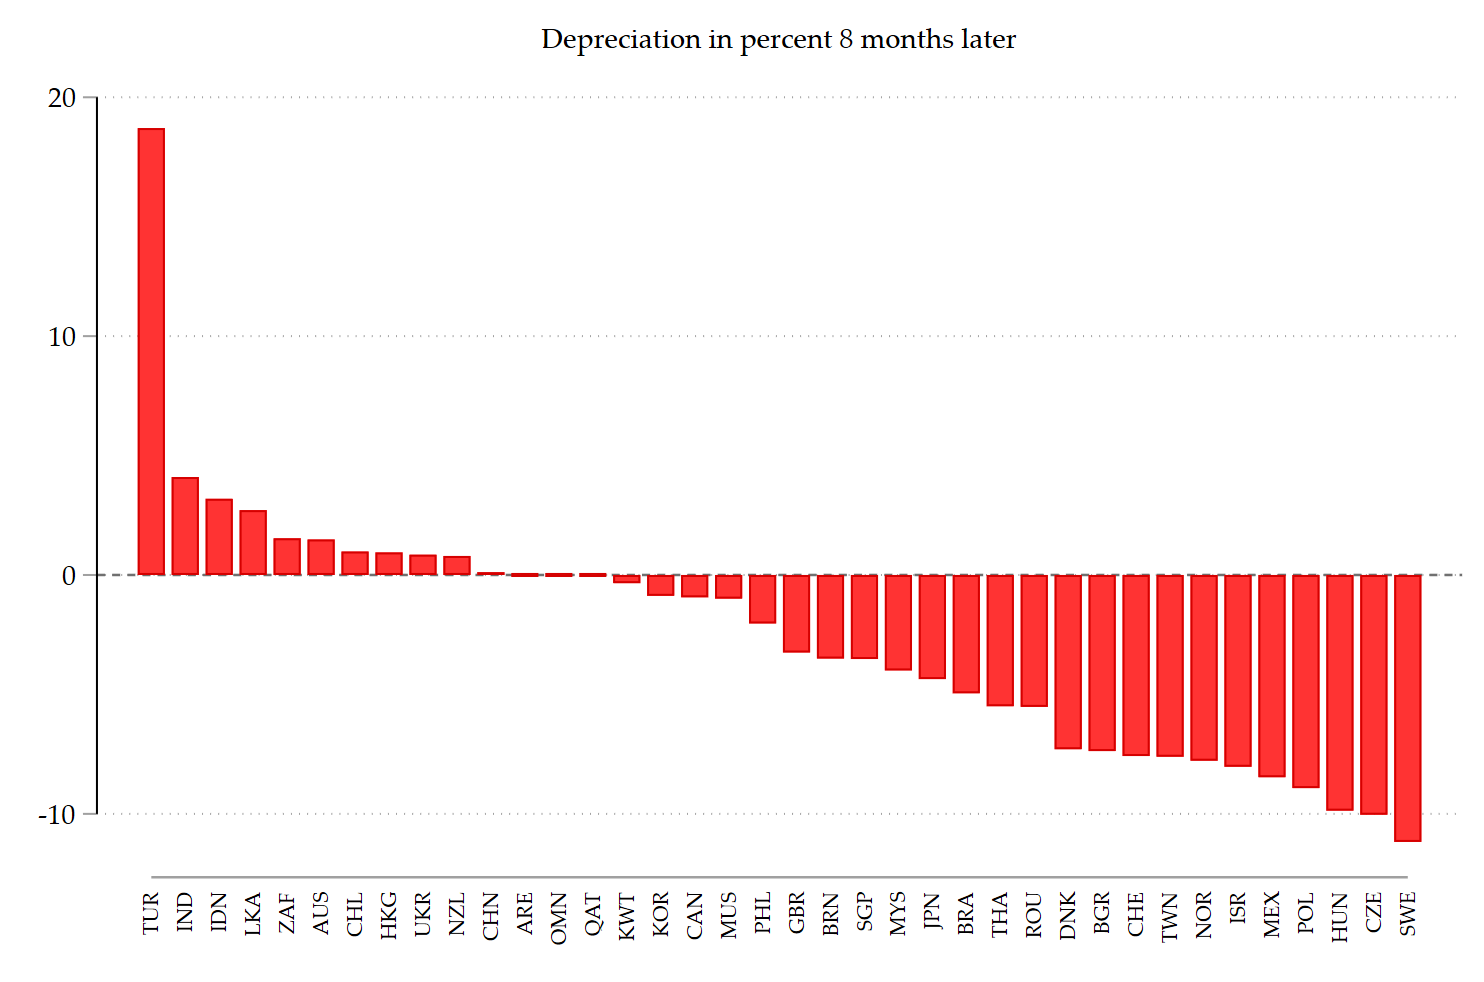
**# Latest developments
display td(5aug2025)
graph bar DXR if date==23958 & DXR!=0 & DXR!=., ///
over(imfcode, label(angle(90) labsize(vsmall)) ///
gap(25) sort(1) descending) ///
yti("") yline(0) ///
ti("Depreciation in percent 8 months later", ///
size(small)) ///
name(GF, replace)
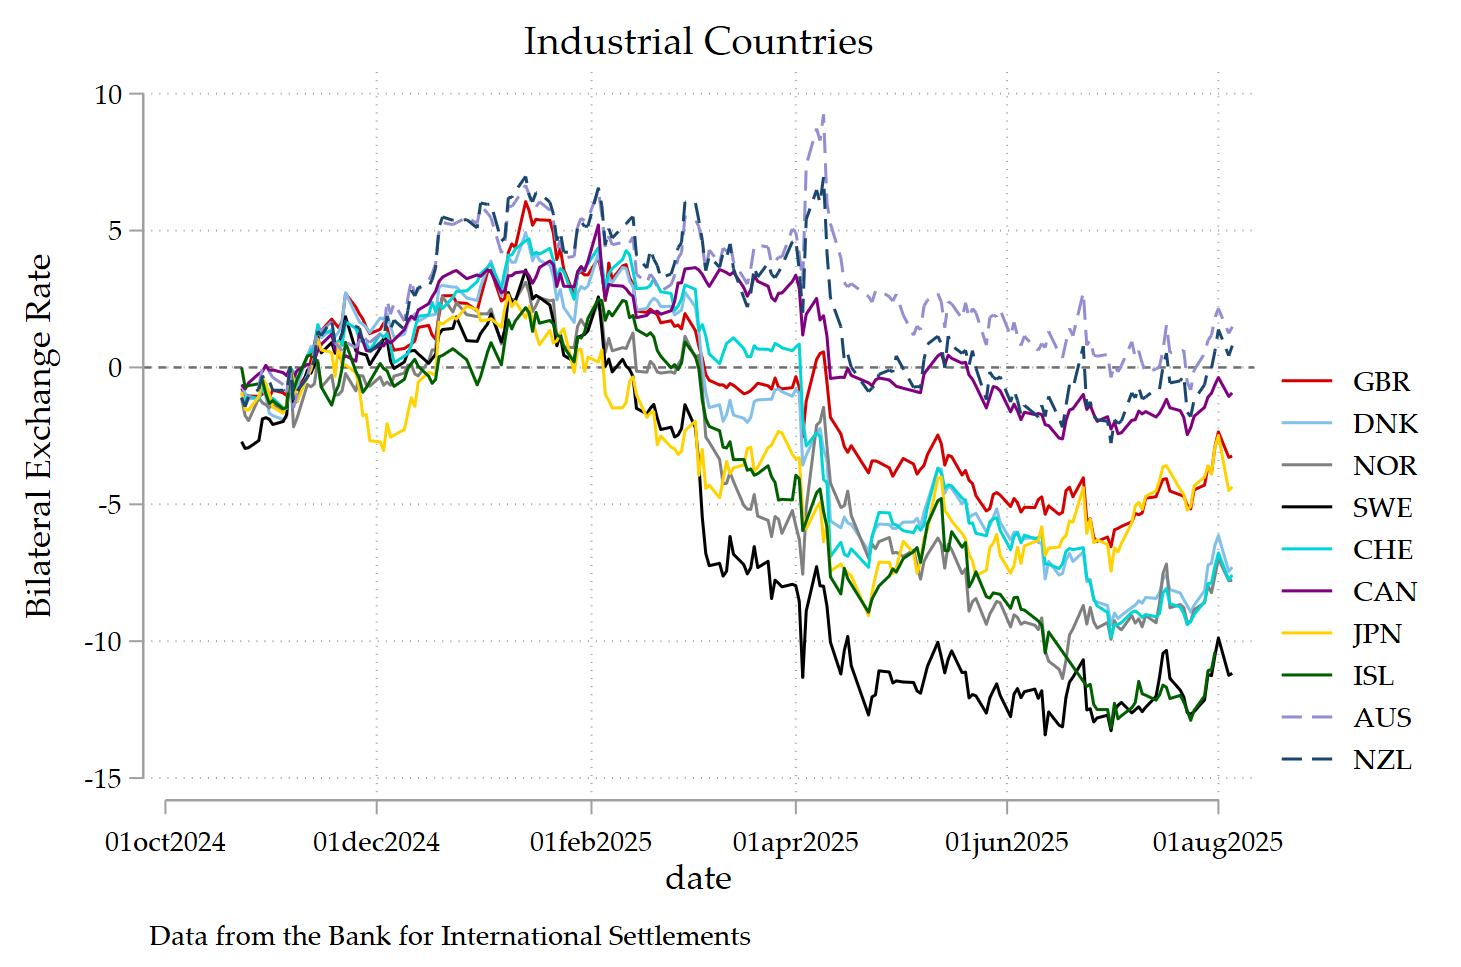
xtline DXR if date>=td(23oct2024) & ///
date<=td(5aug2025) ///
& imfcode!=111 & DXR!=. & DXR!=0 ///
& idc==1, yline(0) ///
overlay title("Industrial Countries") ///
note("Data from the Bank for International Settlements")
graph rename idc2F, replace
graph export idc2F.png, as(png) width(4000) replace
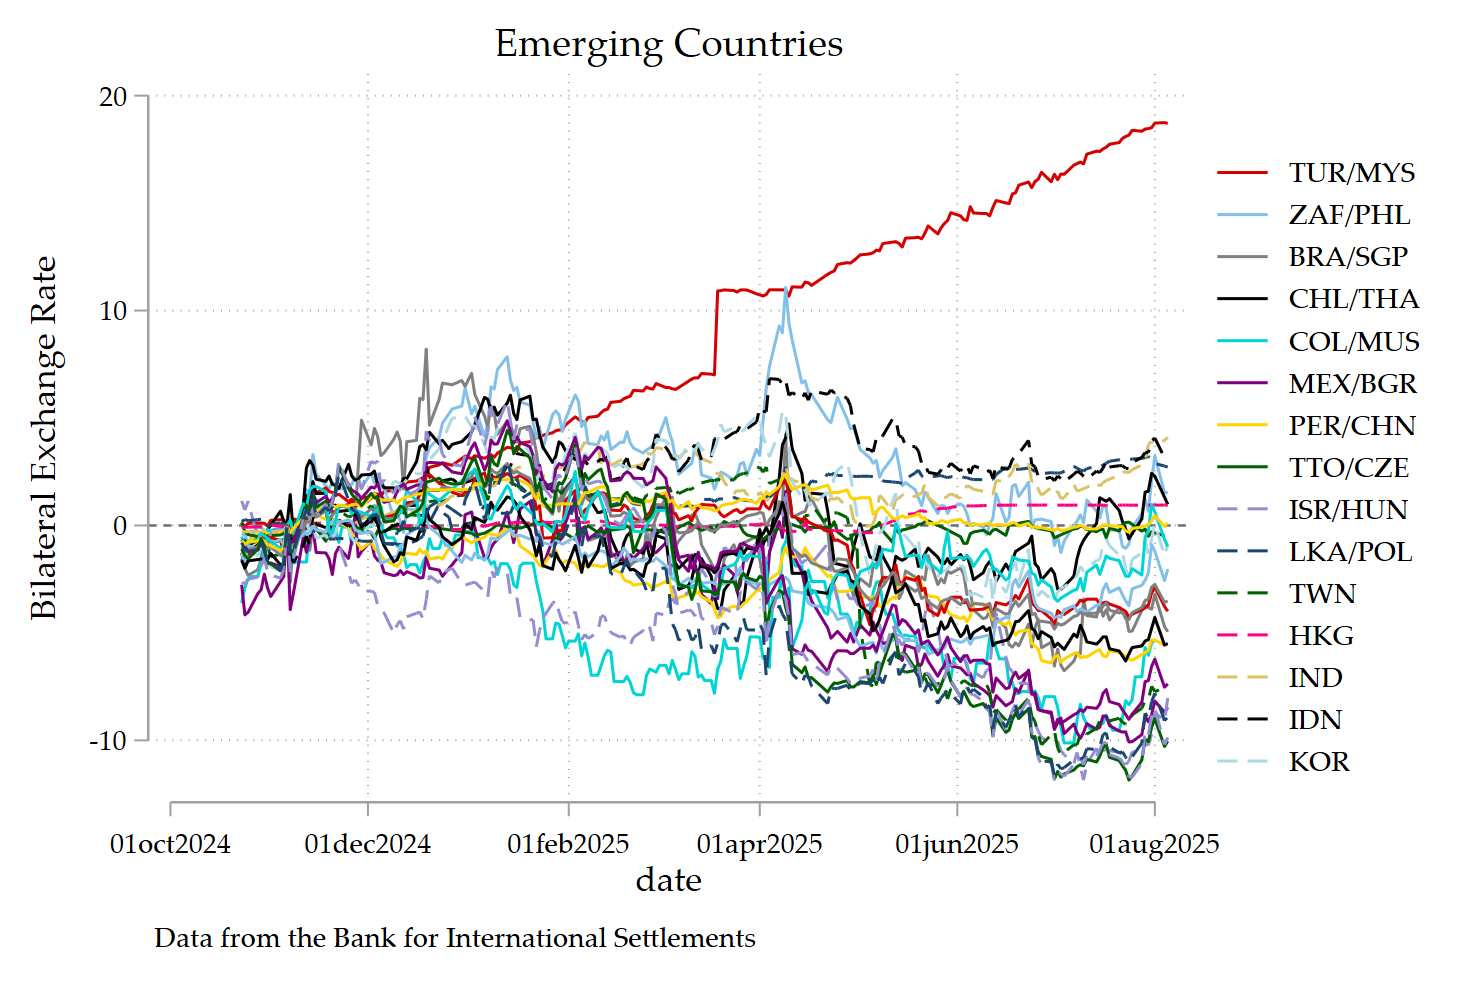
xtline DXR if date>=td(23oct2024) & ///
date<=td(5aug2025) ///
& imfcode!=111 & DXR!=. & DXR!=0 ///
& emg==1, yline(0) ///
overlay title("Emerging Countries") ///
note("Data from the Bank for International Settlements")
graph rename emg2F, replace
graph export emg2F.png, as(png) width(4000) replace
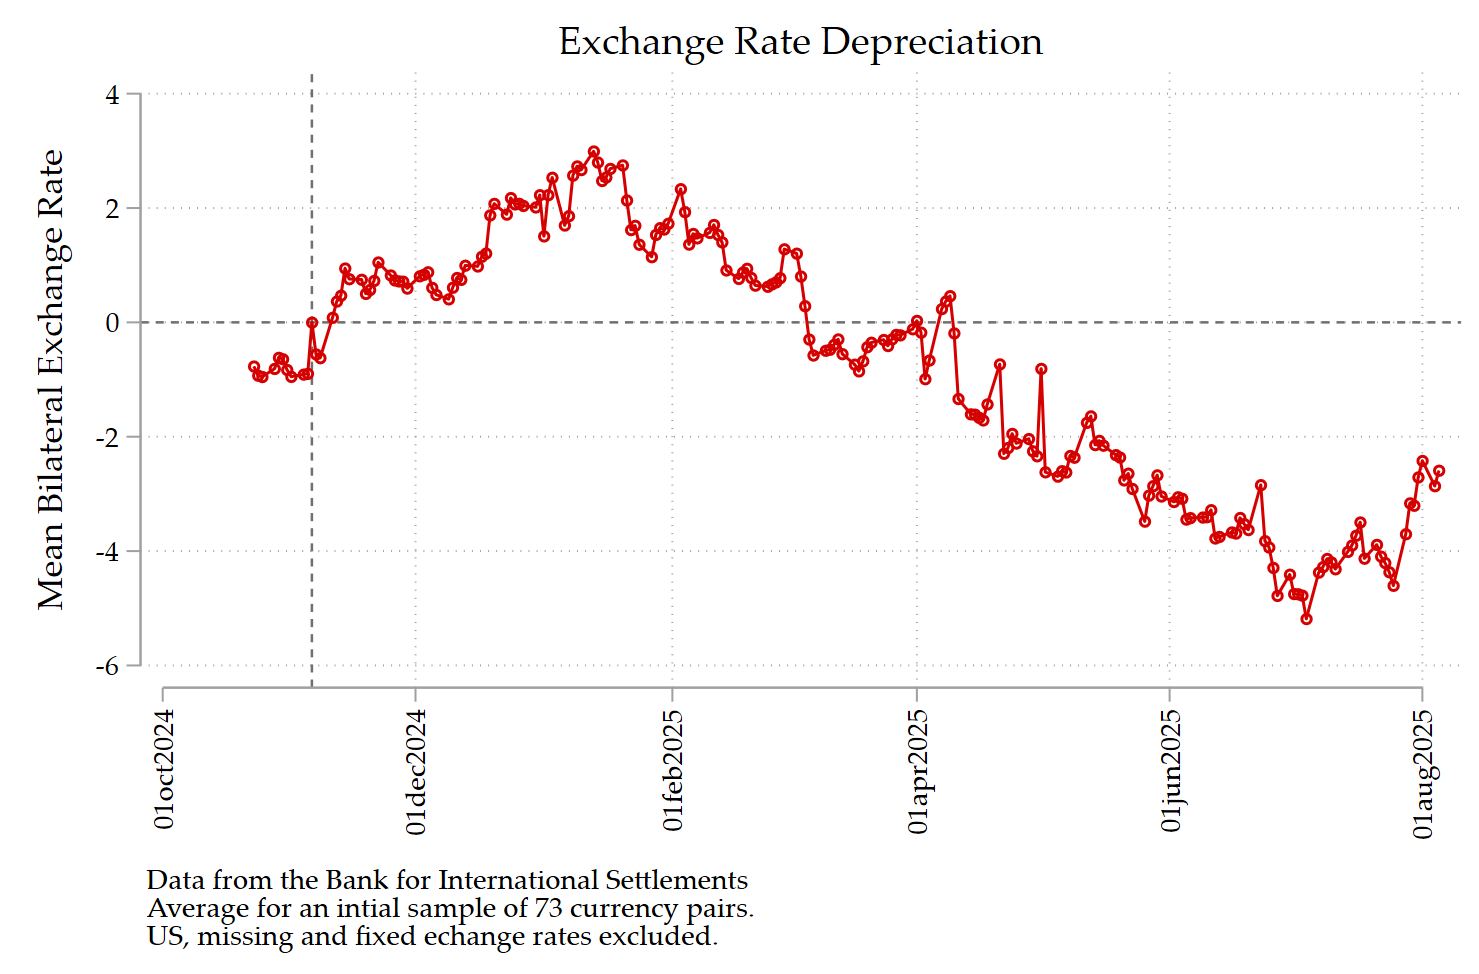
lgraph DXR date if date>=td(23oct2024) & ///
date<=td(5aug2025) ///
& imfcode!=111 & DXR!=. & DXR!=0, ///
yline(0) xlab(,angle(90)) xline(23686) ///
xti("") ti("Exchange Rate Depreciation") ///
note("Data from the Bank for International Settlements" ///
"Average for an intial sample of 73 currency pairs." ///
"US, missing and fixed echange rates excluded.")
save dailyXR8aug.dta, replace