Great news! Wolfram Research has launched a new function that could help to write a code in various languages: resources.wolframcloud.com/
This function requires that you have an account on the OpenAI site and to create an API key. A big thanks to Mario Veruete for showing me this.
I wanted to know whether this AI programming assistant would produce a code for a simple Monte Carlo simulation in Stata.
I entered the following question:
Write a working code in Stata for a Monte Carlo SimulationThe result was very impressive after two or three attempts:
Sure! Here's an example of how to run a Monte Carlo simulation in Stata:

stata
/* Set the number of simulations */
local nsim = 1000

/* Create an empty matrix to store the results */
matrix results = J(`nsim', 1, .)

/* Loop over the simulations */
forvalues i = 1/`nsim' {
    /* Simulate the data */
    clear
    set obs 100
    gen x = rnormal()
    gen y = 2*x + rnormal ()

    /* Estimate the model */
    reg y x

    /* Store the coefficient estimate */
    matrix results[`i',1] = _b[x]
}

/* Calculate the mean and standard deviation of the results */
return list mean = colmean(results), sd = colsd(results)

This code runs a Monte Carlo simulation to estimate the coefficient of a simple linear regression model with a normally distributed error term. The code first sets the number of simulations to run (nsim) and creates an empty matrix (results) to store the coefficient estimates from each simulation.

The code then enters a for loop that runs nsim simulations. For each simulation, it generates a random sample of 100 observations with a normally distributed error term and estimates the linear regression model y=b0+b1*x+e. The code stores the estimated coefficient for x in the results matrix.

After all simulations are completed, the code calculates the mean and standard deviation of the coefficient estimates using colmean and colsd, respectively, and returns them as a list.

Note that this is a very simple example and there are many variations of Monte Carlo simulations that can be run in Stata.
I asked for another example based on the following blog: https://blog.stata.com/2015/10/06/monte-carlo-simulations-using-stata/, but it was only a variation of the previous example. The colmean and colsd do not belong to the Stata ‘language’ so I asked him:
The following lines do not correspond to the Stata language:
/* Calculate the mean and standard deviation of the results */
return list mean = colmean(results), sd = colsd(results)
The answer:
You are correct, I apologize for the confusion. The code I provided earlier was not valid Stata syntax.

Here is the corrected version of the code that calculates the mean and standard deviation of the results and stores them in local macros:

stata
/* Set the number of simulations */
local nsim = 1000

/* Create an empty matrix to store the results */
matrix results = J(`nsim', 1, .)

/* Loop over the simulations */
forvalues i = 1/`nsim' {
    /* Generate random data */
    clear
    set obs 1000
    gen x = rnormal()
    gen u = rnormal(0, sqrt(4))
    gen y = 2 + 3*x + u

    /* Estimate the model */
    reg y x

    /* Store the coefficient estimate */
    matrix results[`i',1] = _b[x]
}

/* Calculate the mean and standard deviation of the results */
local mean = colmean(results)
local sd = colsd(results)

After all simulations are completed, this code calculates the mean and standard deviation of the coefficient estimates using colmean and colsd, respectively, and stores them in local macros mean and sd. These macros can be used later in the program or printed to the screen using the di command, for example:

stata
di "Mean: `mean'"
di "Standard deviation: `sd'"

I hope this clears up any confusion.
I had to ask one more time: colmean and colsd are not Stata functions
After a few iterations, I had something quite interesting:
You're right, I apologize for the mistake again. The return list line I provided is not correct.

Here is an updated version of the code that correctly stores the mean and standard deviation in local macros:

stata
/* Set the number of simulations */
local nsim = 1000

/* Create an empty matrix to store the results */
matrix results = J(`nsim', 1, .)

/* Loop over the simulations */
forvalues i = 1/`nsim' {
    /* Generate random data */
    clear
    set obs 1000
    gen x = rnormal()
    gen u = rnormal(0, sqrt(4))
    gen y = 2 + 3*x + u

    /* Estimate the model */
    reg y x

    /* Store the coefficient estimate */
    matrix results[`i',1] = _b[x]
}

/* Calculate the mean and standard deviation of the results */
summarize results
local mean = r(mean)
local sd = r(sd)

After all simulations are completed, this code uses the summarize command to calculate the mean and standard deviation of the coefficient estimates stored in the results matrix. The r(mean) and r(sd) macros are then used to store these values in local macros mean and sd, respectively.

You can print these values to the screen using the di command:

stata
/* Print mean and standard deviation to screen */
di "Mean: " `mean'
di "Standard deviation: " `sd'

I hope this clears up any confusion.
I could continue by signaling that the results have to be transferred from the matrix. But, I corrected myself the code to obtain the final version in Stata.
clear
/* Set the number of simulations */
local nsim = 1000
/* Create an empty matrix to store the results */
matrix results = J(`nsim', 1, .)
/* Loop over the simulations */
forvalues i = 1/`nsim' {
/* Simulate the data */
clear
set obs 100
gen x = rnormal()
gen y = 2*x + rnormal()
/* Estimate the model */
reg y x
/* Store the coefficient estimate */
matrix results[`i',1] = _b[x]
}
/* Store the results in a matrix */
matrix list results
svmat double results, name(results)
/* Calculate the mean and standard deviation of the results */
sum results, detail
return list
/* Store mean and standard deviation in local macros */
local mean = r(mean)
local sd = r(sd)
/* Print mean and standard deviation to screen */
di "Mean: " `r(mean)'
di "Standard deviation: " `r(sd)'
/* Distribution of the estimates */
set scheme white_tableau
capture drop pres
pctile pres = results, nquantiles(1000)
return list
scalar p025 = r(r25)
scalar p975 = r(r975)
display `r(r25)'
display `r(r975)'
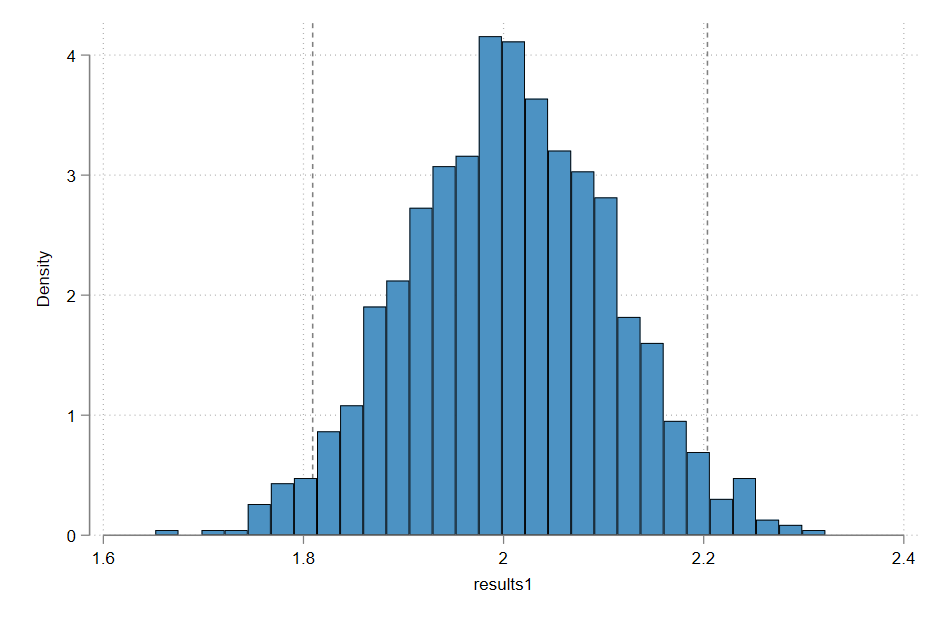
histogram results, xline(`r(r25)' `r(r975)')
graph export "C:\Users\jamel\Dropbox\stata\0_AI\Graph.png", ///
as(png) name("Graph") replace
/* The end */ In the following, we have the distribution of the 1000 point estimates:
I think we will still need to hire programming assistants in the future, but the work will radically change.
Please note that the files for replicating this blog are available here: https://github.com/
1 Comment
[…] this blog, I will use the new Wolfram function AIAssistant, that I discussed in another more recent blog, to illustrate the sample variance bias in R and in […]