This is my first-ever blog on Machine Learning! A major novelty in the latest version of Stata, Stata 19, is the implementation of Machine Learning. Today, I will use the data coming from this paper to make a pedagogical demonstration.
Key Takeaways
- You can run modern ML from Stata by connecting to an H2O cluster with the
h2o,h2oframe, andh2omlcommand families; Stata talks to H2O through its REST API. - On an annual country panel (1970–2017), the currency crisis dummy is rare (≈2.63% positives), so we tune on F1 and read AUC‑PR alongside AUC. Our tuned Random Forest attains CV AUC ≈ 0.837, AUC‑PR ≈ 0.144, roughly 5.5× the random baseline prevalence (≈0.026).
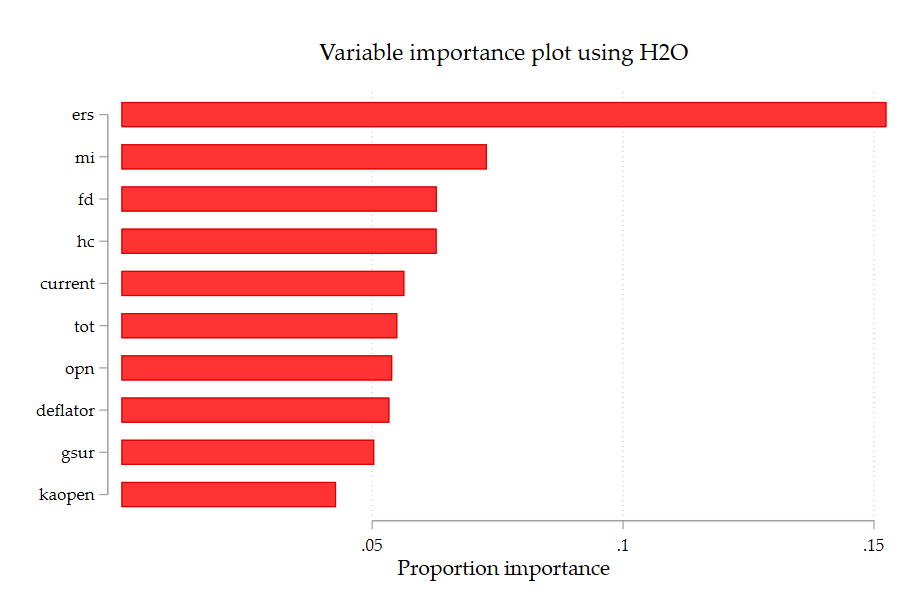
- Exchange‑rate stability (ERS) is the most important predictor in the forest; monetary independence (MI), financial development (FD), trade and macro controls matter too—but less. (See the variable‑importance plot below.)
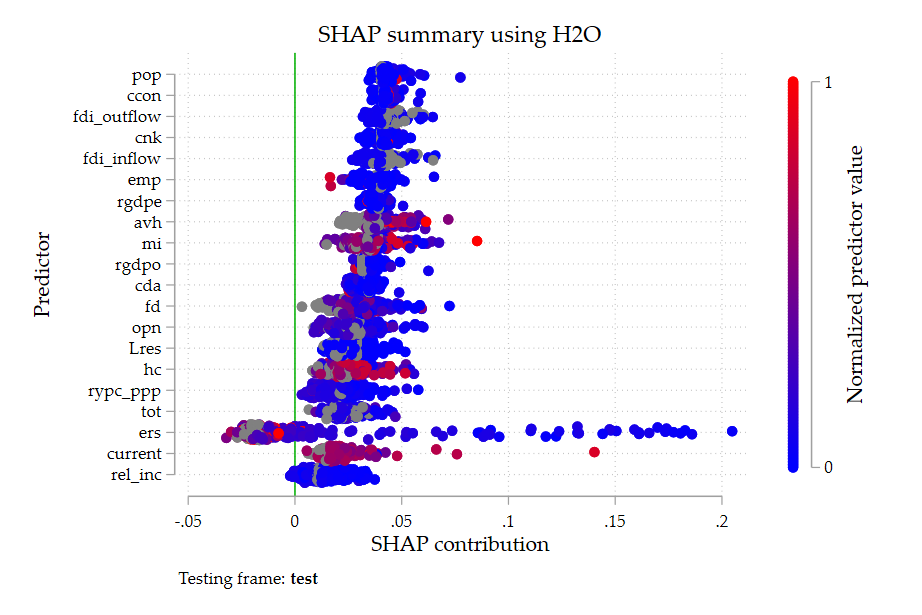
- SHAP values make the model interpretable at the observation level. High ERS values lower crisis risk in the model, which squares with the trilemma logic (stable exchange rates reduce crash odds when monetary conditions are credible).
- The whole workflow—data prep → H2O frames → grid search → diagnostics (VarImp & SHAP)—is reproducible from a short Stata script.
What I did (in Stata)
We load a standard macro‑finance panel, define a currency‑crisis indicator, and pass the data to H2O. We then split into training and test frames and run an H2O Random Forest tuned on F1 over ntrees ∈ {40,50,60} and maxdepth ∈ {15,20,25}. The selected model uses 60 trees and depth 20.
Why H2O from Stata? H2O‑3 is an open‑source, in‑memory ML engine; Stata’s integration lets you start/connect to a cluster and build models without leaving Stata.
Why Random Forest? It is a strong, variance‑reducing ensemble for tabular data that handles nonlinearities and interactions out of the box.
Why F1 / AUC‑PR? With crises so rare (≈2.63% of observations), overall accuracy is uninformative; F1 and AUC‑PR focus the search on identifying the minority class. (Our cross‑validated AUC‑PR ≈ 0.144 is ~5.48× the base rate.)
Model metrics (3‑fold CV)
- AUC: 0.8369
- AUC‑PR: 0.1442
- Mean per‑class error: 0.3233
- Log loss: 0.1195
- Best grid: 60 trees, depth 20 (F1 ≈ 0.275)
What drives crisis risk? Evidence from ML interpretability
1) Global importance: ERS dominates
The forest leans heavily on ERS (exchange‑rate stability), followed by MI (monetary independence) and FD (financial development). This aligns with the trilemma intuition: regimes with more stable exchange rates and credible monetary frameworks see fewer currency crashes, while shallow finance and adverse external conditions raise risk. The VarImp score captures how often and how strongly a variable reduces out‑of‑bag loss across trees; it is model‑specific and scale‑free.
2) Local effects: SHAP tells us how features move predictions
The SHAP summary shows, for each observation, the signed contribution of each predictor to the log‑odds of a crisis (red = higher normalized value, blue = lower). Two robust patterns stand out:
- ERS: high ERS (red) clusters on the negative side—stability lowers crisis probability in the model.
- Wide support elsewhere: MI, FD, trade openness, terms of trade, reserves, current‑account balance, and inflation proxies all contribute but with smaller magnitudes and heterogeneous signs across countries/years.
SHAP complements VarImp: VarImp ranks features, while SHAP shows direction and heterogeneity at the unit level.
What this means for applied macro‑finance
- Policies that sustain exchange‑rate stability and credible monetary conditions are central to crisis prevention—exactly what the trilemma framework would predict.
- Interpretable ML gives both forecasting lift (AUC‑PR well above baseline) and economic stories (SHAP‑based signs and heterogeneity).
- Next steps for practitioners. Class imbalance can be addressed further by H2O’s class balancing/weights; try threshold calibration for the chosen loss function, GBM/XGBoost, time‑aware splits, and out‑of‑sample tests by decade or region.
Conclusion
Running H2O‑3 from within Stata makes it straightforward to bring modern ML to classic macro‑finance questions. On a highly imbalanced currency‑crisis panel, a tuned Random Forest delivers meaningful lift and interpretable drivers—with ERS doing most of the heavy lifting and MI/FD/external balances providing additional signal. The combination of VarImp and SHAP turns the black box into an analytical tool you can discuss with policymakers and students alike.
References
Aizenman, J., Chinn, M. D., & Ito, H. (2008). Assessing the emerging global financial architecture: Measuring the trilemma’s configurations over time (No. w14533). National Bureau of economic research.
Papadimitriou, T., Gogas, P., Sofianos, E., Giannakis, N. & Saadaoui, J. (2025), Do International Reserve Holdings Still Predict Economic Crises? Insights from Recent Machine Learning Techniques. Available at SSRN 5237256.
H2O‑3 platform. Welcome to H2O‑3; Distributed Random Forest; Performance and Prediction (explainability); SHAP summary plot docs.
Stata × H2O integration. H2O setup manual and feature overview.
Code
**# Start of the program

// Clear the data

cls
clear

// Start a log file

capture log close _all
log using blog, name(blog) smcl replace

// Choose the current directory

cd C:\Users\jamel\Dropbox\Latex\PROJECTS\
cd 22-12-fin-openness-machine-learning\data\

// Download the latest H2O release

*https://h2o-release.s3.amazonaws.com/h2o/rel-3.46.0/7/index.html

// Put the .jar file into you personal folder (Mine is "C:\Users\jamel\ado\personal/")

*adopath

**# H2O machine learning
use cis_annual_data12262022.dta, clear
drop if year<1970 | year>2017
drop if currency_unit == ""
replace currency=0 if currency==.
xtset cn year
keep cn year currency current res deflator fd kaopen opn tot ers mi hc rgdpo rgdpe pop emp avh hc ccon cda cnk rypc_ppp rel_inc gsur fdi_inflow fdi_outflow
gen Lres = l.res
h2o init
_h2oframe put, into(cis) replace
_h2oframe change cis
_h2oframe describe
_h2oframe toenum currency, replace
_h2oframe describe
_h2oframe split cis, into(train test) replace
_h2oframe change train
h2oml rfbinclass currency current Lres deflator fd kaopen opn tot ers mi hc rgdpo rgdpe pop emp avh hc ccon cda cnk rypc_ppp rel_inc gsur fdi_inflow fdi_outflow, cv(3) ///
 ntrees(40 50 60) maxdepth(15 20 25) tune(metric(f1))
h2omlestat gridsummary
h2omlpredict pred_currency, class frame(cis)
h2omlpostestframe test
h2omlgraph varimp
h2omlgraph shapsummary

////////////////////////////////////////////////////////////////

// Close the log file

log close blog
exit

**# End of the program