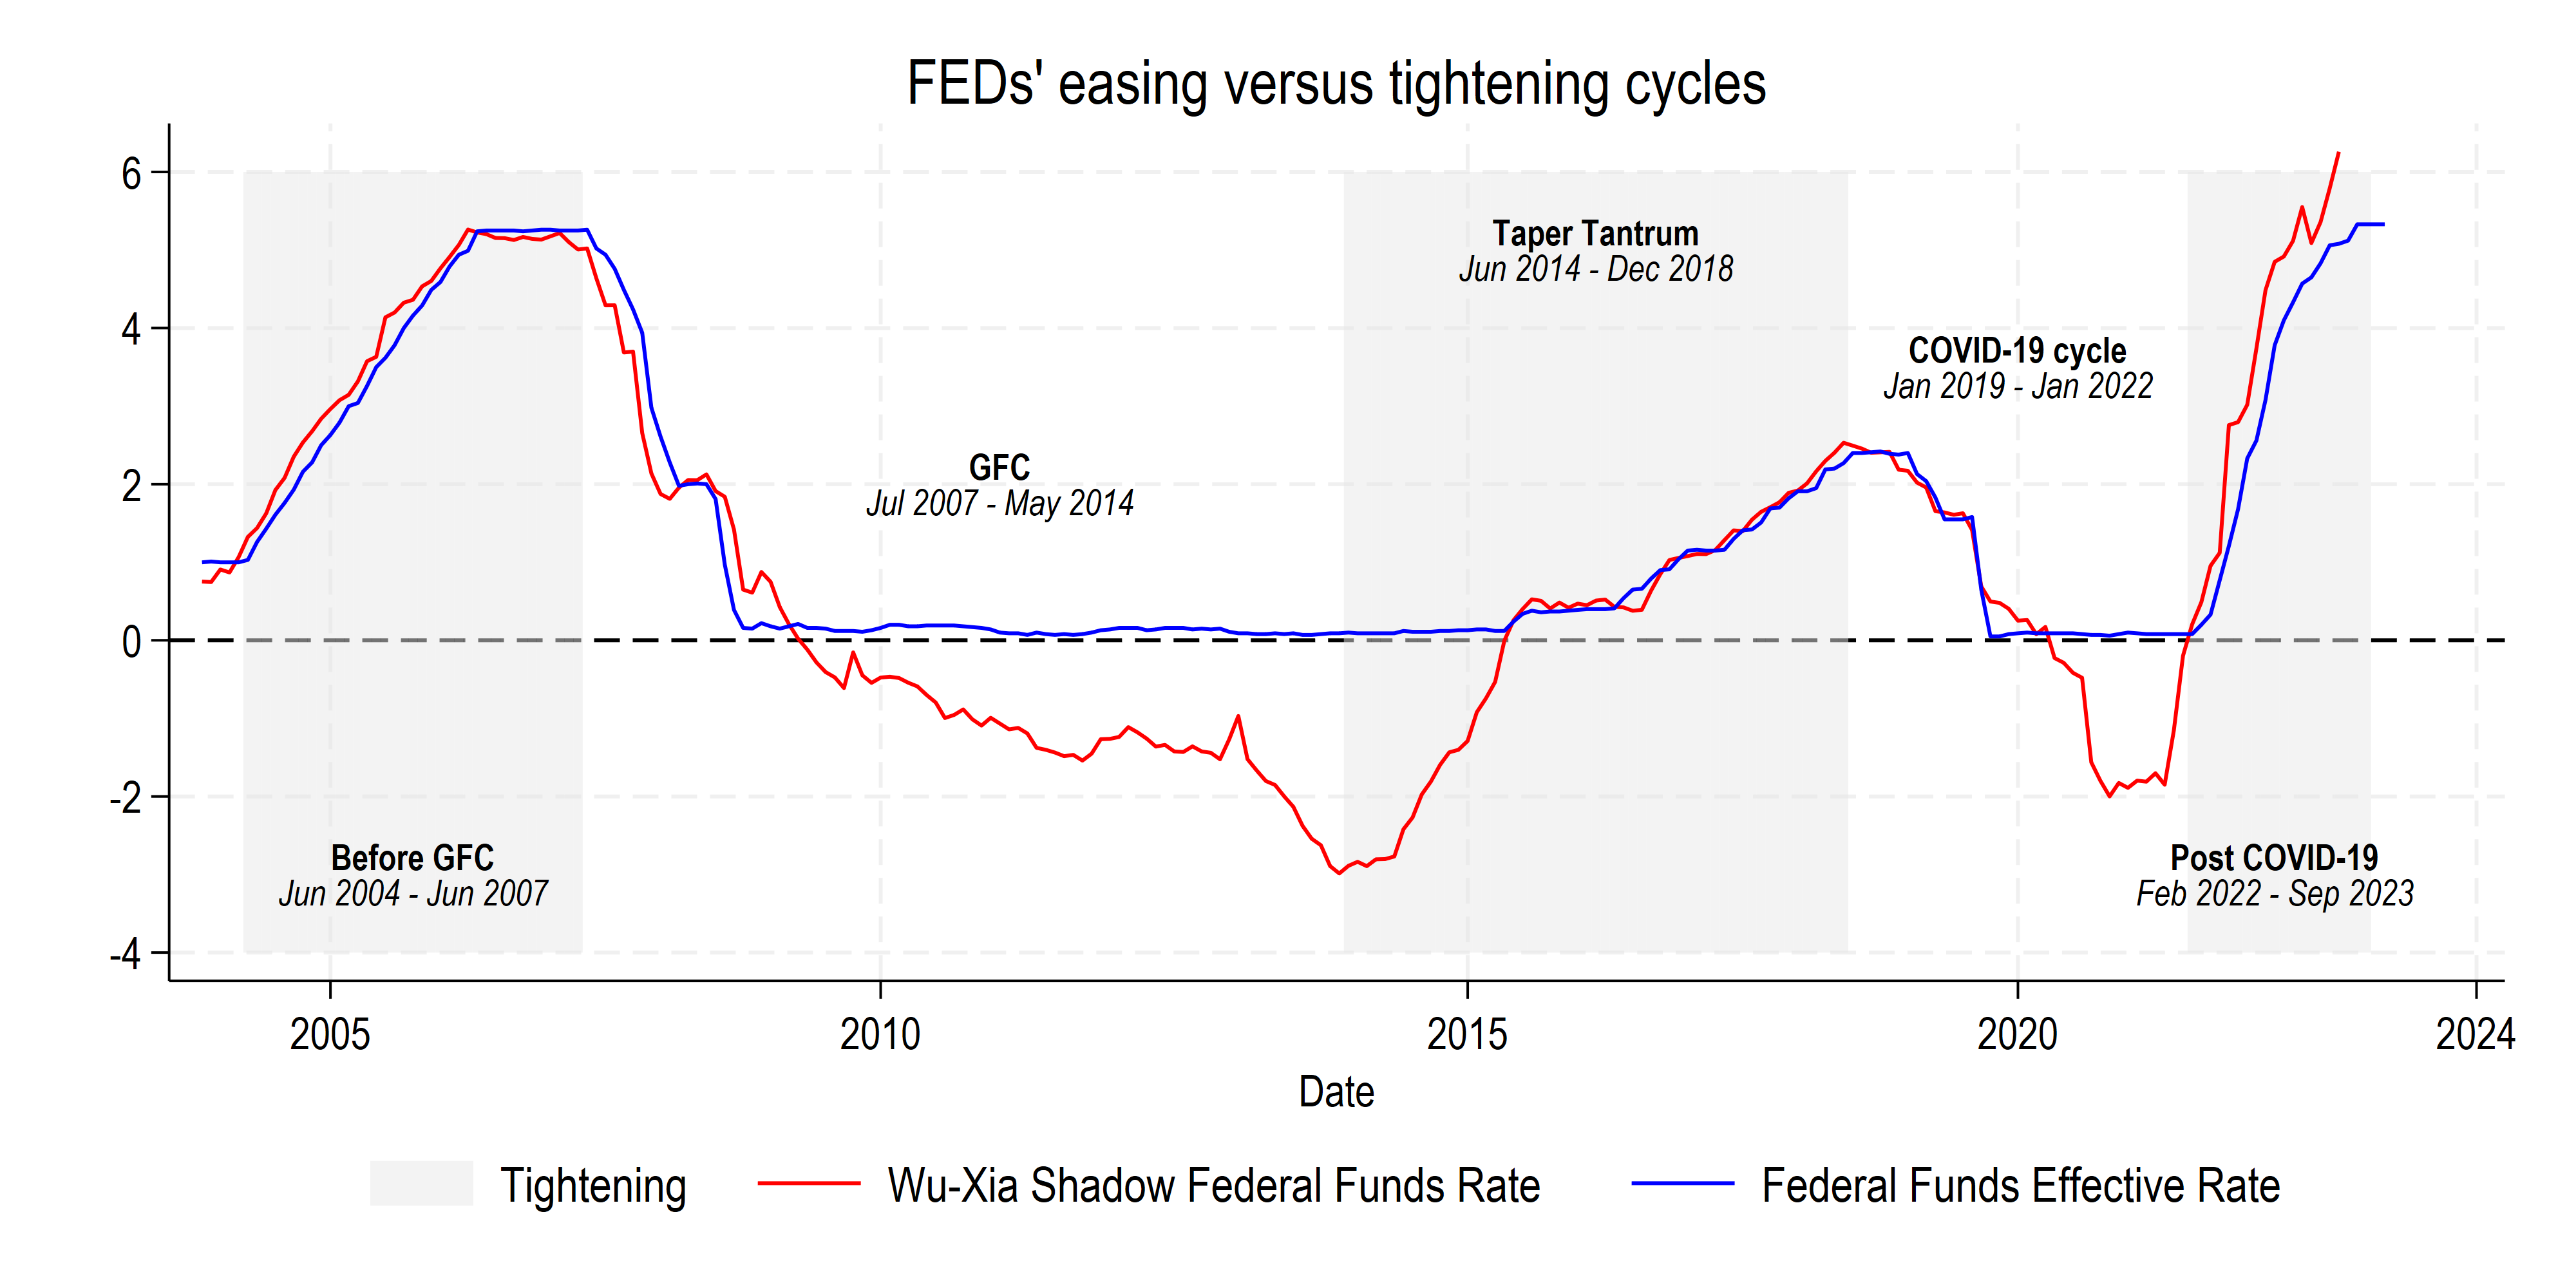
In the following working paper, we assess the relative resilience of emerging countries during US monetary cycles. One possible measure of resilience is the number of months to reach the peak depreciation:
https://www.nber.org/papers/w32303
This measure of resilience has been suggested by one of the participants of the ABD-PIER conference that took place in Bank of Thailand in May 2024:

Let us take a look at how to compute the peak depreciation in months for the first US monetary policy cycle, which lasted 36 months. Start by keeping the dates for the cycle, and keep the “local” min and the max for the exchange rate:
// Compute time to peak devaluation
keep if period>=tm(2004m7)
keep if period<=tm(2007m6)
*ssc install rangestat
rangestat (max) UXR, int(period . 0) by(imfcode)
rangestat (min) UXR, int(period . 0) by(imfcode)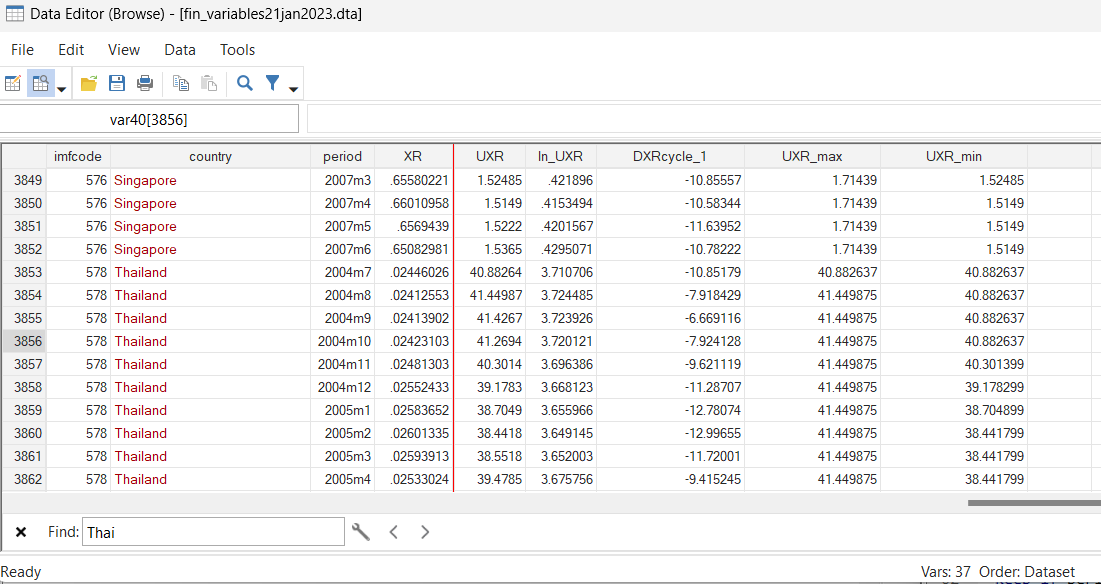
Compute the difference to the max of the depreciation series UXR (1 USD = UXR Domestic currency) and the “local” max series. Then, generate a dummy that will capture the fact that the series has not yet reached the peak depreciation. Finally, use the sum function to compute the number of months for reaching peak depreciation:
by imfcode: egen max_maxUXR = max(UXR_max)
by imfcode: gen maxminusmaxUXR = max_maxUXR - UXR_max
by imfcode: gen timetopeak = 0
by imfcode: replace timetopeak = 1 if maxminusmaxUXR != 0
by imfcode: egen cum_timetopeak = sum(timetopeak)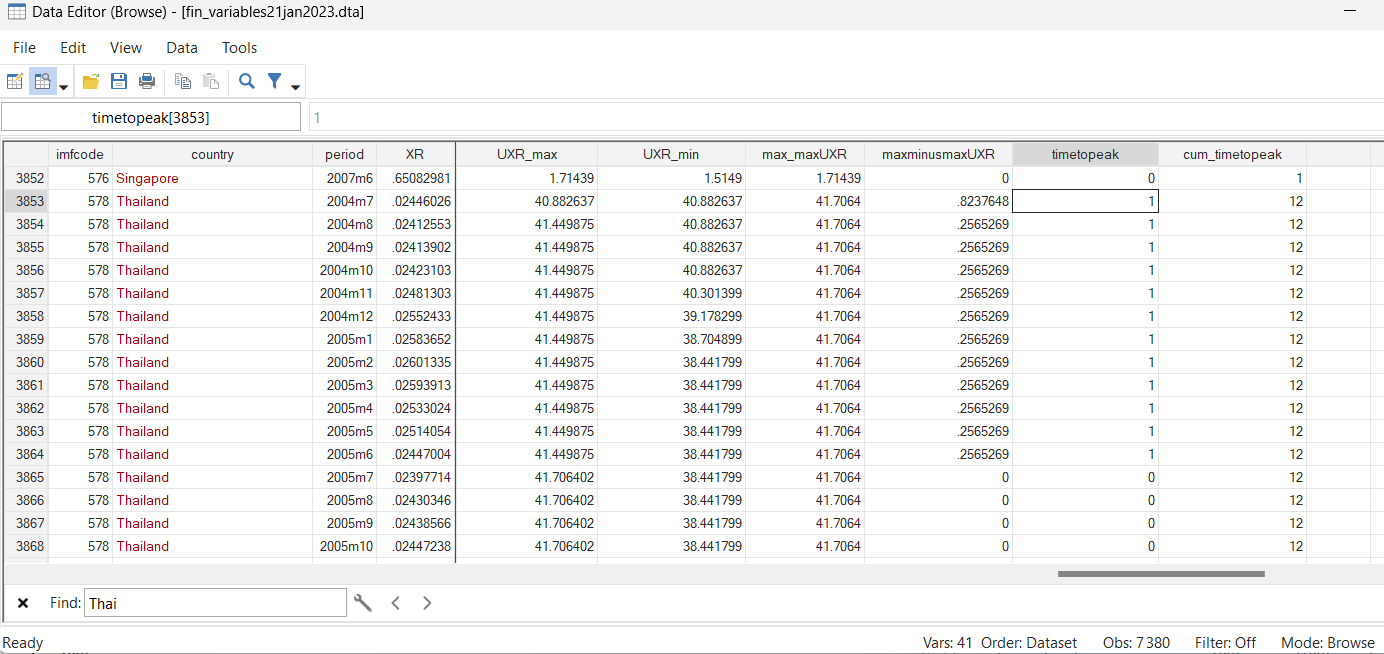
Besides, we can draw a plot to visualize that Thailand reached peak depreciation 12 months after the beginning of the monetary cycle:
labmask imfcode, values(country)
xtline UXR UXR_max if country=="Thailand", name(time, replace)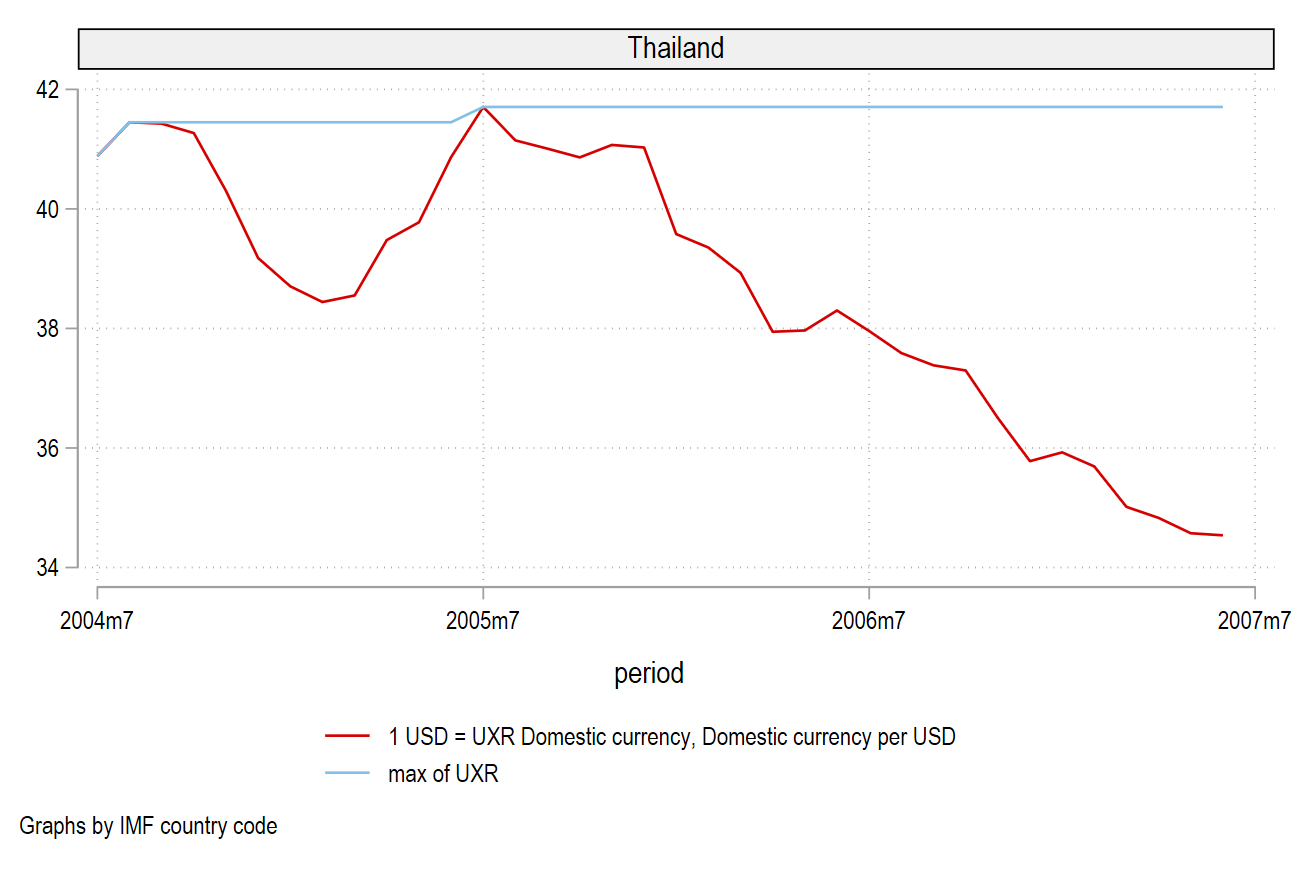
To conclude, we can plot the depreciation during the episode and the number of months to reach the peak depreciation:
label variable cum_timetopeak "Number of Months to Peak Depreciation"

keep if period==tm(2007m6)

twoway (scatter DXRcycle_1 cum_timetopeak if ///
 DXRcycle_1<50 & DXRcycle_1>-50, mlabel(imfcode) ///
plotregion(margin(large)) graphregion(margin(l+10 r+10))) 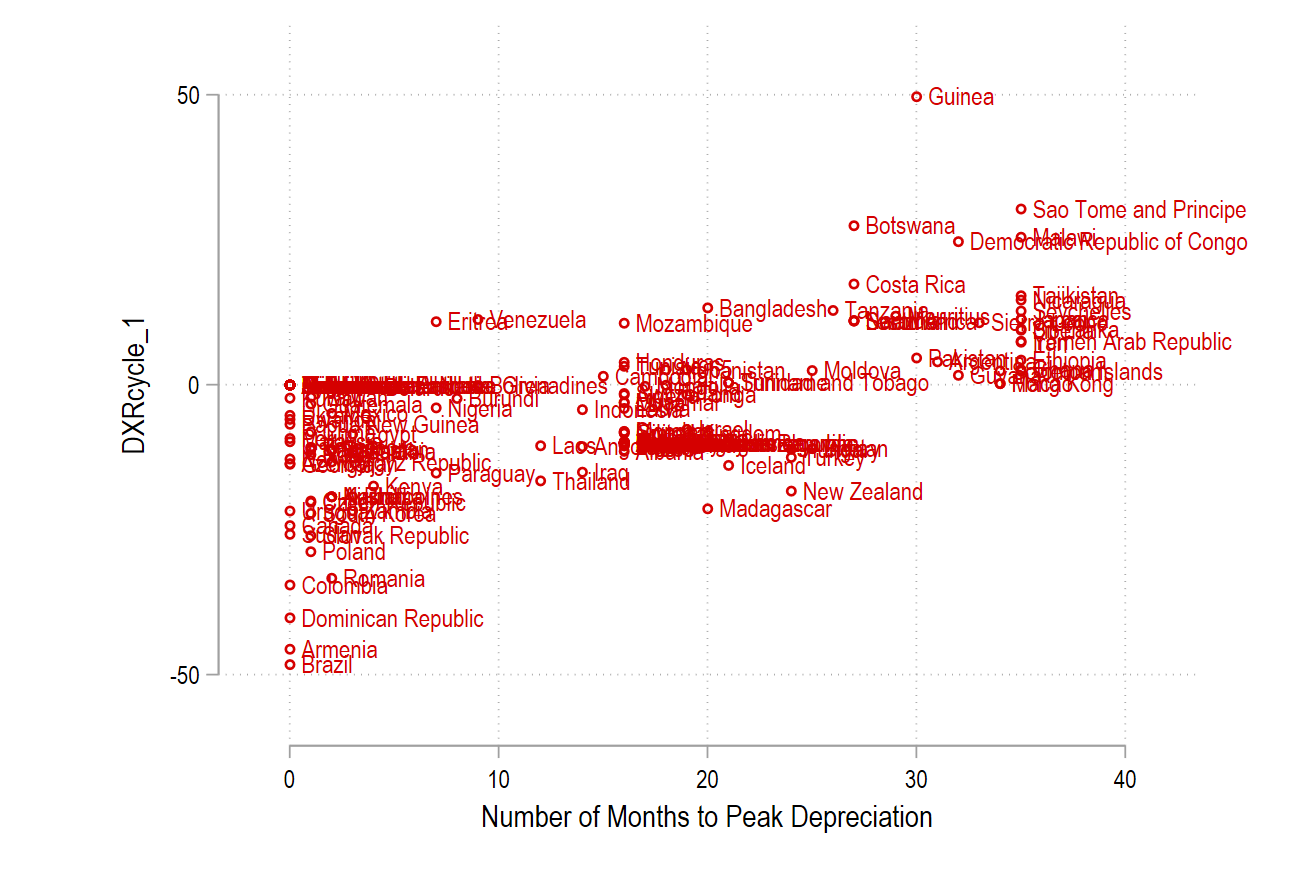
Thailand has known an overall appreciation during this cycle and reached the peak depreciation 12 months after the initial entry in the cycle. The sooner the country reach peak depreciation, the more resilient it is.
I was inspired by Nicholas J. Cox’s Stata Blog post:
https://www.stata.com/support/faqs/data-management/maximum-and-minimum-of-sequence
11 Comments
[…] over the recent period, reflecting sustained engagement with policy-relevant empirical work: at the Bank of Thailand in May 2024 (during the ABD-PIER conference), the Bank of France in October 2024 (during a visiting […]
[…] over the recent period, reflecting sustained engagement with policy-relevant empirical work: at the Bank of Thailand in May 2024 (during the ABD-PIER conference), the Bank of France in October 2024 (during a visiting […]
[…] over the recent period, reflecting sustained engagement with policy-relevant empirical work: at the Bank of Thailand in May 2024 (during the ABD-PIER conference), the Bank of France in October 2024 (during a visiting […]
[…] over the recent period, reflecting sustained engagement with policy-relevant empirical work: at the Bank of Thailand in May 2024 (during the ABD-PIER conference), the Bank of France in October 2024 (during a visiting […]
[…] over the recent period, reflecting sustained engagement with policy-relevant empirical work: at the Bank of Thailand in May 2024 (during the ABD-PIER conference), the Bank of France in October 2024 (during a visiting […]
[…] over the recent period, reflecting sustained engagement with policy-relevant empirical work: at the Bank of Thailand in May 2024 (during the ABD-PIER conference), the Bank of France in October 2024 (during a visiting […]
[…] Computing the number of months to reach peak depreciation during a monetary cycle […]
[…] Computing the number of months to reach peak depreciation during a monetary cycle […]
[…] Computing the number of months to reach peak depreciation during a monetary cycle […]
[…] Computing the number of months to reach peak depreciation during a monetary cycle […]
[…] Computing the number of months to reach peak depreciation during a monetary cycle […]