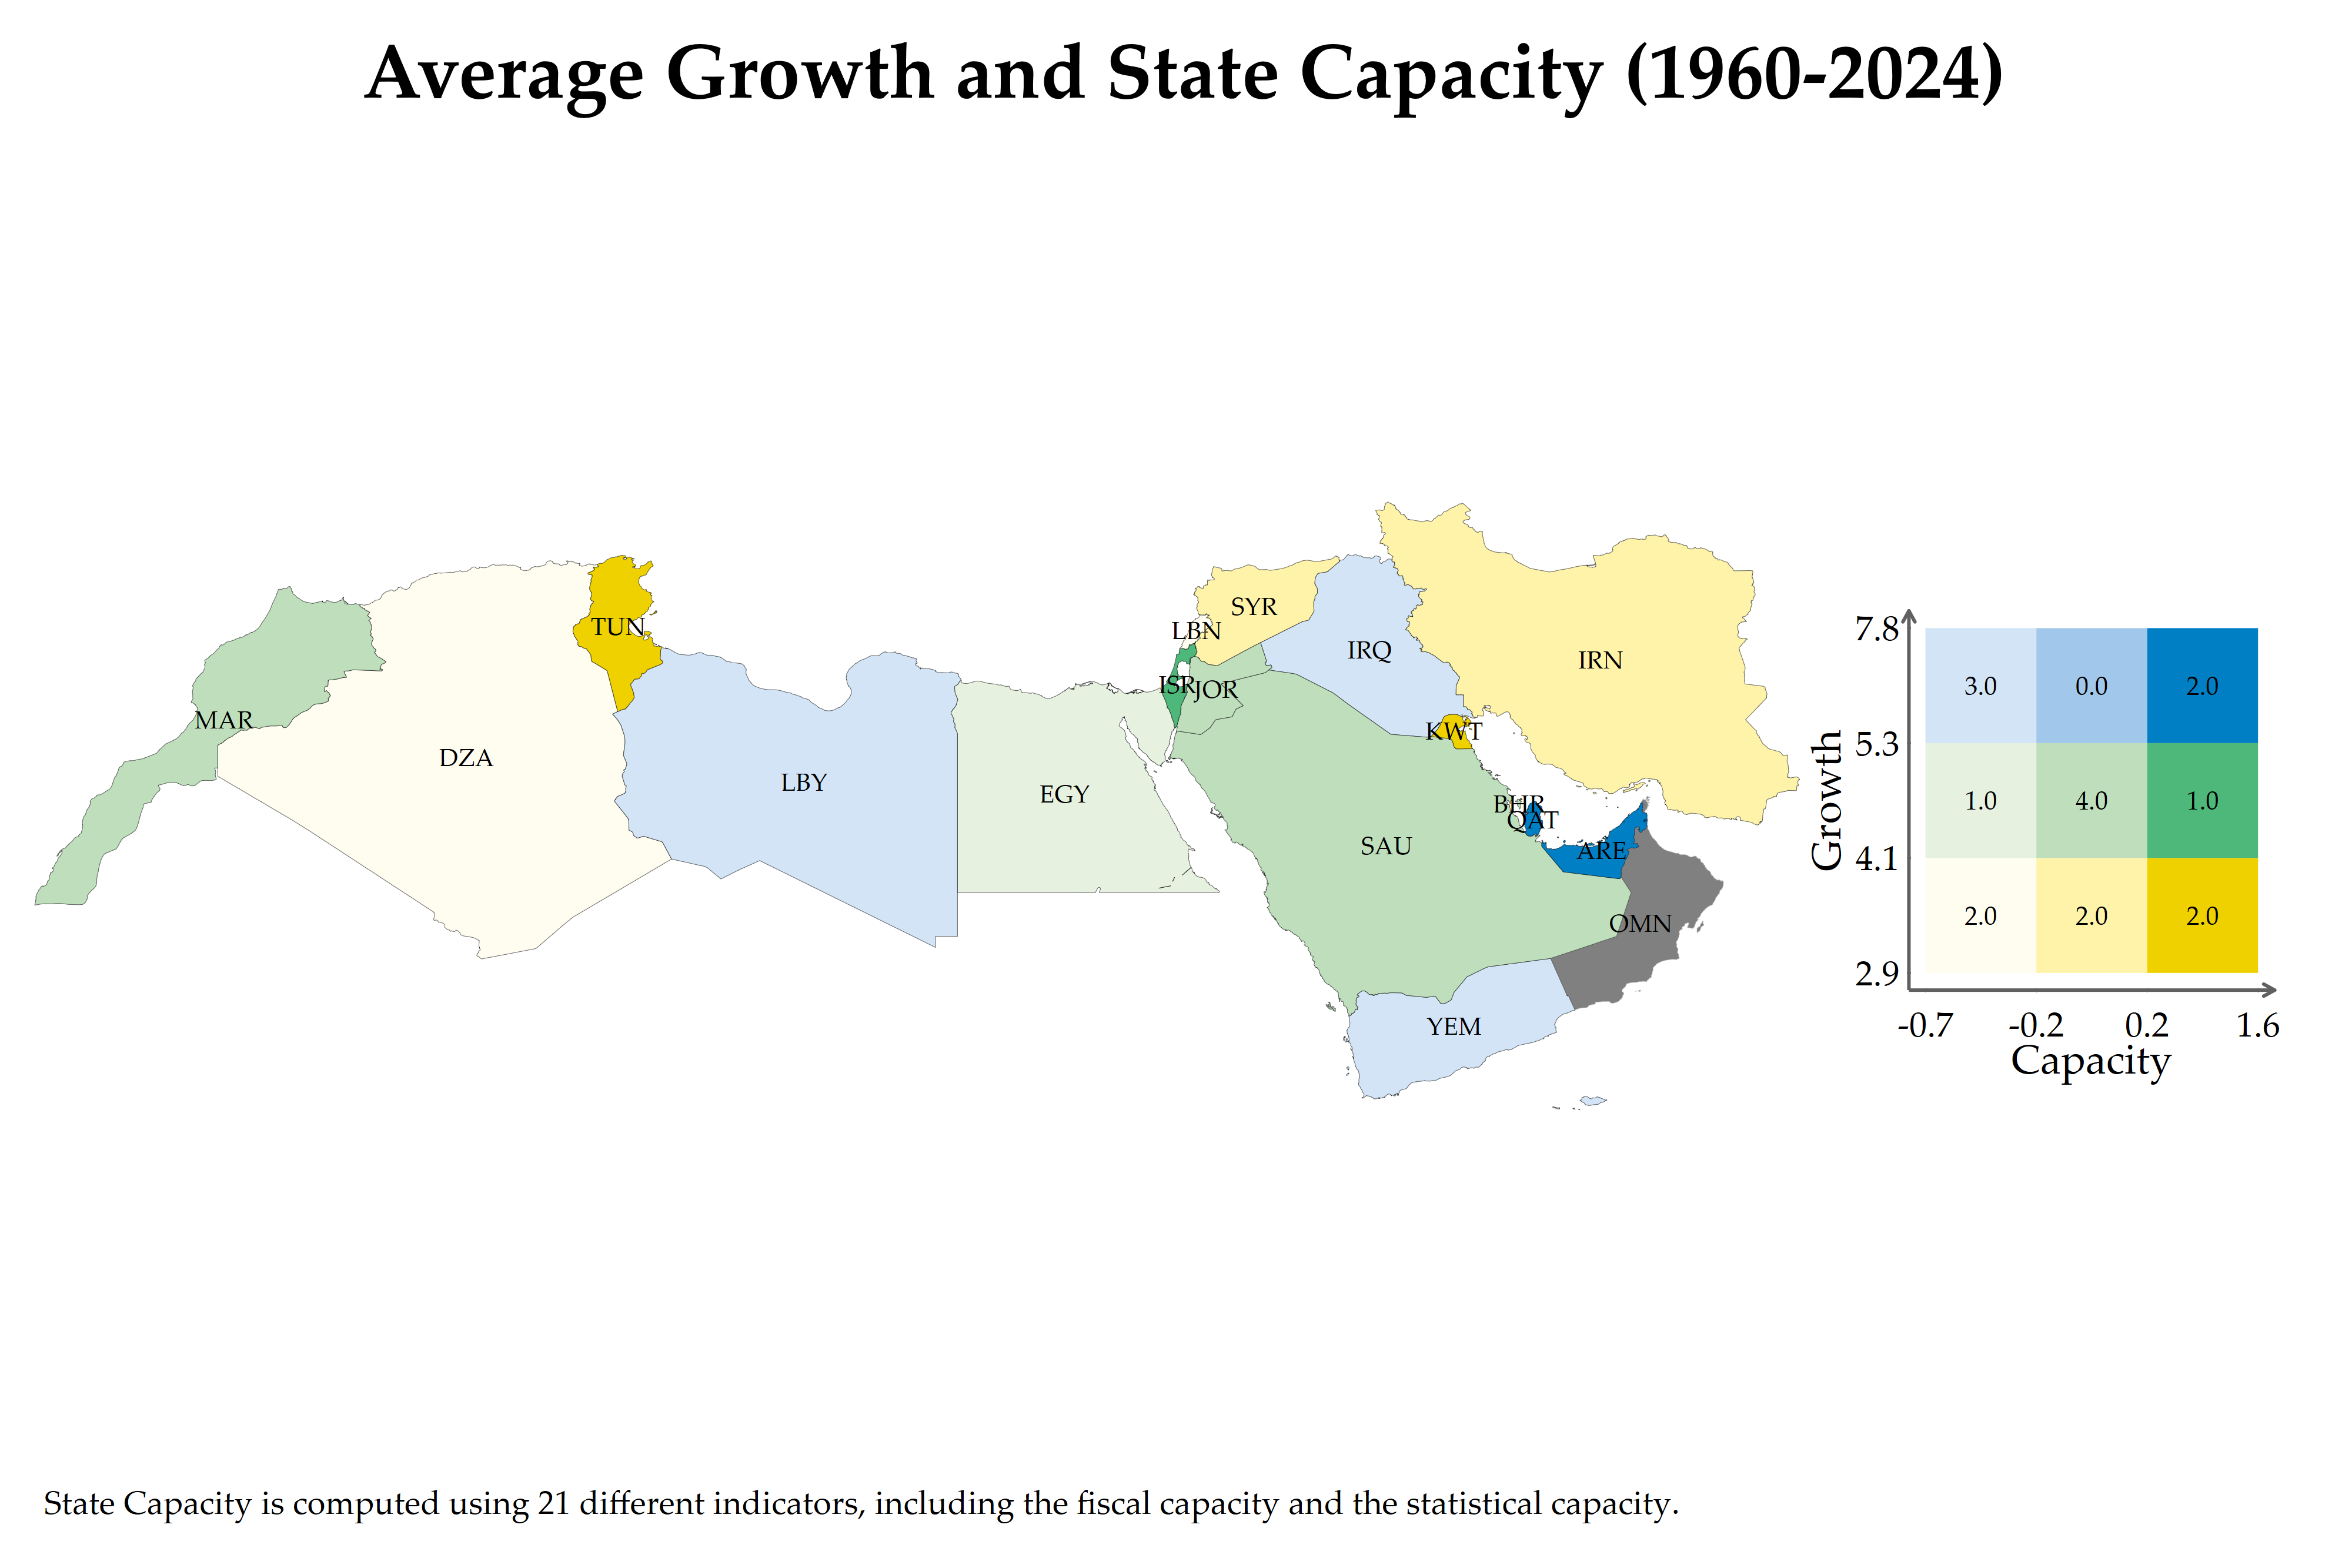
After a map for Asia, the present example focuses on the joint distribution of economic growth and state capacity over the period 1960 to 2024. The result provides an intuitive representation of the spatial pattern of growth and administrative effectiveness in the region.
Key takeaways
- The MENA region does not follow a flying geese pattern because it never experienced a coordinated export-oriented industrial sequence. Instead, its long run distribution of growth and state capacity reflects distinct political economy models that emerged after independence.
- The resource-rich Gulf economies form a first group. Their long run growth is driven by hydrocarbon rents and large public investment, while their administrative effectiveness varies. This places them in the upper and intermediate capacity cells of the map and explains the internal diversity within the Gulf Cooperation Council.
- A second group includes the North African countries that adopted import substitution industrialization. Algeria, Egypt, and Tunisia pursued extensive state led industrial strategies behind protective barriers. These policies created periods of industrialization but also generated persistent productivity constraints and fiscal pressures. Their long-run averages therefore combine moderate growth with intermediate state capacity.
- A third group consists of the conflict-affected economies in the Levant and Yemen. Prolonged instability, destruction of infrastructure, and political fragmentation have eroded both growth performance and administrative capability. These countries cluster in the lower growth and lower capacity segment of the map.
- Together, these three models explain why the MENA region displays stable structural clusters rather than a sequential industrial upgrading path. Resource dependence, the legacy of import substitution, demographic pressure, and conflict exposure shape the positions that countries occupy on the bivariate grid.
The country-level averages reflect structural patterns that are specific to the MENA region rather than a sequential industrial upgrading process. The region does not follow a flying geese trajectory because it lacks the coordinated export-oriented manufacturing diffusion characteristic of East Asia. Instead, the long-run interaction between growth and state capacity is structured around several political economy models that have coexisted since the post-independence period.
A first group consists of the resource-rich Gulf economies. Their growth performance is driven by hydrocarbon rents, high public investment, and large-scale redistributive systems. Although their administrative effectiveness varies, these states generally exhibit relatively strong fiscal capacity supported by resource revenue. This leads them to occupy upper or intermediate capacity cells in the bivariate map. The differences within the Gulf reflect variation in the depth of bureaucratic development and the degree to which states have diversified away from hydrocarbons.
A second group includes the North African countries, several of which pursued import substitution industrialization after independence. Economies such as Algeria, Egypt, and Tunisia implemented extensive state-led industrial strategies that favored domestic production behind protective barriers. Although these strategies generated periods of industrial expansion, they also produced persistent productivity constraints, limited export capacity, and heavy burdens on state-owned enterprises. Over the long run these structural features contributed to moderate growth outcomes and intermediate levels of state capacity. The bivariate map reflects this balanced but constrained trajectory. These states have maintained functioning administrative and fiscal systems, yet growth has been tempered by demographic pressures, limited private sector dynamism, and the gradual dismantling of import substitution regimes.
A third group comprises the conflict-affected economies of the Levant and Yemen. These countries display weaker outcomes in both growth and capacity due to prolonged instability, destruction of public infrastructure, and recurring political crises. Conflict has undermined bureaucratic effectiveness and constrained productive capacity. This results in a distinct cluster on the map, with low growth and low capacity values that reflect the cumulative impact of instability.
Taken together, these structural configurations explain the pattern observed in the bivariate map. The region does not display a unified industrial ladder or a coordinated process of sequential upgrading. Instead, its long-run distribution is shaped by resource dependence, the legacy of import substitution industrialization, demographic trends, and the consequences of conflict. The map therefore captures the internal diversity of the MENA region while remaining consistent with its historical political economy foundations.
The full code is reproduced below:
**# Create the maps

cd C:\Users\jamel\Dropbox\Latex\PROJECTS\25-10-adbi-comparative-advantage\data\Database\Maps

spshape2dta ne_10m_admin_0_countries, replace

use ne_10m_admin_0_countries.dta, replace
kountry ADM0_A3, from(iso3c) to(imfn)

rename _IMFN_ imfcode
order imfcode ADM0_A3, first

replace imfcode=998 if ADM0_A3=="SDS"
replace imfcode=999 if ADM0_A3=="PRK"

drop if imfcode==.

save maps.dta, replace

**# Merge with the resilience variables

use maps.dta, clear

merge 1:1 imfcode using World_map.dta, nogenerate

// Oman
replace mena=1 if imfcode==449

save world_map.dta, replace

// Use the NZ shapefile because of the IDL

gen GR = 100*growth

format GR  %4.1f

**# Map - MENA

// Oman
replace mena=1 if imfcode==449

preserve

keep if mena==1

grmap GR using ne_10m_admin_0_countries_shp.dta ///
 if mena==1, id(_ID)  ///
 fcolor(Reds) osize(vvthin ..) ///
 ndsize(vthin) clnumber(6)  ///
 ndfcolor(gray%50 ..) ndocolor(white ..) ///
 title("{bf: Average Growth (1960-2024)}") ///
note("More red colors indicate a stronger growth.", ///
  size(vsmall)) label(xcoord(_CX) ycoord(_CY) ///
 label(ADM0_A3) size(*.5))

graph rename Graph GRM, replace

graph export GRM.png, as(png) replace width(4000)

restore

** Bivariate Map - MENA

set scheme white_tableau

geoframe create capital world_map.dta, coord(_CX _CY) replace

geoframe create mena ///
 world_map.dta, id(_ID) ///
 coord(_CX _CY) ///
 shp(ne_10m_admin_0_countries_shp_nz.dta) ///
 replace
/// Replace shpfile() by shp()

geoframe describe mena

frame change mena

gen GR = 100*growth
format GR  %4.1f

preserve

// Oman
replace mena=1 if imfcode==449

keep if mena==1

bimap GR Capacity, frame(mena) cut(pctile) ///
    palette(census) lc(black) lw(0.03) ///
    geo( (label capital ADM0_A3 if mena==1, color(black) size(vsmall) ) ) ///
    polygon(data("ne_10m_admin_0_countries_shp") ///
        select(keep if mena==1) ocolor(black) osize(0.05) lcolor(black)) ///
    title("{bf: Average Growth and State Capacity (1960-2024)}") ///
	note("State Capacity is computed using 21 different indicators, including the fiscal capacity and the statistical capacity.", size(vsmall)) ///
    texty("Growth") textx("Capacity") texts(3.5) textlabs(3) count

graph rename Graph GR2M, replace

graph export GR2M.png, as(png) replace width(4000)

restore


**# End of Program