If you are familiar with the impulse response function (IRF) analysis with Stata, you might have encountered an annoying problem. When you plot an IRF, you will have additional notes by default to read the graphs when you have multiple panels in a multivariate system. This particularly helpful to read the IRF after estimating a VAR. The code is reproduced below and the created figure too:
**# Local Projections

irf set myirf.irf, replace

foreach x in SWE NLD DEU ITA FRA ESP PRT GBR CAN USA {
* Full sample
lpirf LECPC_GJ_`x', ///
      lags(1/2) ///
      exog(L(0/1).LRGDPPC_`x') ///
      step(21) vce(hac nw 1)
irf create lpmodel_`x'
irf graph dm, impulse(LRGDPPC_`x') ///
      response(LECPC_GJ_`x') ///
      irf(lpmodel_`x') level(95) ///
      yline(0) name(`x', replace) ///
	  xti("") ///
	  ysize(4) xsize(4) legend(cols(2))

graph export `x'.png, as(png) replace

}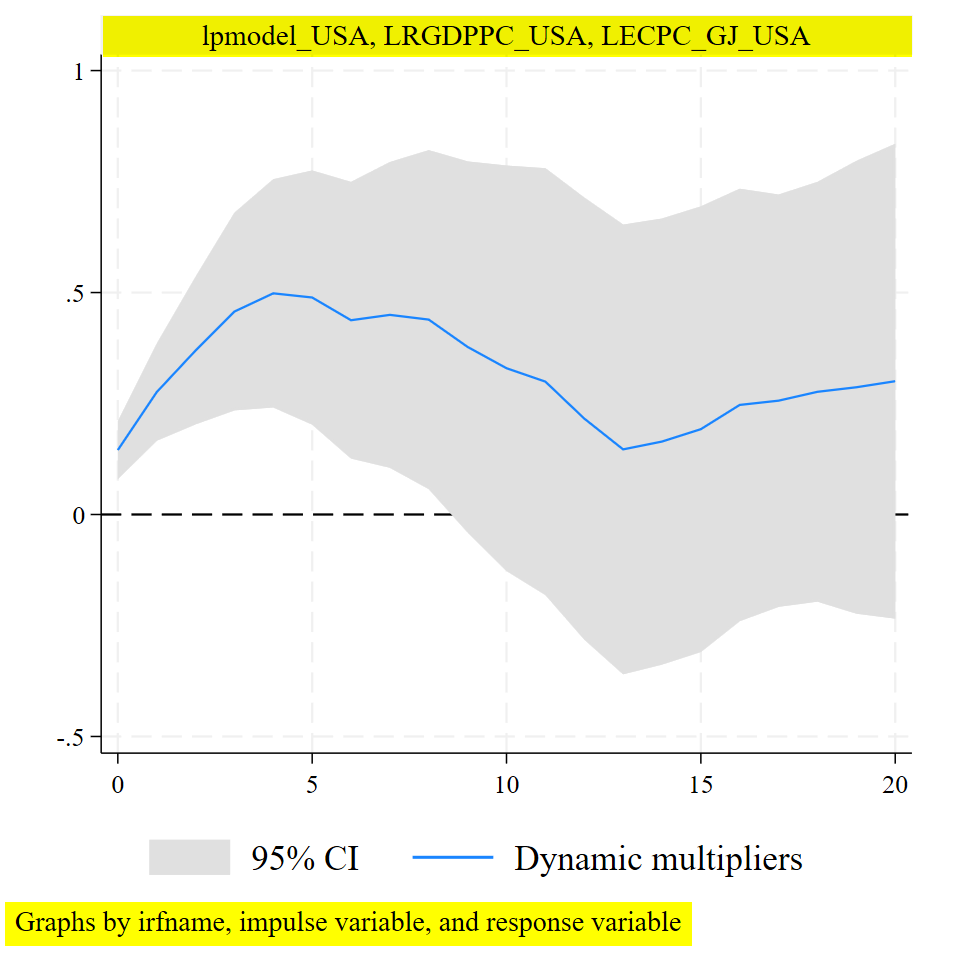
But, when you estimate and want to plot the impulse response function with the local projection method, we may to remove the parts in yellow. We are going to add some element to the code to remove these parts in yellow.
**# Local Projections

irf set myirf.irf, replace

foreach x in SWE NLD DEU ITA FRA ESP PRT GBR CAN USA {
* Full sample
lpirf LECPC_GJ_`x', ///
      lags(1/2) ///
      exog(L(0/1).LRGDPPC_`x') ///
      step(21) vce(hac nw 1)
irf create lpmodel_`x'
irf graph dm, impulse(LRGDPPC_`x') ///
      response(LECPC_GJ_`x') ///
      irf(lpmodel_`x') level(95) ///
      yline(0) name(`x', replace) ///
	  byopts(note("") ti("`x'", size(small))) xti("") ///
	  subtitle("") ysize(4) xsize(4) legend(cols(2))

graph export `x'.png, as(png) replace

}
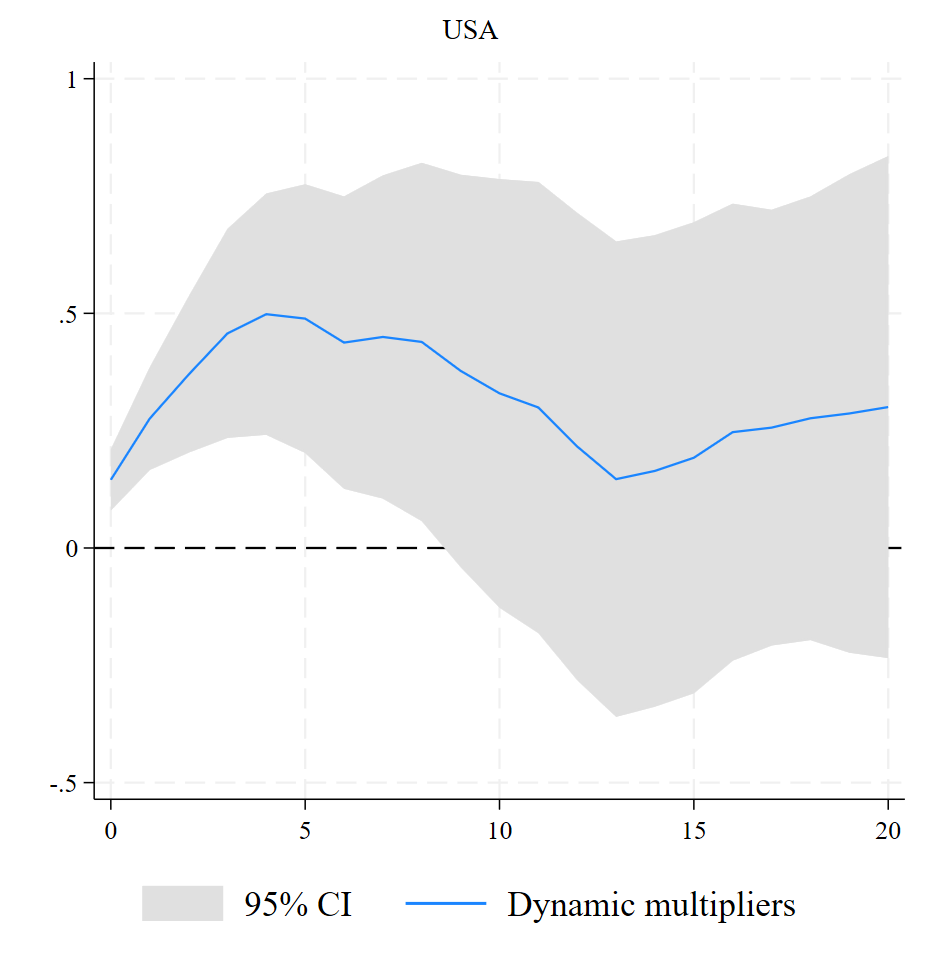
The option byopts(note("") ti("`x'", size(small))) remove the note and the option subtitle("") remove the subheader, yes, that is a subheader.
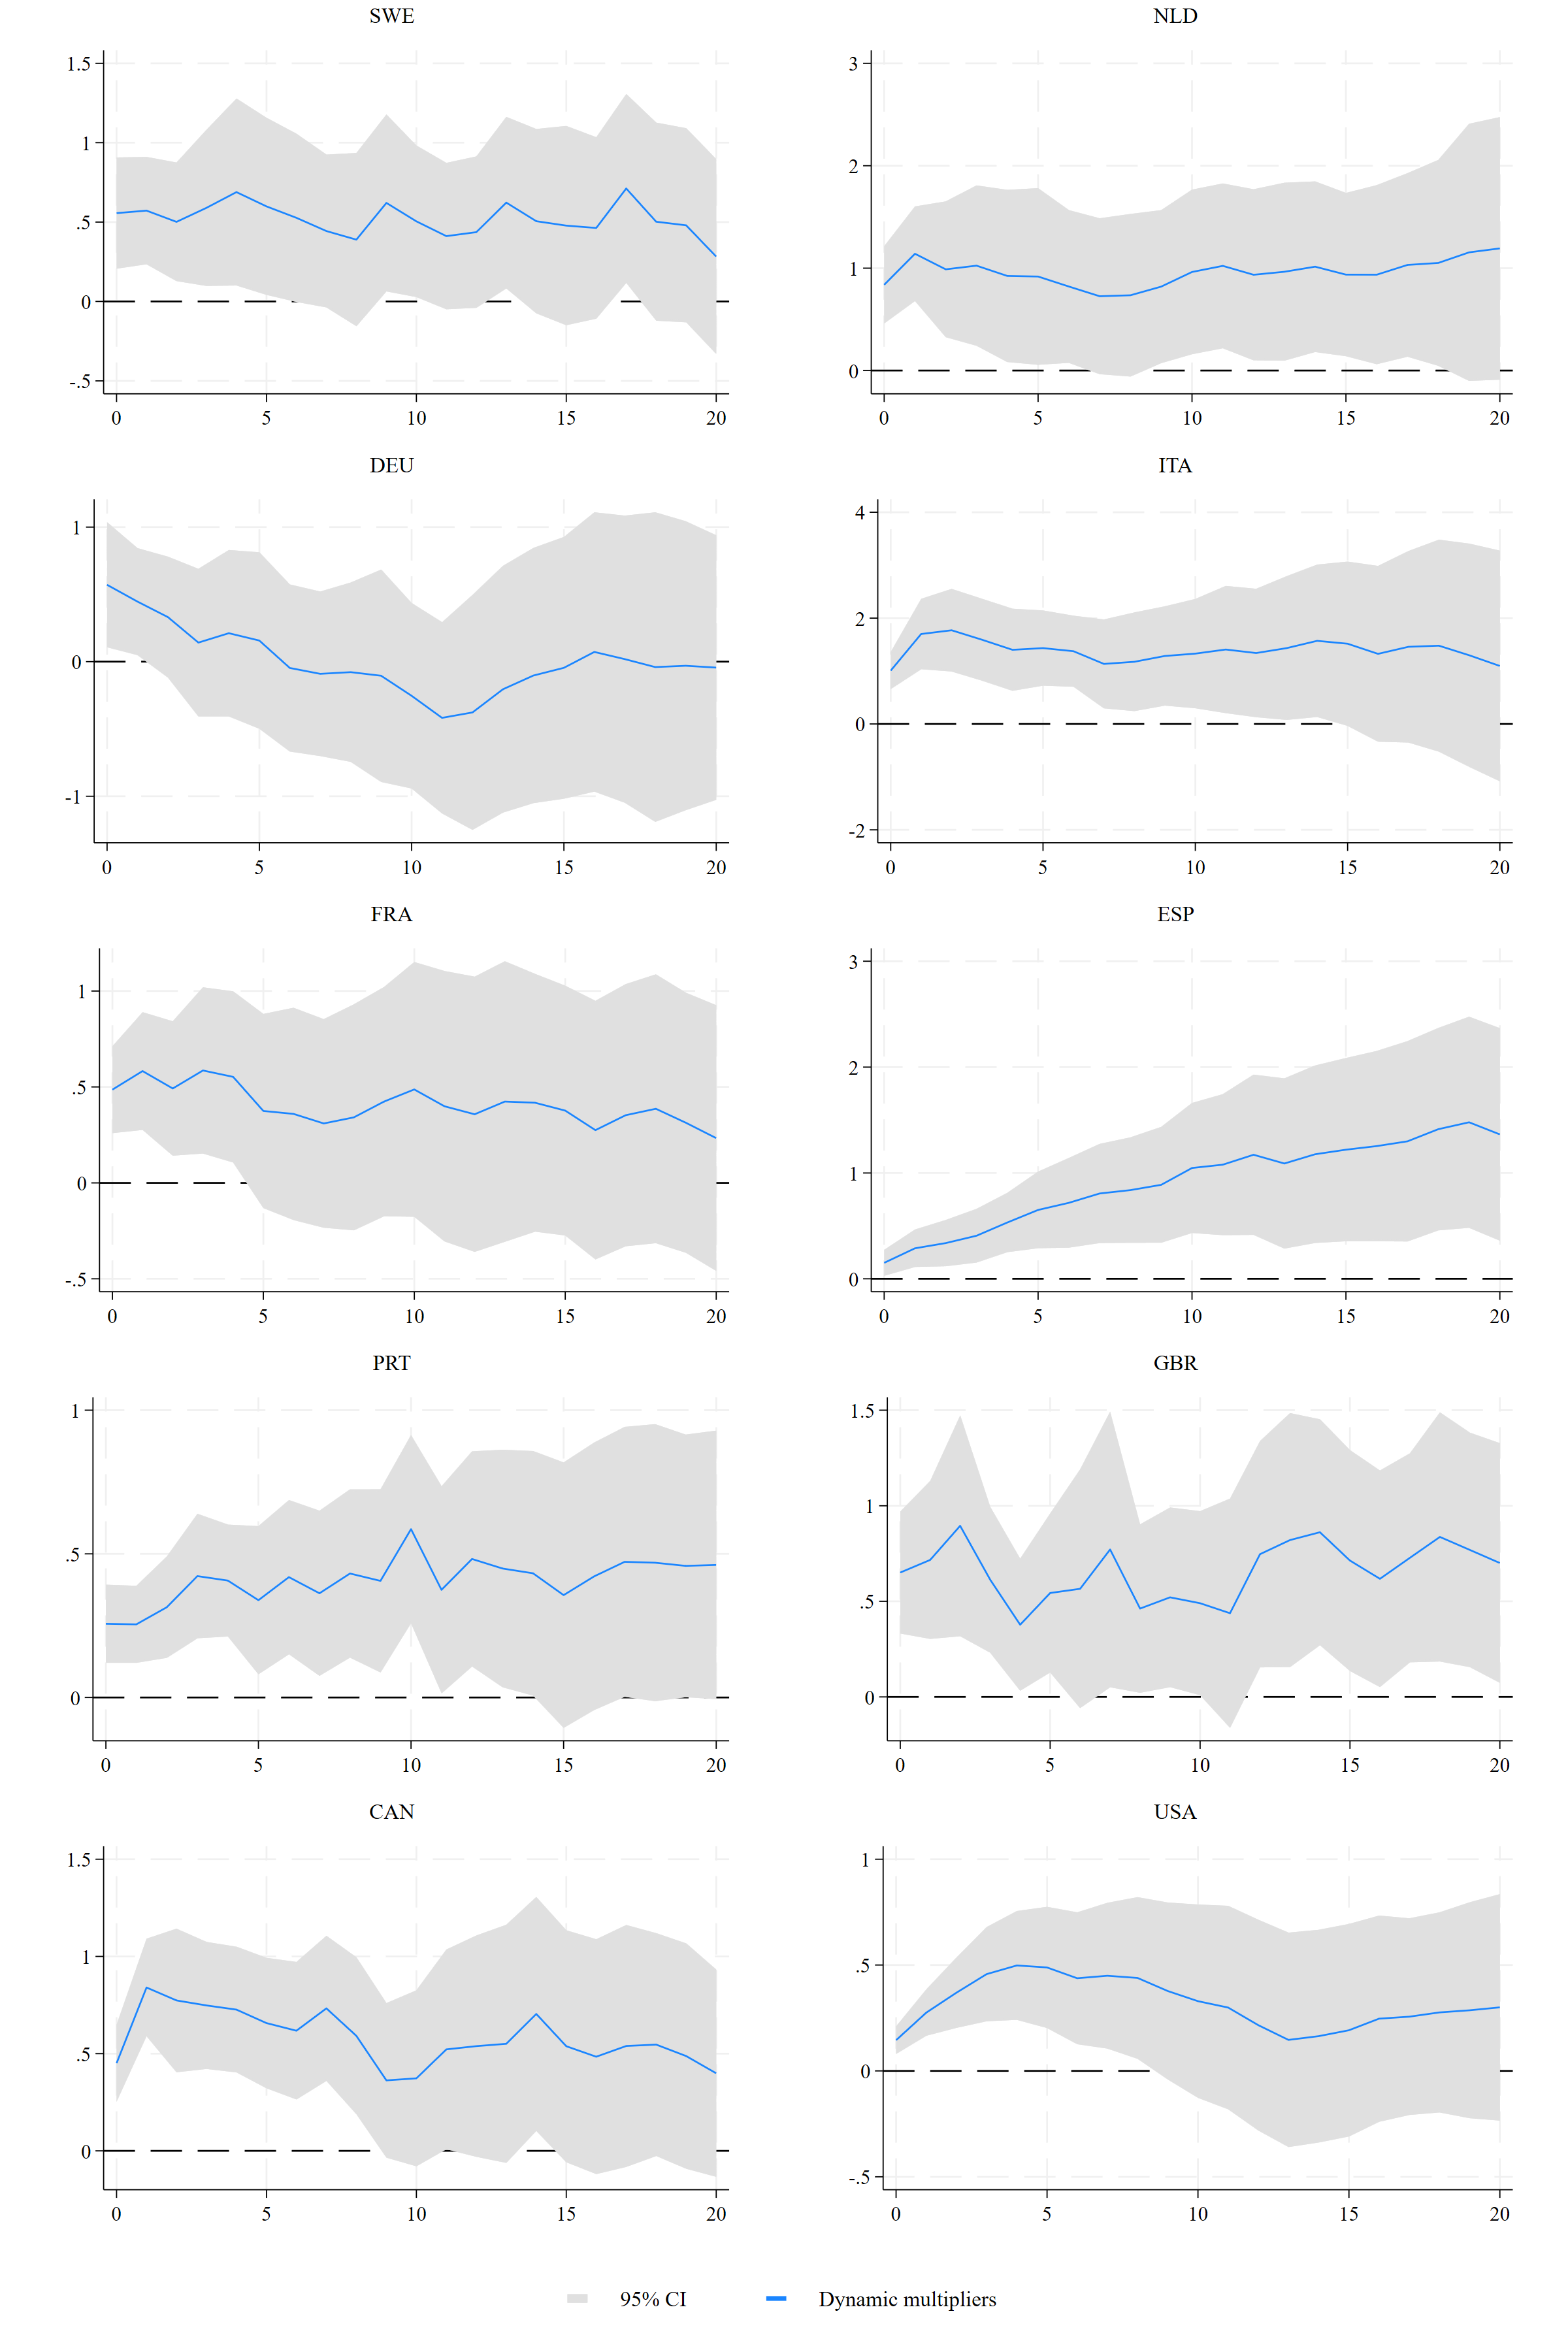
Finally, you are free to recombine multiple countries using the grc1leg2 package:
**# Combine LP grahs

*search grc1leg2
grc1leg2 SWE NLD DEU ITA FRA ESP PRT GBR CAN USA, ///
legendfrom(USA) ///
name(Fig3, replace) ///
imargin(zero) scheme(stcolor) ///
xsize(4) ysize(6) scale(1) graphregion(margin(zero)) ///
plotregion(margin(zero)) cols(2)
graph export "Fig3.png", width(2400) replace