In this blog, I will show you how to use the eventdd Stata package with high-frequency data. This Stata package has been developed by Damian Clarke and Kathya Tapia Schythe to estimate panel event-study models and generate event-study plots. The command is especially useful because it combines flexible estimation routines, graphical output, and post-estimation joint tests of leads and lags.
In order to apply this estimator to a high-frequency dataset, I will use the database of my recently published article in Economics and Politics. The 2024 US presidential election offers a rare opportunity to observe how a major political shock is transmitted into foreign-exchange markets in real time. Using minute-by-minute data, one can track the immediate response of exchange rates against the US dollar and study whether the adjustment is abrupt, persistent, and statistically distinguishable from pre-event noise.
The empirical design is straightforward. I stack high-frequency exchange-rate series into a panel and define event time relative to the election benchmark. The currency pairs are EURUSD, GBPUSD, AUDUSD, CADUSD, CHFUSD, CNYUSD, JPYUSD, and NZDUSD. Each series is normalized to 100 at 06nov2024 00:02, which allows a direct comparison across currencies despite differences in levels and quoting conventions. I then estimate an event-study specification with pair fixed effects and plot the cumulative response around the election using eventdd. The resulting figure shows a striking pattern: the pooled exchange-rate response is essentially flat before the event, but turns sharply negative immediately after the result becomes clear and remains below its benchmark for hours afterward.
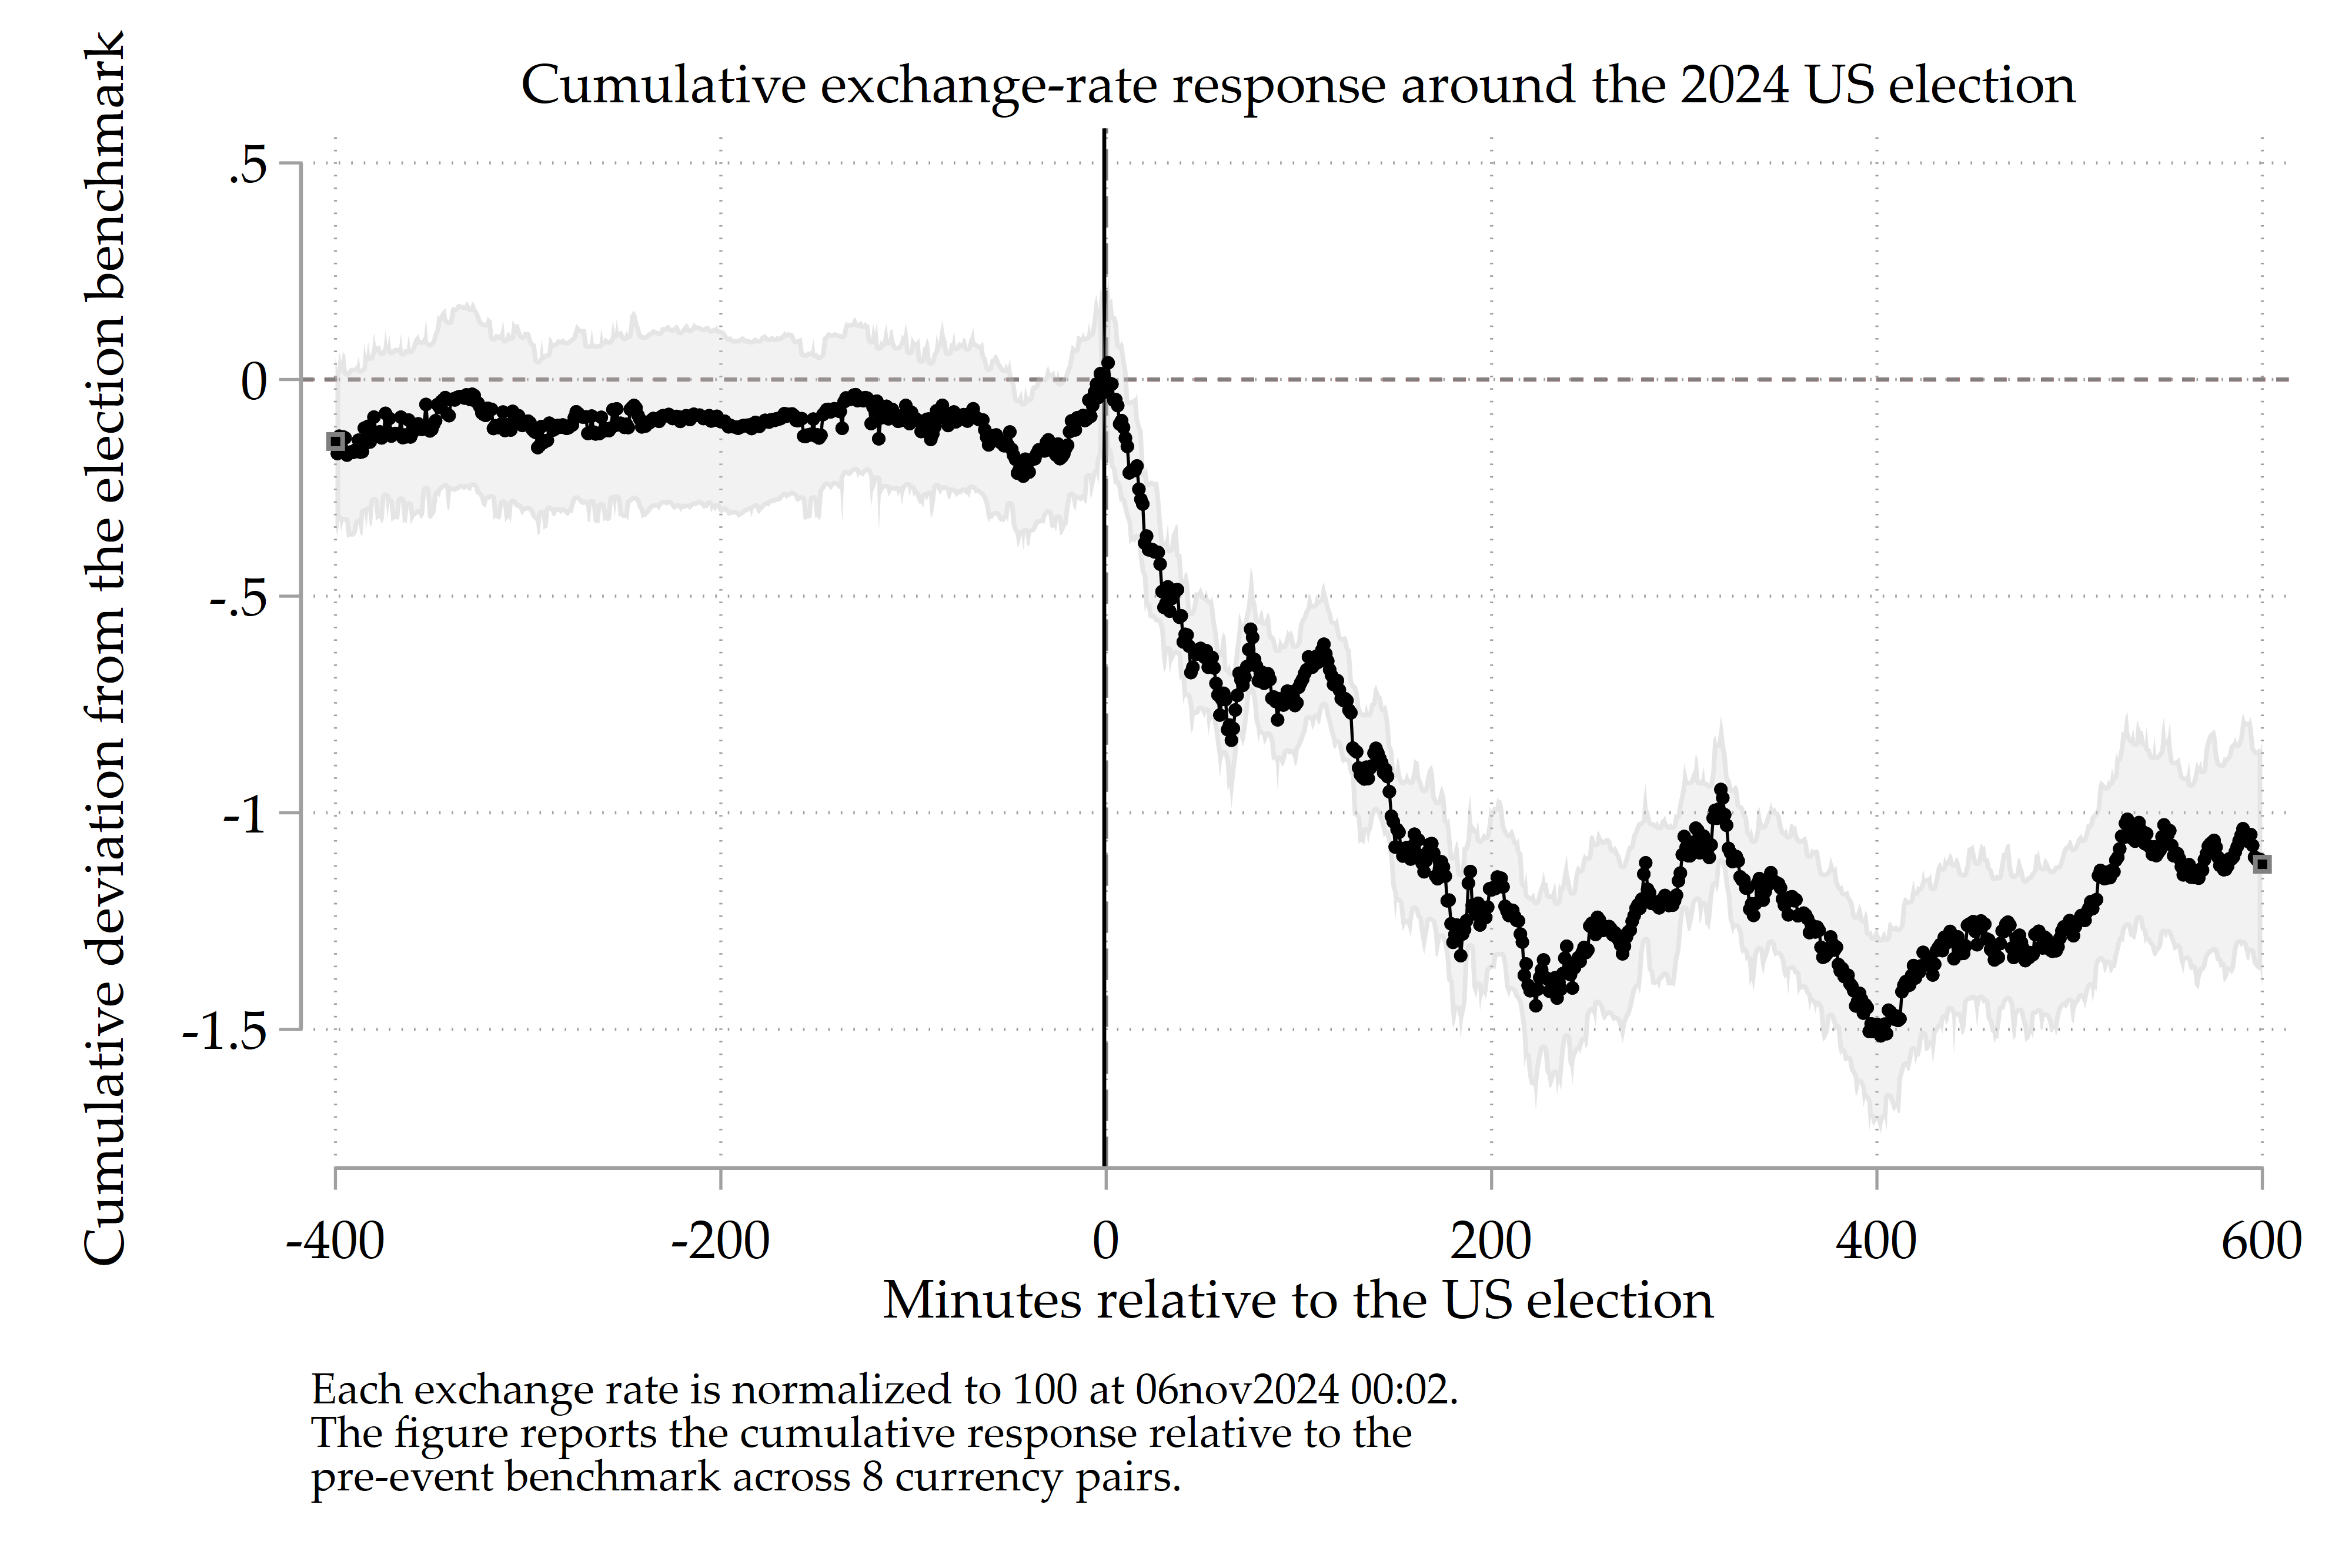
The absence of a detectable pre-trend is consistent with the idea that markets were not steadily pricing in the outcome during the narrow event window, whereas the significant post-event coefficients indicate that exchange rates adjusted forcefully once the result was understood. In that sense, the event-study graph is not just descriptive: it supports the interpretation of the election outcome as a credible high-frequency shock.
The analysis builds directly on my published article linked above. The broader motivation is to treat the election result as a quasi-natural experiment and then ask why currencies responded differently across countries. Once the shock is identified at high frequency, the next step is to explain cross-sectional heterogeneity in resilience to exchange-rate pressure. This is where the combination of political economy, macro-finance, and high-frequency identification becomes particularly fruitful.
Below is the core Stata code used to generate the figure.
// Choose the current directory
cd C:\Users\jamel\Dropbox\Latex\PROJECTS\
cd 24-11-xr-trump-election-josh\Data-HFD
// Load the dataset
use EURUSD_data_1march2025.dta, clear
gen id = 1
order date3 FX time id, first
rename C_EURUSD fxUSD
// Append the data and fill the new FX variable
// with the currency pairs
append using GBPUSD_data_1march2025.dta
replace id = 2 if id==.
order fxUSD date3 FX time id, first
replace fxUSD=C_GBPUSD if fxUSD==.
append using AUDUSD_data_1march2025.dta
replace id = 3 if id==.
order fxUSD date3 FX time id, first
replace fxUSD = C_AUDUSD if fxUSD==.
drop C_AUDUSD
append using CADUSD_data_1march2025.dta
replace id = 4 if id==.
order fxUSD date3 FX time id, first
replace fxUSD = C_CADUSD if fxUSD==.
drop C_CADUSD
append using CHFUSD_data_1march2025.dta
replace id = 5 if id==.
order fxUSD date3 FX time id, first
replace fxUSD = C_CHFUSD if fxUSD==.
drop C_CHFUSD
append using CNYUSD_data_1march2025.dta
replace id = 6 if id==.
order fxUSD date3 FX time id, first
replace fxUSD = C_CNYUSD if fxUSD==.
drop C_CNYUSD
append using JPYUSD_data_1march2025.dta
replace id = 7 if id==.
order fxUSD date3 FX time id, first
replace fxUSD = C_JPYUSD if fxUSD==.
drop C_JPYUSD
append using NZDUSD_data_1march2025.dta
replace id = 8 if id==.
order fxUSD date3 FX time id, first
replace fxUSD = C_NZDUSD if fxUSD==.
drop C_NZDUSD
xtset id date3
// Create deviation from the Election Day
// (adjust the cell for the Election)
// Adjust to 00:02 to keep China
gen FXDT = fxUSD if date3 == 2046470520000
bys id: egen FX_election = max(FXDT)
drop FXDT
rename FX_election FXDT
by id: gen index_fxUSD=100*(fxUSD/FXDT)
xtdes
// Create the time
// standardized time variable relative to the event of interest
gen double election_dt = clock("06nov2024 00:02:00", "DMYhms")
format election_dt %tc
gen double t_since_election_ms = date3 - election_dt
label var t_since_election_ms ///
"Milliseconds since 2024 US election"
gen t_since_election_sec = (date3 - election_dt)/1000
gen t_since_election_min = (date3 - election_dt)/(1000*60)
keep if inrange(t_since_election_min, -400, 600)
// Event study plot
eventdd index_fxUSD, ///
timevar(t_since_election_min) ///
method(hdfe, absorb(id) vce(r)) ///
baseline(-1) ///
leads(400) lags(600) accum ///
ci(rarea, color(gs12%25) lcolor(gs12%25)) ///
coef_op(recast(connected) msymbol(O) msize(vsmall) ///
mcolor(black) lcolor(black) lwidth(thin)) ///
graph_op( ///
title("Cumulative exchange-rate response around the 2024 US election", ///
size(medsmall)) ///
xtitle("Minutes relative to the US election", ///
size(medsmall)) ///
ytitle("Cumulative deviation from the election benchmark", ///
size(medsmall)) ///
xlabel(-400(200)600, labsize(medsmall)) ///
ylabel(-1.5(.5).5, labsize(medsmall) angle(0)) ///
xline(0, lcolor(gs8) lpattern(dash)) ///
yline(0, lcolor(gs8) lpattern(shortdash)) ///
note("Each exchange rate is normalized to 100 at 06nov2024 00:02. " ///
"The figure reports the cumulative response relative to the " ///
"pre-event benchmark across 8 currency pairs.", ///
size(small)) ///
legend(off) ///
graphregion(color(white)) ///
plotregion(color(white)) ///
)
graph export EVENT.png, as(png) width(4000) replace
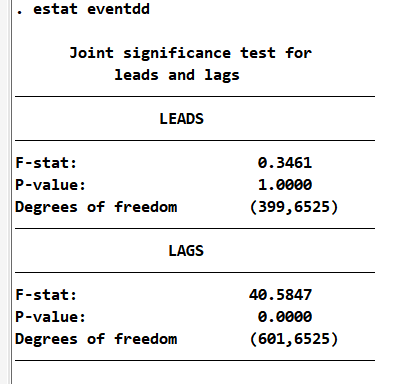
// Event study tests
estat eventdd
A natural closing point for this blog could be the following: high-frequency event studies allow us to observe the exact moment when politics affect economics. In this case, the 2024 US election triggered an immediate and persistent strengthening of the dollar against a broad set of currencies, and eventdd provides a transparent way to show it.
References
Aizenman, J., & J. Saadaoui. 2026. How Institutions Interact With Exchange Rates After the 2024 US Presidential Election: New High-Frequency Evidence. Economics & Politics, https://doi.org/10.1111/ecpo.70047
Clarke, D., & Tapia-Schythe, K. (2021). Implementing the panel event study. The Stata Journal, 21(4), 853-884. https://doi.org/10.1177/1536867X211063144