In this blog, I will leverage my yesterday’s blog to analyze the daily exchange rate dynamics between the US 2024 Presidential Election and the Tariff Deadline. I am deeply grateful to Joshua Aizenman for helpful comments. The code is reproduced at the end of the blog.
In the graphs below, I show an overview of exchange rate movements between the US election and the tariff deadline for a large cross-section of currency pairs.
Key takeaways:
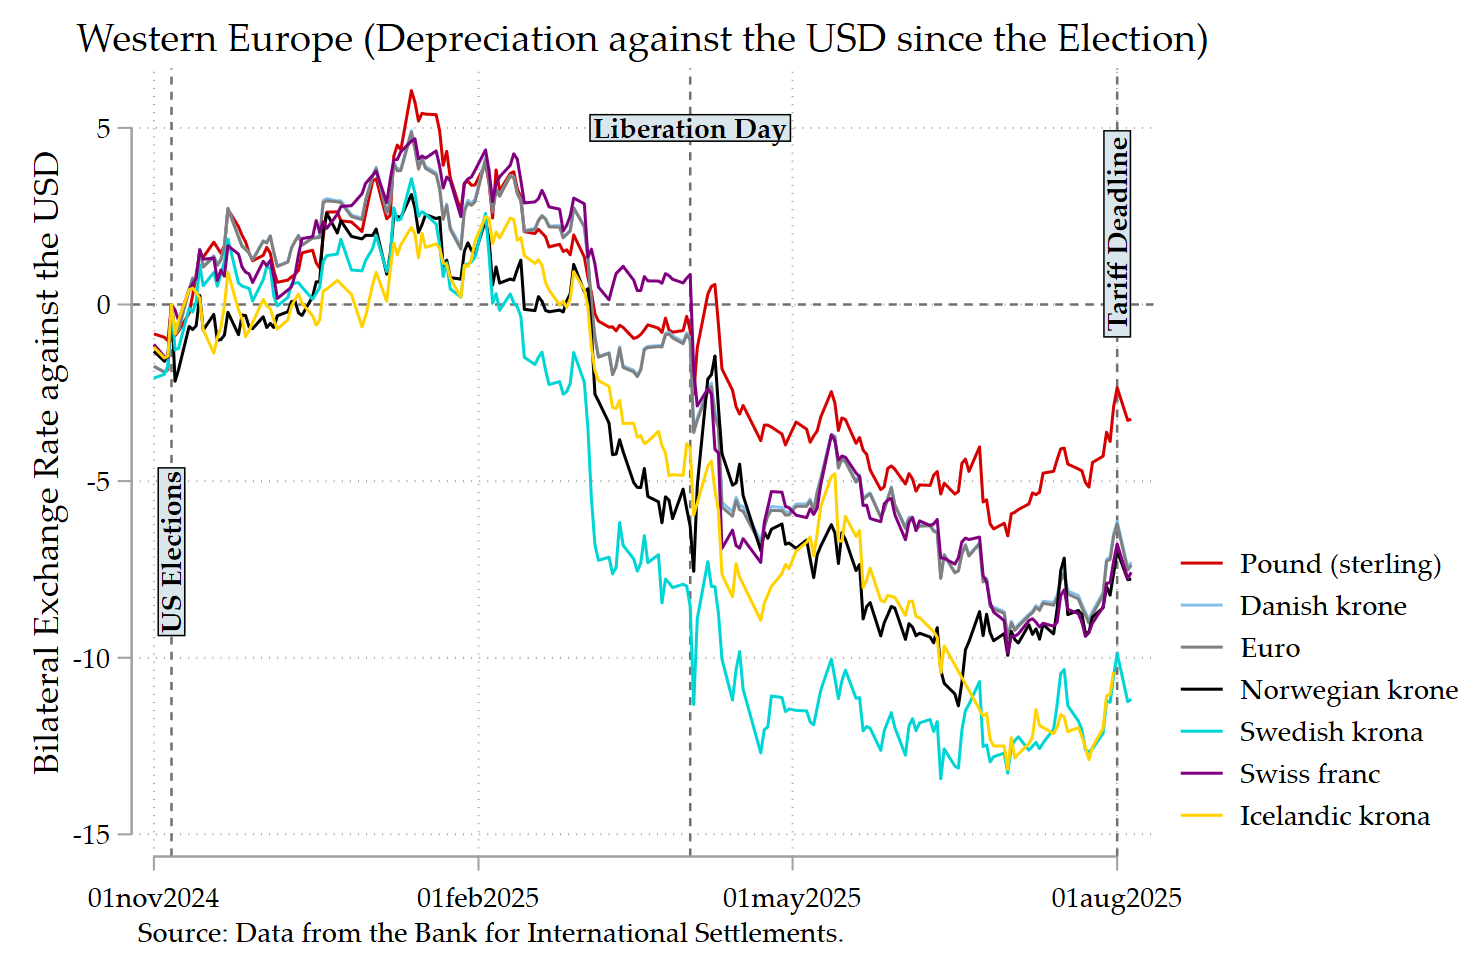
- In Western Europe and East Asia Pacific regions a homogenous trend to depreciate against the dollar is observed before Liberation Day;
- This may reflect a geopolitical realignment of financial risk premia;
- After Liberation Day, a heterogeneous trend of appreciation against the dollar is observed;
- This may be due to the hedging behavior against the USD, especially in some parts of the East Asia Pacific;
- With a more speculative tone, what can we infer from the recent movements after the Tariff Deadline?
Western Europe
Before Liberation Day, a homogenous trend to depreciate against the dollar is observed, as explained by Aizenman and Saadaoui (2025): “We interpret this through the lens of a geopolitical realignment: the election marks a structural break in the U.S. role as guarantor of a rule-based international order. Under the new administration’s more transactional and bilateralist orientation, strong institutional alignment with liberal democratic norms may have increased perceived exposure to U.S. policy uncertainty. Our findings reveal how political regime shifts in leading economies can reconfigure the global distribution of financial risk premia.” After Liberation Day, a heterogeneous appreciation is observed, with the Pound being having a limited appreciation.
East Asia–Pacific
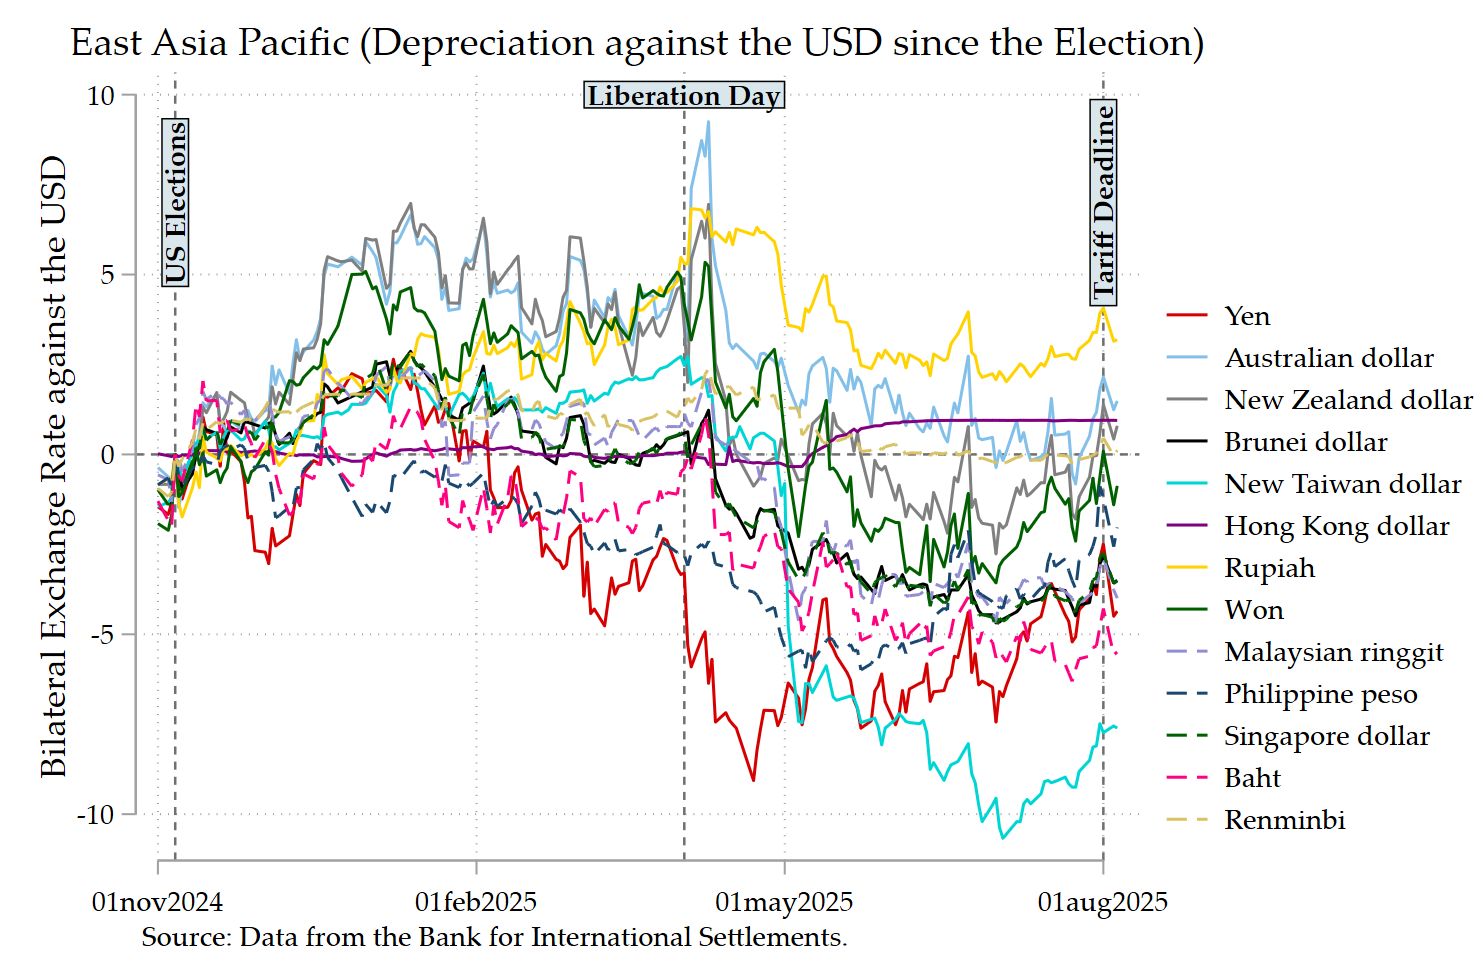
Before Liberation Day: USD firmer vs. the Australian dollar, New Zealand dollar, and the Korean won with depreciations above 5%. The global trend is a quite homogenous depreciation of currencies in this region; after Liberation Day, the yen, the baht, and the New Taiwan dollar lead appreciations between 5 and 10%. The global trend is heterogenous depreciation; the Indonesian rupiah, the Australian dollar, and the Hong Kong dollar continue to depreciate.
Europe & Central Asia
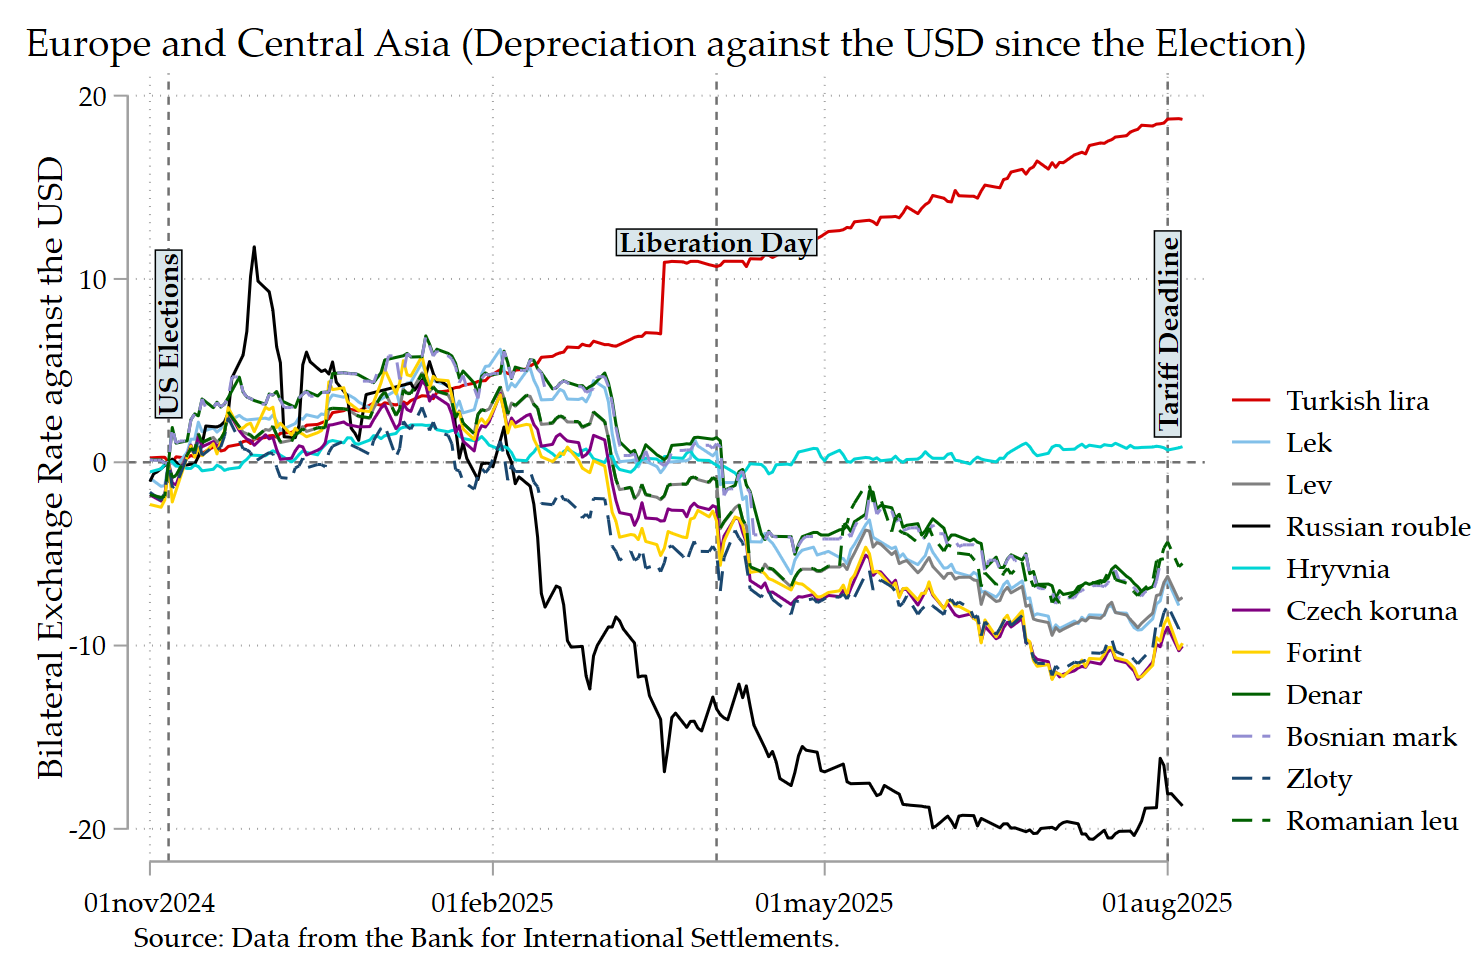
Before Liberation Day, in line with the two previous regions, a homogenous appreciation is observed after the election, Russia, Turkey, and Ukraine being clear outliers. After Liberation Day, Central and Eastern European countries (CEE) currencies appreciate sharply in a homogenous way; the lira keeps depreciating heavily; the Ukrainian hryvnia stays near flat; the Russian ruble keeps appreciating (Krugman explains why).
Latin America
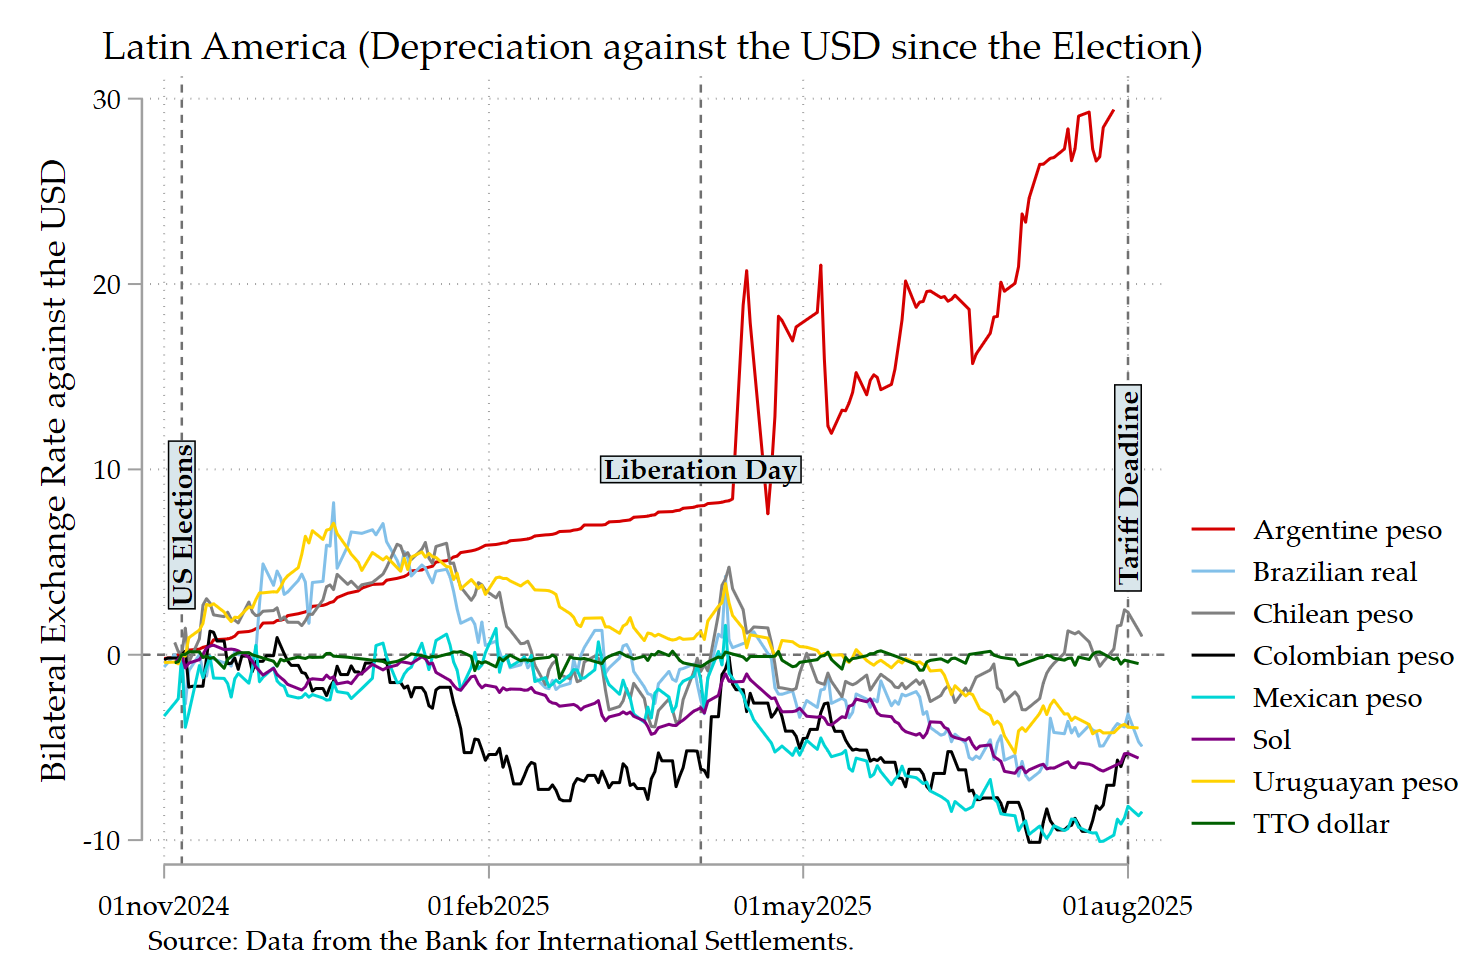
Before the Liberation Day, the currency movements were more dispersed; the most appreciating currencies were the Brazilian real, the UUruguayan nd Chilean peso; the Argentine peso, which was already depreciating. After Liberation Day, the Mexican peso shows the clearest appreciation; the Brazilian real and sol appreciate; a heterogeneous trend of depreciation is observed; the Argentine peso surges in depreciation.
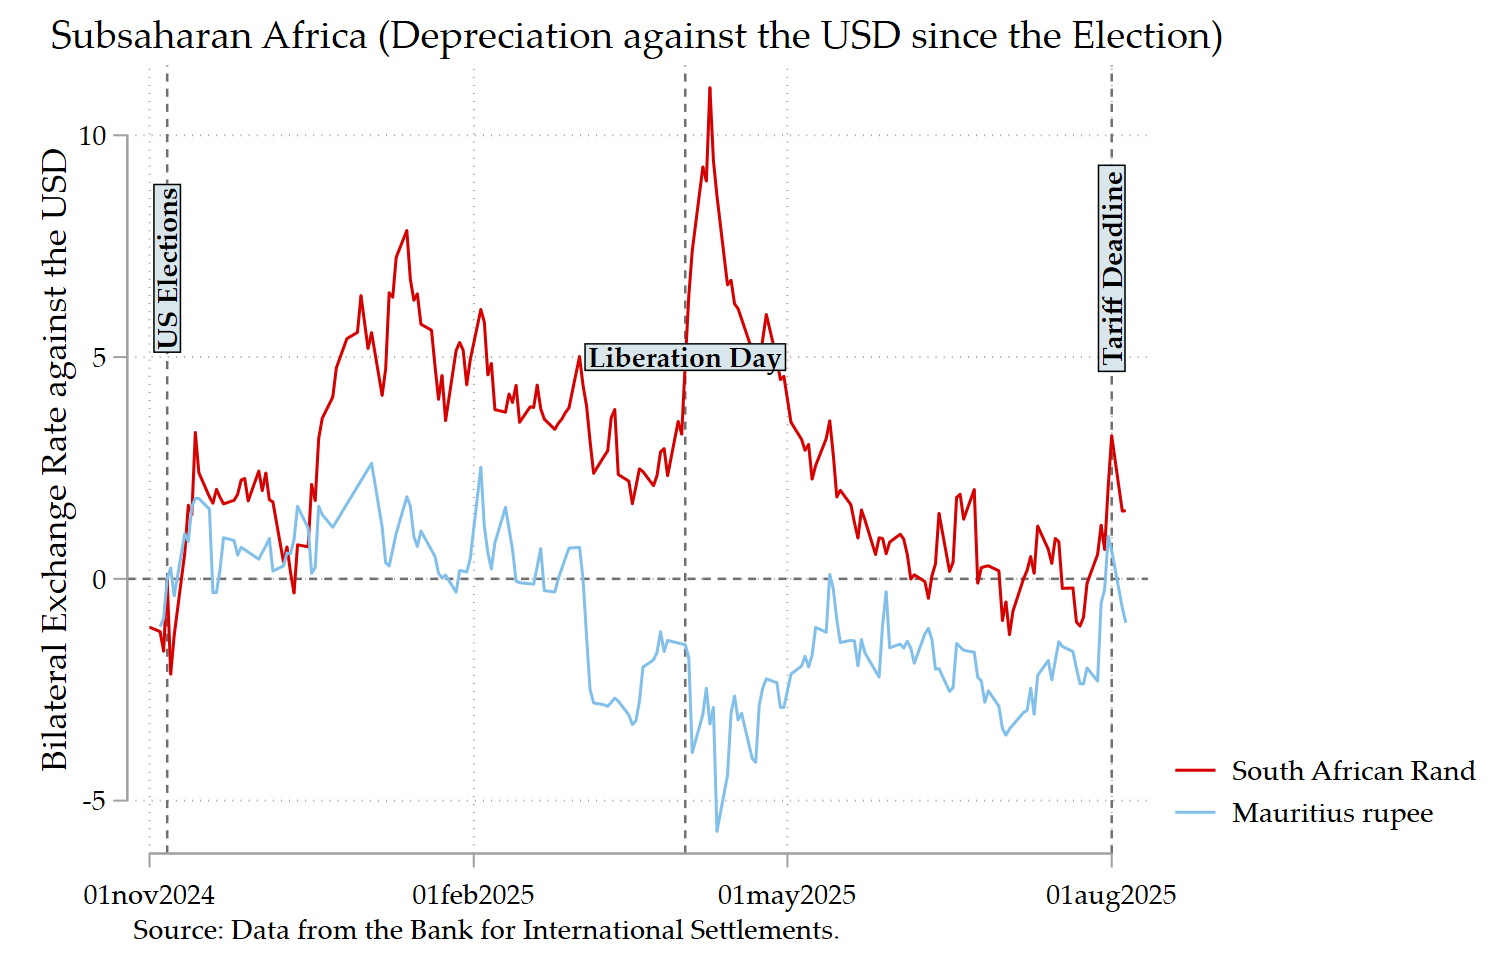
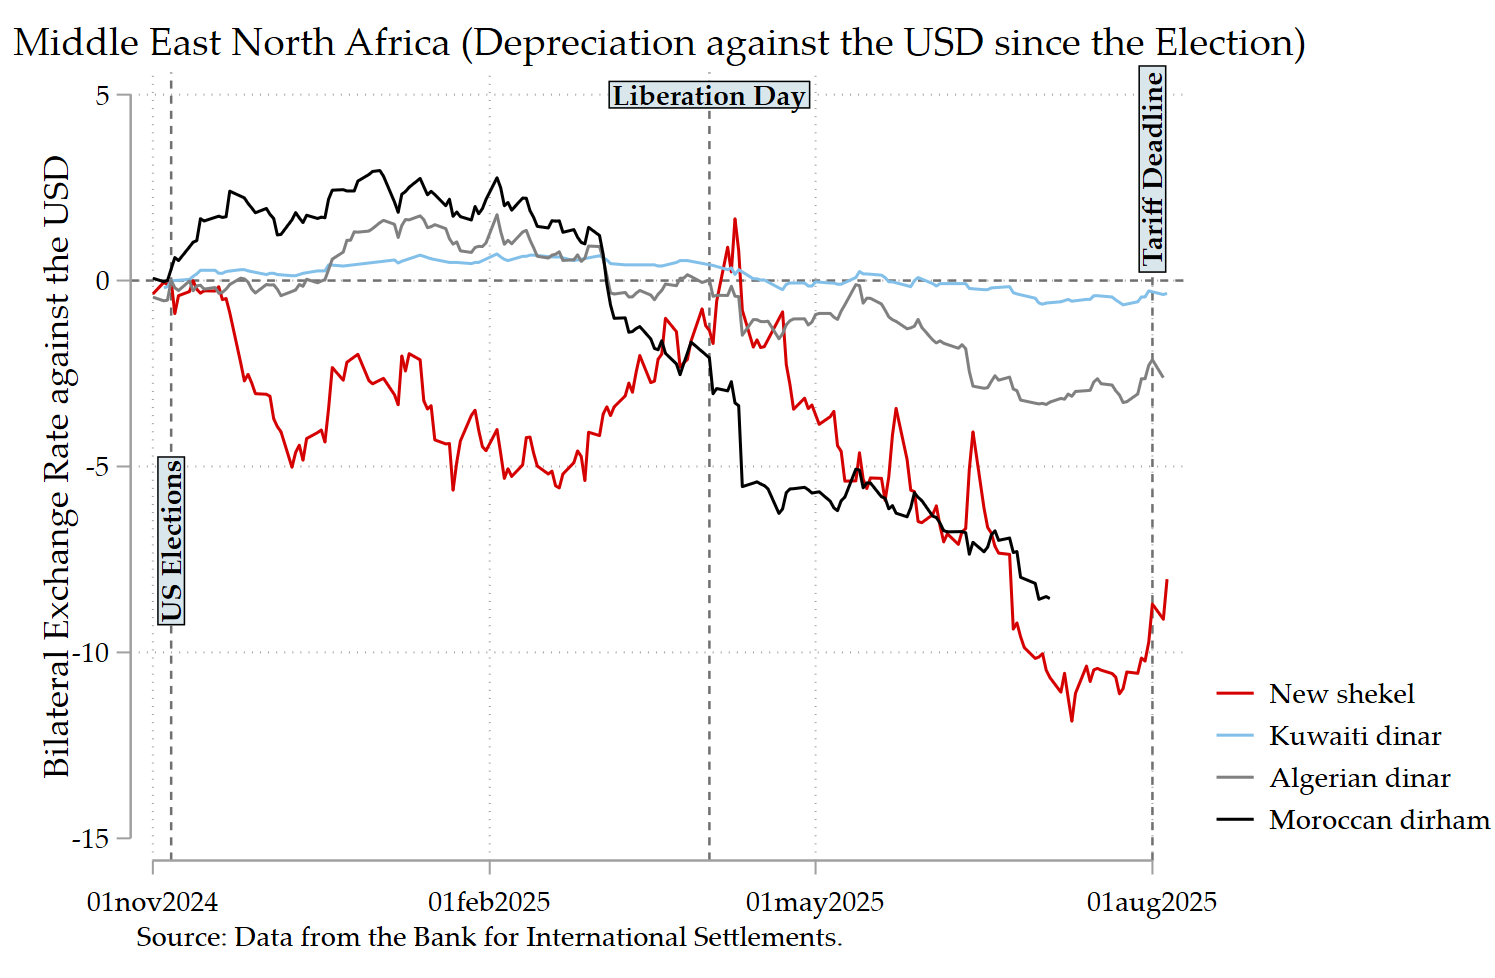
MENA & Sub-Saharan Africa
Before Liberation Day: the new shekel already appreciating; the Moroccan dirham and Algerian dinar slightly weaker; the South African rand a bit weaker. After Liberation Day: strong shekel appreciation; Moroccan dirham and Algerian dinar appreciation.
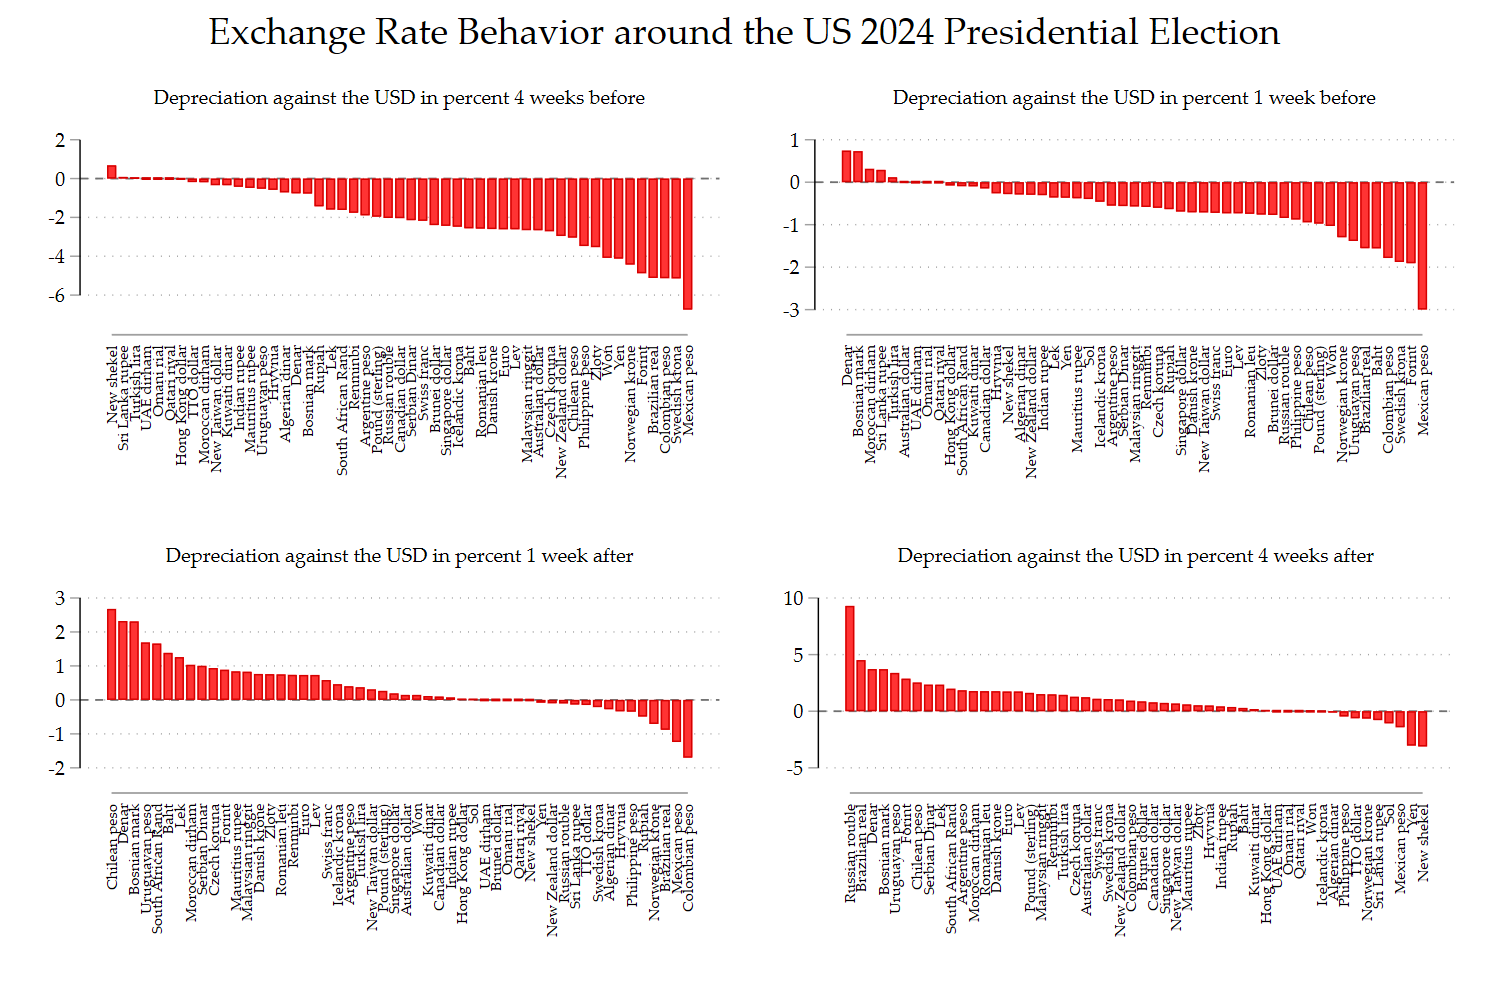
The following charts isolate the behavior of exchange rates before and after the US 2024 presidential election showing that the election was unexpected, as Aizenman and Saadaoui (2025) claim:
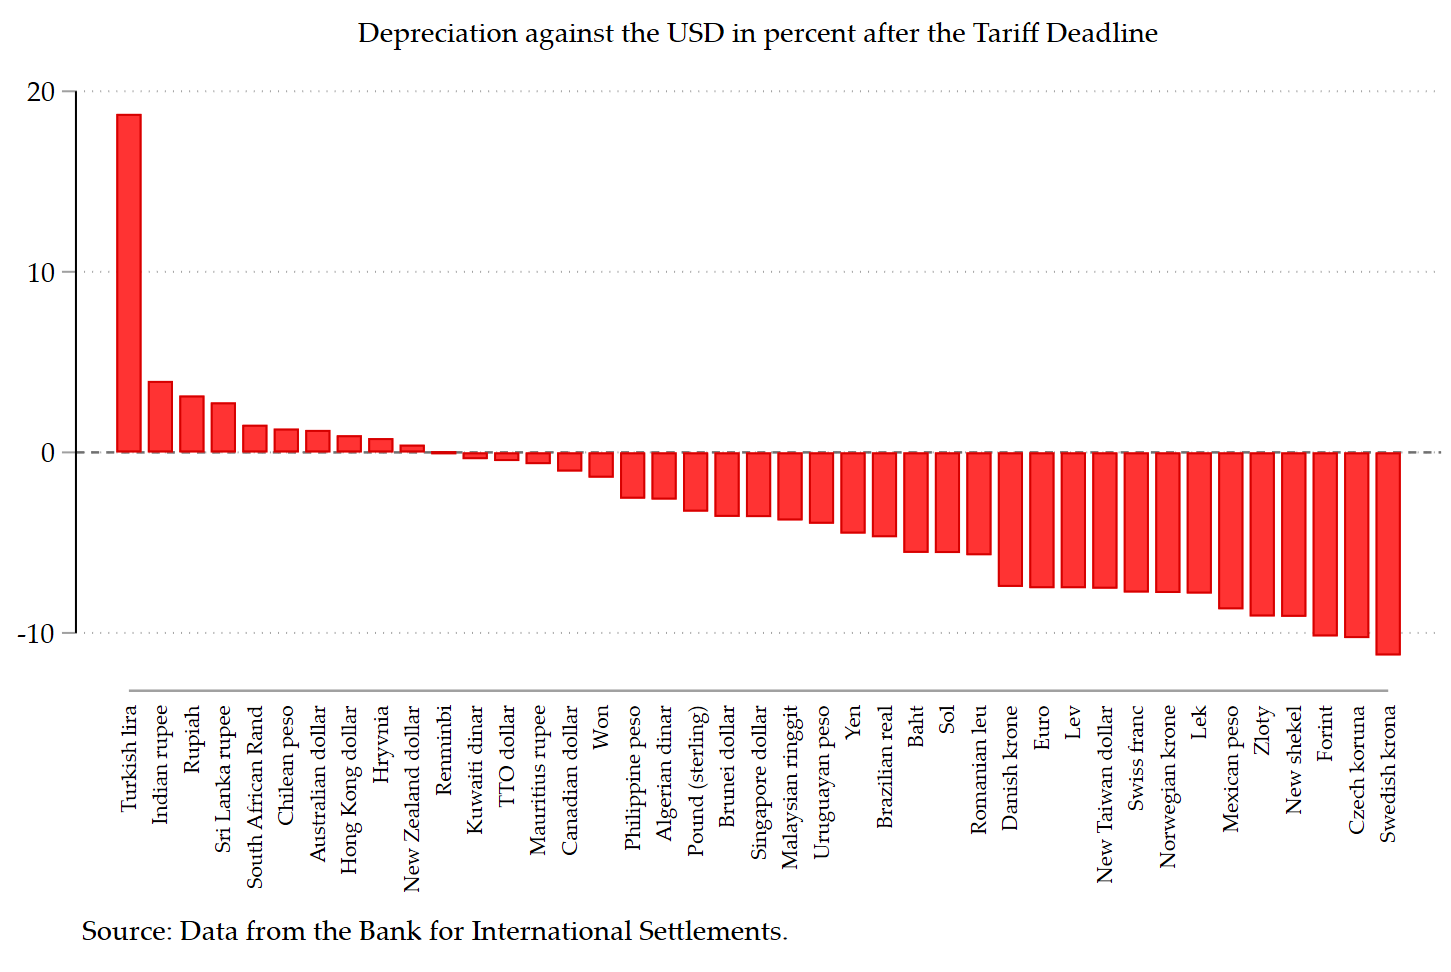
The following figure shows the evolution between the election and the tariff deadline; some depreciations against the USD are long-lasting.
The Python/Stata code below:
capture log close _all
log using BIS.smcl, name(BIS) smcl replace

// Download and plot high-frequency data

cls
clear

**# Only once locate and initiate python

python search

*python set exec "C:/Users/jamel/AppData/Local/Programs/Python/Python313/python.exe", permanently

**# Use python to install pandas

python:
import sys, subprocess
subprocess.check_call([sys.executable, '-m', 'pip', 'install', 'pandas[excel]'])
end

**# Import the data from the BIS

python:
import pandas as pd
import requests

# Define the URL
url = "https://stats.bis.org/api/v2/data/dataflow/BIS/WS_XRU/1.0/D...A?startPeriod=2024-01-01&endPeriod=2025-08-08&format=csv"

try:
    # Fetch data from the API
    response = requests.get(url)
    response.raise_for_status()  # Raise an error for HTTP issues (4xx, 5xx)

    # Read the CSV content
    df = pd.read_csv(url)

    # Save data to an Excel file
    excel_filename = "BIS_exchange_rates.xlsx"
    df.to_excel(excel_filename, index=False)

    print(f"Data successfully saved to {excel_filename}")

except requests.exceptions.HTTPError as http_err:
    print(f"HTTP error occurred: {http_err}")
except requests.exceptions.RequestException as err:
    print(f"Other error occurred: {err}")
except Exception as e:
    print(f"An error occurred: {e}")
end

**# Prepare data and draw the graphs with Stata

graph set window fontface "Palatino Linotype"

import excel "BIS_exchange_rates.xlsx", sheet("Sheet1") firstrow clear

des

*ssc install kountry

kountry   REF_AREA, from(iso2c)
rename    NAMES_STD country
kountry   REF_AREA, from(iso2c) to(imfn)
rename    _IMFN_ imfcode
kountry   REF_AREA, from(iso2c) to(iso3c)
rename    _ISO3C_ iso3c

replace   country = "United Arab Emirates" if REF_AREA == "AE"
replace   country = "Euro Area" if REF_AREA == "XM"

drop if imfcode==.

split    TIME_PERIOD, parse(-)
gen      string = TIME_PERIOD3 + ///
         "/" + TIME_PERIOD2 + ///
         "/" + TIME_PERIOD1
gen      date = date(string, "DMY")
format   date %td

split    TITLE, parse(-)
rename   TITLE2 UNITS

rename   OBS_VALUE XR

order imfcode date XR country REF_AREA UNITS

*replace imfcode=999 if country=="Euro Area"

replace UNITS="Bosnian mark" if UNITS==" Bosnian convertible mark "
replace UNITS="TTO dollar" if UNITS==" Trinidad and Tobago dollar "

*ssc install labmask
labmask imfcode, value(UNITS)

xtset imfcode date
*tsfill, full
xtset imfcode date
xtdes

lab var XR "Bilateral Exchange rates"

drop if XR==.

rename imfcode cn
group_dummy
rename cn imfcode

gen XRDAY = XR if date==td(6nov2024)
gen XRDAY2 = XR if date==td(5nov2024) // For Argentina and Morocco


by imfcode: egen TR = mean(XRDAY)

gen DXR = 100*(XR-TR)/TR

// For Argentina and Morocco

by imfcode: egen TR2 = mean(XRDAY2)

gen DXR2 = 100*(XR-TR2)/TR2

replace DXR = DXR2 if DXR==.

label define emg 0 "Emerging Markets" ///
 1 "Other countries", replace

label values emg emg

display td(8oct2024)
display td(29oct2024)
display td(6nov2024)
display td(12nov2024)
display td(19nov2024)
display td(26nov2024)
display td(3dec2024)

drop if UNITS==" Euro " & country!="France"

*drop if UNITS==" Russian rouble "

graph bar DXR if date==23657 & DXR!=0 & DXR!=.,  ///
      over(imfcode, label(angle(90) labsize(vsmall))   ///
	  gap(25) sort(1) descending) ///
	  yti("") yline(0) ///
	  ti("Depreciation against the USD in percent 4 weeks before", ///
	  size(small)) ///
	  name(G1, replace)

graph bar DXR if date==23678 & DXR!=0 & DXR!=.,  ///
      over(imfcode, label(angle(90) labsize(vsmall))   ///
	  gap(25) sort(1) descending) ///
	  yti("") yline(0) ///
	  ti("Depreciation against the USD in percent 1 week before", ///
	  size(small)) ///
	  name(G2, replace)

graph bar DXR if date==23692 & DXR!=0 & DXR!=.,  ///
      over(imfcode, label(angle(90) labsize(vsmall))   ///
	  gap(25) sort(1) descending) ///
	  yti("") yline(0) ///
	  ti("Depreciation against the USD in percent 1 week after", ///
	  size(small)) ///
	  name(G3, replace)

graph bar DXR if date==23713 & DXR!=0 & DXR!=.,  ///
      over(imfcode, label(angle(90) labsize(vsmall))   ///
	  gap(25) sort(1) descending) ///
	  yti("") yline(0) ///
	  ti("Depreciation against the USD in percent 4 weeks after", ///
	  size(small)) ///
	  name(G4, replace)

graph combine G1 G2 G3 G4, ti("Exchange Rate Behavior around the US 2024 Presidential Election") ///
 scale(0.95) row(2)

graph export XR.png, as(png) width(4000) replace


*ssc install lgraph

lgraph DXR date if date>=td(23oct2024) & ///
 date<=td(20nov2024) ///
 & imfcode!=111 & DXR!=. & DXR!=0, ///
 yline(0) xlab(,angle(90)) xline(23686) ///
 xti("") ti("Exchange Rate Depreciation against the USD") ///
 note("Data from the Bank for International Settlements" ///
 "Average for an intial sample of 73 currency pairs." ///
 "US, missing and fixed echange rates excluded.")


label variable DXR "Bilateral Exchange Rate against the USD"

xtline DXR if idc==1 & date>=td(23oct2024) & ///
 date<=td(20nov2024) ///
 & imfcode!=111 & DXR!=. & DXR!=0, yline(0) ///
overlay title("Industrial Countries") ///
note("Data from the Bank for International Settlements")
graph rename idc, replace
graph export idc.png, as(png) width(4000) replace

xtline DXR if date>=td(23oct2024) & ///
 date<=td(20nov2024) ///
 & imfcode!=111 & DXR!=. & DXR!=0 ///
 & emg==1, yline(0) ///
overlay title("Emerging Countries") ///
note("Data from the Bank for International Settlements")
graph rename emg2, replace
graph export emg2.png, as(png) width(4000) replace

**# Country groups graphs

xtline DXR if eap==1 & date>=td(1nov2024) ///
 & imfcode!=111 & DXR!=., yline(0) xline(23686) xline(23954) xline(23833) ///
 text(7 23686 "{bf:US Elections}", ///
  size(small) orient(vertical) box) ///
 text(7 23954 "{bf:Tariff Deadline}", ///
  size(small) orient(vertical) box) ///
  text(10 23833 "{bf:Liberation Day}", ///
  size(small) orient(horizontal) box) ///
  xti("") ///
overlay title("East Asia Pacific (Depreciation against the USD since the Election)") ///
note("Source: Data from the Bank for International Settlements.")
graph rename eap, replace
graph export eap.png, as(png) width(4000) replace


xtline DXR if eca==1 & date>=td(1nov2024) ///
 & imfcode!=111 & DXR!=., yline(0) xline(23686) xline(23954) xline(23833) ///
 text(7 23686 "{bf:US Elections}", ///
  size(small) orient(vertical) box) ///
 text(7 23954 "{bf:Tariff Deadline}", ///
  size(small) orient(vertical) box) ///
    text(12 23833 "{bf:Liberation Day}", ///
  size(small) orient(horizontal) box) ///
  xti("") ///
overlay title("Europe and Central Asia (Depreciation against the USD since the Election)") ///
note("Source: Data from the Bank for International Settlements.")
graph rename eca, replace
graph export eca.png, as(png) width(4000) replace

xtline DXR if lac==1 & date>=td(1nov2024) ///
 & imfcode!=111 & DXR!=., yline(0) xline(23686) xline(23954) xline(23833) ///
 text(7 23686 "{bf:US Elections}", ///
  size(small) orient(vertical) box) ///
 text(9 23954 "{bf:Tariff Deadline}", ///
  size(small) orient(vertical) box) ///
  text(10 23833 "{bf:Liberation Day}", ///
  size(small) orient(horizontal) box) ///
  xti("") ///
overlay title("Latin America (Depreciation against the USD since the Election)") ///
note("Source: Data from the Bank for International Settlements.")
graph rename lac, replace
graph export lac.png, as(png) width(4000) replace

xtline DXR if we==1 & date>=td(1nov2024) ///
 & imfcode!=111 & DXR!=., yline(0) xline(23686) xline(23954) xline(23833) ///
 text(-7 23686 "{bf:US Elections}", ///
  size(small) orient(vertical) box) ///
 text(2 23954 "{bf:Tariff Deadline}", ///
  size(small) orient(vertical) box) ///
    text(5 23833 "{bf:Liberation Day}", ///
  size(small) orient(horizontal) box) ///
  xti("") ///
overlay title("Western Europe (Depreciation against the USD since the Election)") ///
note("Source: Data from the Bank for International Settlements.")
graph rename we, replace
graph export we.png, as(png) width(4000) replace

xtline DXR if ssa==1 & date>=td(1nov2024) ///
 & imfcode!=111 & DXR!=., yline(0) xline(23686) xline(23954) xline(23833) ///
 text(7 23686 "{bf:US Elections}", ///
  size(small) orient(vertical) box) ///
 text(7 23954 "{bf:Tariff Deadline}", ///
  size(small) orient(vertical) box) ///
      text(5 23833 "{bf:Liberation Day}", ///
  size(small) orient(horizontal) box) ///
  xti("") ///
overlay title("Subsaharan Africa (Depreciation against the USD since the Election)") ///
note("Source: Data from the Bank for International Settlements.")
graph rename ssa, replace
graph export ssa.png, as(png) width(4000) replace

drop if UNITS==" Omani rial "
drop if UNITS==" Saudi riyal "
drop if UNITS==" UAE dirham "
drop if UNITS==" Qatari riyal "

xtline DXR if mena==1 & date>=td(1nov2024) ///
 & imfcode!=111 & DXR!=0, yline(0) xline(23686) xline(23954) xline(23833) ///
 text(-7 23686 "{bf:US Elections}", ///
  size(small) orient(vertical) box) ///
 text(3 23954 "{bf:Tariff Deadline}", ///
  size(small) orient(vertical) box) ///
     text(5 23833 "{bf:Liberation Day}", ///
  size(small) orient(horizontal) box) ///
  xti("") ///
overlay title("Middle East North Africa (Depreciation against the USD since the Election)") ///
note("Source: Data from the Bank for International Settlements.")
graph rename mena, replace
graph export mena.png, as(png) width(4000) replace

**# Latest developments

display td(5aug2025)

graph bar DXR if date==23958 & DXR!=0 & DXR!=.,  ///
      over(imfcode, label(angle(90) labsize(vsmall))   ///
	  gap(25) sort(1) descending) ///
	  yti("") yline(0) ///
	  ti("Depreciation against the USD in percent 8 months after the US election", ///
	  size(small)) ///
	  name(GF, replace) ///
 note("Source: Data from the Bank for International Settlements.")

xtline DXR if date>=td(23oct2024) & ///
 date<=td(5aug2025) ///
 & imfcode!=111 & DXR!=. & DXR!=0 ///
 & idc==1, yline(0) ///
overlay title("Industrial Countries") ///
note("Data from the Bank for International Settlements")
graph rename idc2F, replace
graph export idc2F.png, as(png) width(4000) replace

xtline DXR if date>=td(23oct2024) & ///
 date<=td(5aug2025) ///
 & imfcode!=111 & DXR!=. & DXR!=0 ///
 & emg==1, yline(0) ///
overlay title("Emerging Countries") ///
note("Data from the Bank for International Settlements")
graph rename emg2F, replace
graph export emg2F.png, as(png) width(4000) replace

lgraph DXR date if date>=td(23oct2024) & ///
 date<=td(5aug2025) ///
 & imfcode!=111 & DXR!=. & DXR!=0, ///
 yline(0) xlab(,angle(90)) xline(23686) ///
 xti("") ti("Exchange Rate Depreciation") ///
 note("Data from the Bank for International Settlements" ///
 "Average for an intial sample of 73 currency pairs." ///
 "US, missing and fixed echange rates excluded.")

save dailyXR8aug.dta, replace

log close _all
exit

**# End of Program