“Data! Data! Data! He cried impatiently. I can’t make bricks without clay.”
Arthur Conan Doyle
The Adventure of the Copper Beeches – a Sherlock Holmes Short Story
Last week, I show the importance of visualizing data to my Master’s students in International Trade and Marketing Export when you start a research work or want to answer a question with data. We can add to this quote from a Sherlock Holmes adventure that we also need to visualize the data to theorize and establish testable assumptions.
Jonathan A. Schwabish, 2014. “An Economist’s Guide to Visualizing Data,” Journal of Economic Perspectives, American Economic Association, vol. 28(1), pages 209-234, Winter. https://www.aeaweb.org/articles?id=10.1257/jep.28.1.209.
Two main messages. First message, you need to reduce the clutter. Second message, try to see if each of your visualization choice will help to tell the story you want to tell.
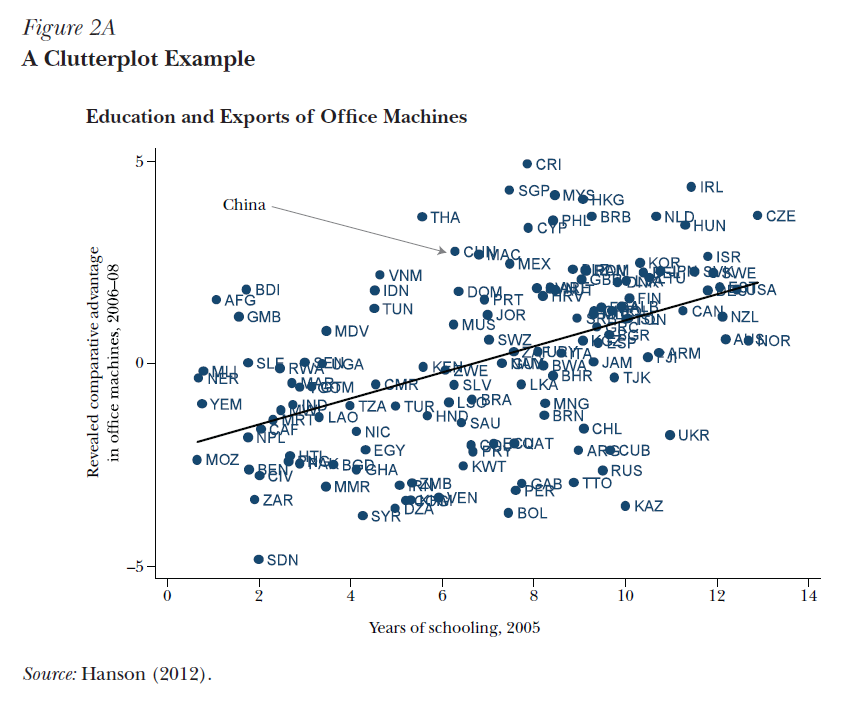
The students liked this figure below:
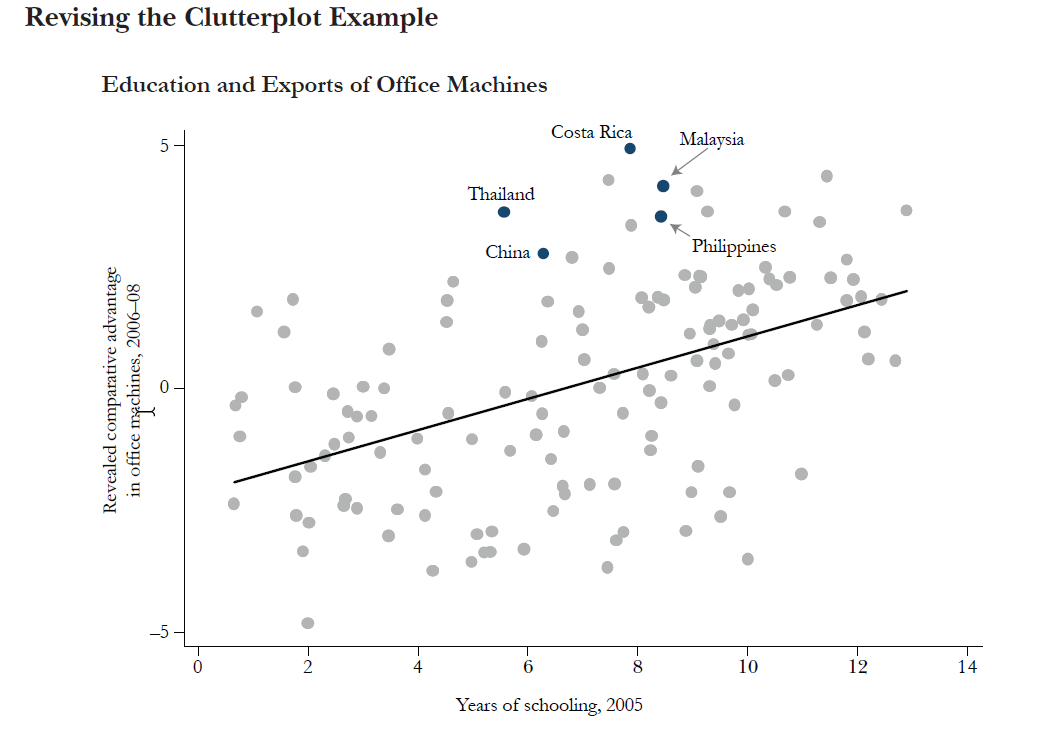
versus this one:
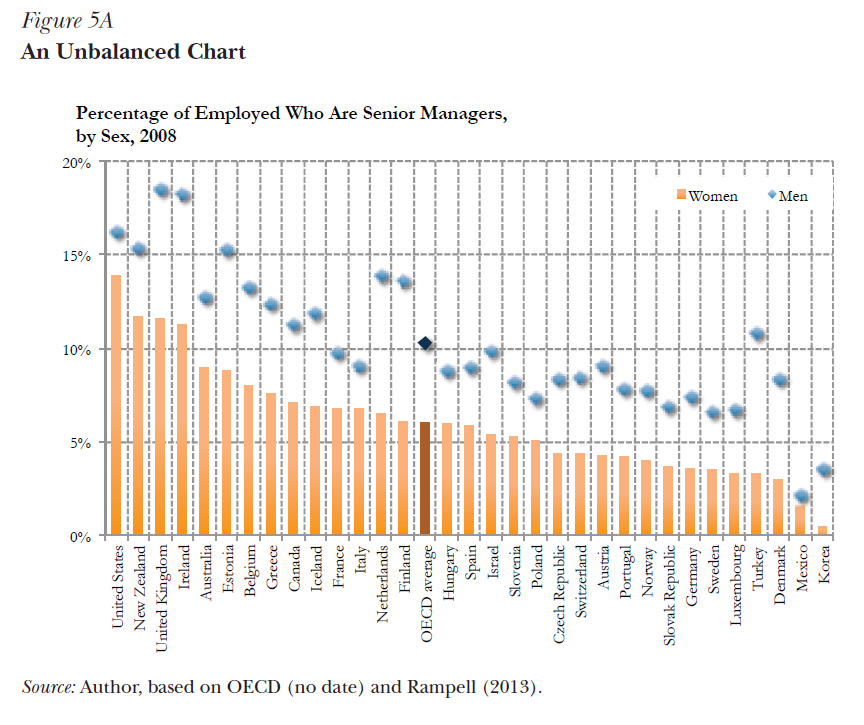
But, not this one:
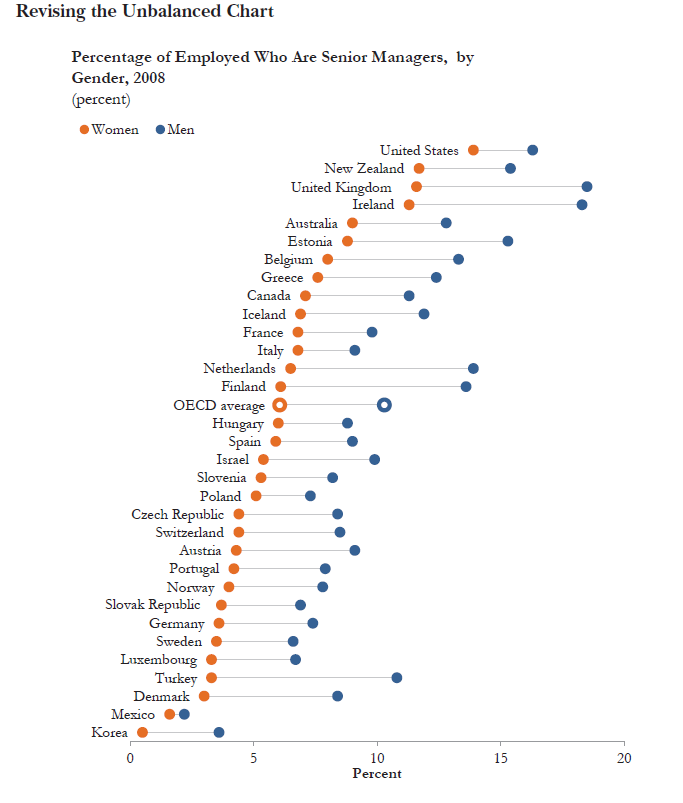
versus this one: