Research effort translates into economic development through institutions that support investment, protect scientific inquiry, and allow new knowledge to diffuse. Political uncertainty can shorten investment horizons, while conflicts over religious authority can restrict the adoption of new ideas. These institutional dimensions help explain why the association between R&D and income varies across economic environments.
Our paper, Do Religious and Political Stability Condition the Returns to R&D? Evidence from OECD Countries, written with Nathan Schild and Patrick Rondé and accepted in Applied Economics, examines this relationship using a panel of 23 OECD members and accession candidates over 1998–2018.
The central finding is that the association between R&D intensity and GDP per capita strengthens with government and religious stability. Religious stability provides the most consistent evidence across specifications, including those examining labor productivity, patents, and income growth.
Publication details · Earlier working-paper version (PDF) · EconMacro Research Briefs
Why institutions shape the returns to research
Neo-Schumpeterian growth theory places innovation at the center of productivity improvements. The institutional environment influences the incentives to undertake research and the conditions under which its results become productive. Government stability supports predictable policies and longer planning horizons, which matter particularly for research investments with uncertain and delayed payoffs.
Religious tensions operate through the interaction between scientific knowledge, political authority, and institutions. When discoveries threaten established authority, political and religious elites may have incentives to restrict their diffusion. Historical restrictions on printing illustrate how an available technology can spread slowly when adoption challenges prevailing sources of legitimacy. The paper connects this mechanism to the institutions supporting education, freedom of inquiry, and the productive use of research.
Measuring research effort and institutional stability
The main estimation sample contains 468 country-year observations. Economic development is measured by the logarithm of real GDP per capita in constant 2015 US dollars. R&D intensity is measured by researchers per 100 inhabitants; R&D expenditure as a share of GDP provides an alternative measure.
The two institutional indicators come from the International Country Risk Guide:
- Government stability, scored from 0 to 12, combines government unity, legislative strength, and popular support. It captures the executive’s capacity to sustain its program.
- Religious stability uses the Religious Tensions component, scored from 0 to 6. Higher scores indicate lower risks associated with religious domination, restrictions on religious freedom, and religious conflict.
The religious indicator measures institutional tensions surrounding religion. Religious belief and religious homogeneity are separate concepts. The correlation between the two stability indices is only 0.15, supporting their treatment as distinct institutional dimensions.
Estimating the institutional gradient
The empirical analysis estimates country fixed-effects regressions, first introducing each stability dimension separately. Writing the estimated income-level specification explicitly:
Here, \(y_{it}\) is real GDP per capita, \(r_{it}\) R&D intensity, \(s_{it}\) the relevant stability index, and \(g^{WA}_{it}\) working-age population growth. The controls \(\boldsymbol{Z}_{it}\) include trade openness, consumption and investment shares, fiscal variables, inflation, and unemployment. Standard errors are clustered by country. Additional specifications include year fixed effects and estimate both institutional interactions jointly.
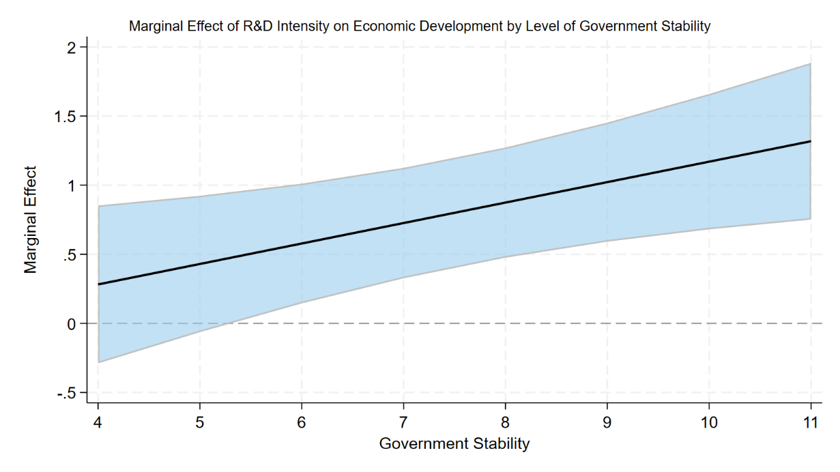
The interaction coefficient determines how the R&D–income association changes with stability. For a one-standard-deviation increase in research intensity, \(\sigma_r=0.176\), the paper reports approximate percentage differences in GDP per capita:
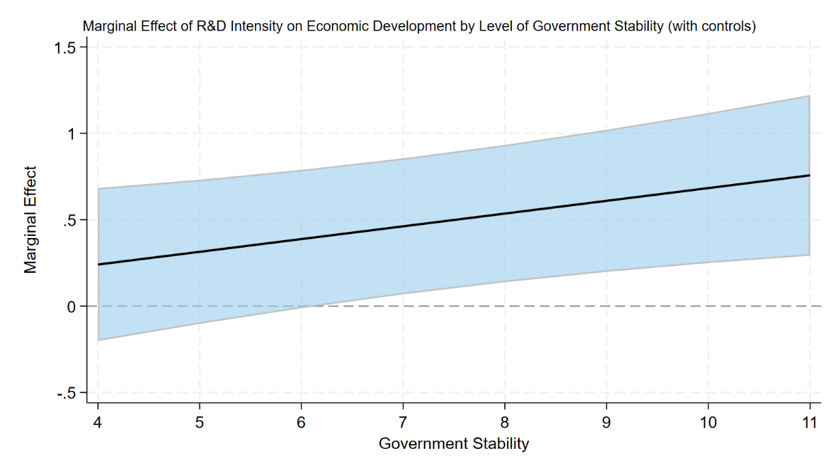
These estimates describe conditional income-level associations. The figures display the marginal slopes \(m(s)\); the percentages discussed below apply the one-standard-deviation scaling in equation (2).
Government stability strengthens an already positive association
At the 10th percentile of government stability, a one-standard-deviation increase in R&D intensity is associated with approximately 7.1% higher GDP per capita. The corresponding association rises to 12.0% at the 90th percentile. Both estimates are statistically significant under conventional country-clustered inference.
Figure 1 shows this upward gradient. The positive association is already present at the reported low-stability evaluation point, and its magnitude increases as governing capacity improves.
Religious stability has the stronger empirical foundation
The religious-stability gradient is more pronounced. At its 10th percentile, a one-standard-deviation increase in R&D intensity is associated with approximately 3.2% higher GDP per capita, an estimate statistically indistinguishable from zero. At the 90th percentile, the association reaches 12.9% and is statistically significant.
The positive interaction with religious stability appears in all fourteen specifications summarized in the paper, with significance at the 5% level in twelve. The evidence includes alternative measures of R&D and income, the V-Dem Freedom of Religion index, labor productivity and patents as outcomes, and a growth equation with lagged income.
The government-stability interaction is supported in the income-level specifications. Its extension to labor productivity, patents, and the growth equation is statistically insignificant. Wild cluster bootstrap inference supports both baseline interaction terms at the 10% level, with p-values of 0.054 for government stability and 0.096 for religious stability.
Two distinct institutional dimensions
When both stability indices and their R&D interactions enter the same regression, both interaction coefficients remain positive. The religious-stability interaction is significant at the 5% level and the government-stability interaction at the 10% level. This joint evidence supports a distinct role for each dimension.
The specification allowing a triple interaction between R&D and the two indices places the largest estimated association where both dimensions are high. With high religious stability, the association remains positive and significant even at low government stability. The triple-interaction coefficient is negative and statistically insignificant, providing no evidence of additional complementarity between the indices. The evidence for religious stability is concentrated between intermediate and high scores, where most sample observations lie.
Two related EconMacro posts
Is R&D intensity stationary? discusses evidence for G7 countries using Fourier unit-root tests that accommodate smooth structural changes. It connects the persistence of research intensity to competing models of innovation-driven growth.
What Does the Religious Tensions Variable in the ICRG database measure? explains the institutional content of the indicator, including religious domination, exclusion, and restrictions on religious freedom. It provides useful context for interpreting the paper’s most robust interaction.
Read the paper
The paper’s contribution is to document how government and religious stability condition the relationship between research effort and economic performance. The stronger evidence for religious stability is consistent with an institutional channel connecting freedom of inquiry and knowledge diffusion to the productive use of R&D. The findings place the institutional environment alongside research resources in the assessment of innovation policy.
Schild, N., Saadaoui, J., and Rondé, P. (2026). Do Religious and Political Stability Condition the Returns to R&D? Evidence from OECD Countries. Applied Economics, accepted.
An earlier version is available as BETA Working Paper 2026-04 under the title Neo-Schumpeterian Growth: Political and Religious Stability Matter. The results and figures presented here follow the revised manuscript of 14 November 2026.
Selected references
Aghion, P., and Howitt, P. (1992). A model of growth through creative destruction. Econometrica, 60(2), 323–351.
Bisin, A., Rubin, J., Seror, A., and Verdier, T. (2024). Culture, institutions and the long divergence. Journal of Economic Growth, 29(1), 1–40.
Herzer, D. (2022). Semi-endogenous versus Schumpeterian growth models: A critical review of the literature and new evidence. Review of Economics, 73(1), 1–55.