Allow me to share a small update about work, I found an easy way to plot the impulse response function using the beta release of RATS 11, and its online help for the GRAPH instruction. I will show how to draw the following graph below:
The code looks like this:
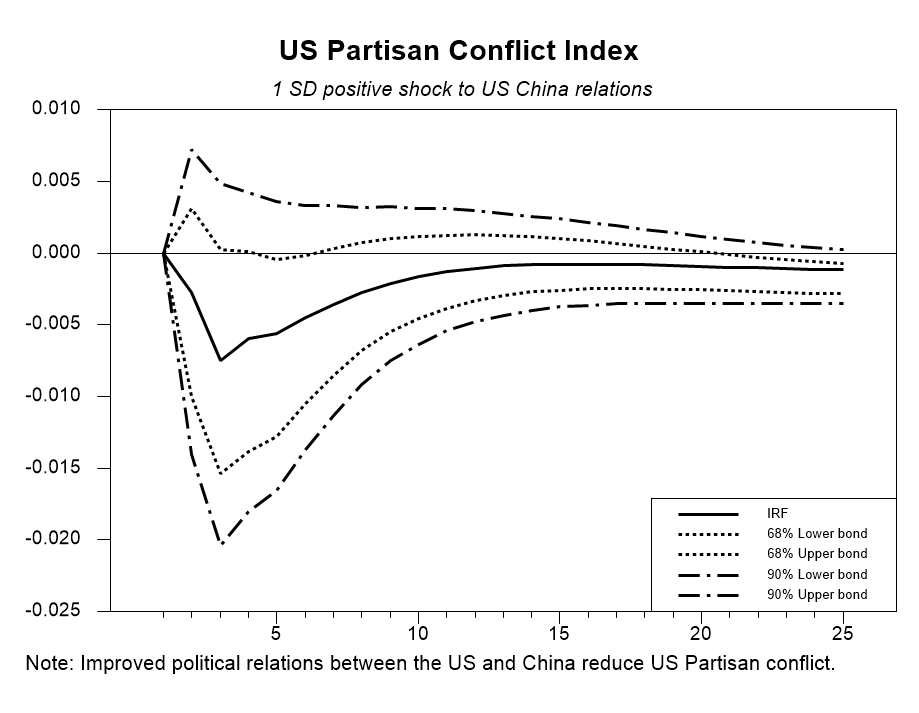
GRAPH(STYLE=LINE,WIDTH=7,HEIGHT=5,PATTERNS, SUBHEADER=" 1 SD positive shock to US China relations", $
 HEADER="US Partisan Conflict Index", KHEIGHT=0.5, KWIDTH=0.5, $
 key=LORIGHT,NODATES,klabels=||"IRF","68% Lower bond",$
 "68% Upper bond","90% Lower bond","90% Upper bond"||,$
 FOOTER="Note: Improved political relations between the US and China reduce US Partisan conflict.") 5
# IRFE1(1,1) 1 25
# IRFE1(2,1) 1 25 2
# IRFE1(3,1) 1 25 2
# IRFE1(4,1) 1 25 4
# IRFE1(5,1) 1 25 4
An improvement in the relation between the US and China, concerning trade tariffs for example, reduces the partisan conflict between Democrats and Republicans.
For the other variables in the system:
Not so difficult to do! Remarks and comments are welcome. The ACCUMULATE instruction is very helpful. The full code is below:
GRAPH(STYLE=LINE,WIDTH=7,HEIGHT=5,PATTERNS, SUBHEADER=" 1 SD positive shock to US China relations", $
HEADER="US Partisan Conflict Index", KHEIGHT=0.5, KWIDTH=0.5, $
key=LORIGHT,NODATES,klabels=||"IRF","68% Lower bond",$
"68% Upper bond","90% Lower bond","90% Upper bond"||,$
FOOTER="Note: Improved political relations between the US and China reduce US Partisan conflict.") 5
# IRFE1(1,1) 1 25
# IRFE1(2,1) 1 25 2
# IRFE1(3,1) 1 25 2
# IRFE1(4,1) 1 25 4
# IRFE1(5,1) 1 25 4
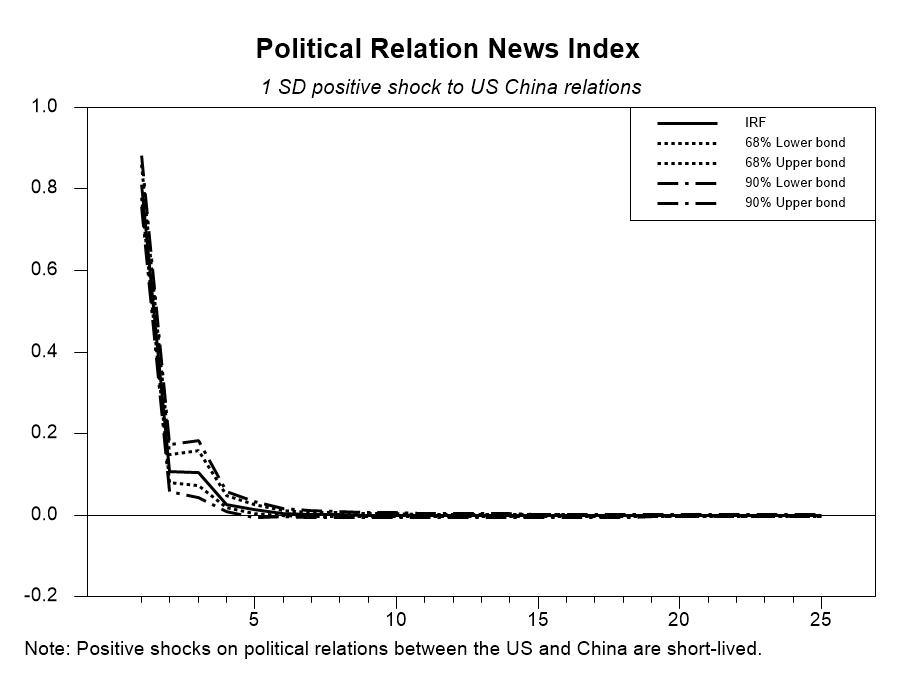
GRAPH(STYLE=LINE,WIDTH=7,HEIGHT=5,PATTERNS, SUBHEADER=" 1 SD positive shock to US China relations", $
HEADER="Political Relation News Index", KHEIGHT=0.5, KWIDTH=0.5, $
key=UPRIGHT,NODATES,klabels=||"IRF","68% Lower bond",$
"68% Upper bond","90% Lower bond","90% Upper bond"||,$
FOOTER="Note: Positive shocks on political relations between the US and China are short-lived.") 5
# IRFE1(1,2) 1 25
# IRFE1(2,2) 1 25 2
# IRFE1(3,2) 1 25 2
# IRFE1(4,2) 1 25 4
# IRFE1(5,2) 1 25 4
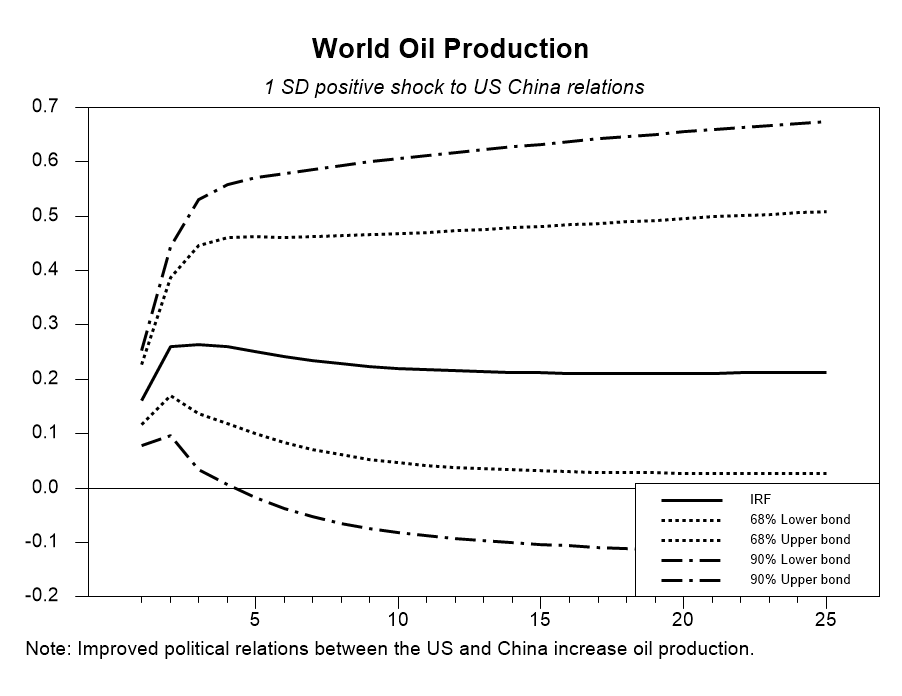
accumulate IRFE1(1,3) 1 25 CIRFE113
accumulate IRFE1(2,3) 1 25 CIRFE123
accumulate IRFE1(3,3) 1 25 CIRFE133
accumulate IRFE1(4,3) 1 25 CIRFE143
accumulate IRFE1(5,3) 1 25 CIRFE153
GRAPH(STYLE=LINE,WIDTH=7,HEIGHT=5,PATTERNS, SUBHEADER=" 1 SD positive shock to US China relations", $
HEADER="World Oil Production", KHEIGHT=0.5, KWIDTH=0.5, $
key=LORIGHT,NODATES,klabels=||"IRF","68% Lower bond",$
"68% Upper bond","90% Lower bond","90% Upper bond"||,$
FOOTER="Note: Improved political relations between the US and China increase oil production.") 5
# CIRFE113 1 25
# CIRFE123 1 25 2
# CIRFE133 1 25 2
# CIRFE143 1 25 4
# CIRFE153 1 25 4
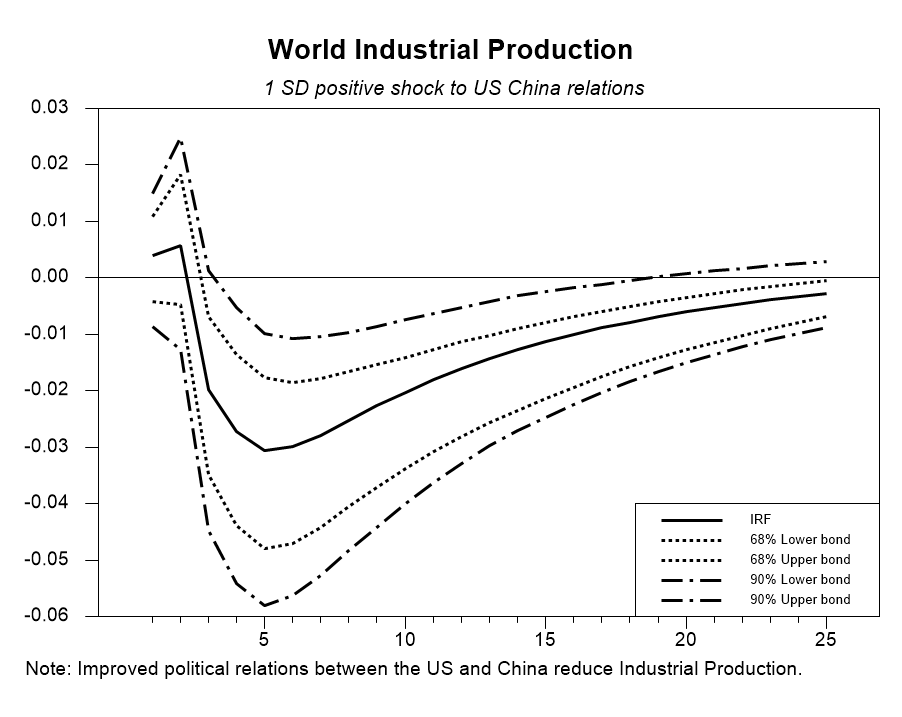
GRAPH(STYLE=LINE,WIDTH=7,HEIGHT=5,PATTERNS, SUBHEADER=" 1 SD positive shock to US China relations", $
HEADER="World Industrial Production", KHEIGHT=0.5, KWIDTH=0.5, $
key=LORIGHT,NODATES,klabels=||"IRF","68% Lower bond",$
"68% Upper bond","90% Lower bond","90% Upper bond"||,$
FOOTER="Note: Improved political relations between the US and China reduce Industrial Production.") 5
# IRFE1(1,4) 1 25
# IRFE1(2,4) 1 25 2
# IRFE1(3,4) 1 25 2
# IRFE1(4,4) 1 25 4
# IRFE1(5,4) 1 25 4
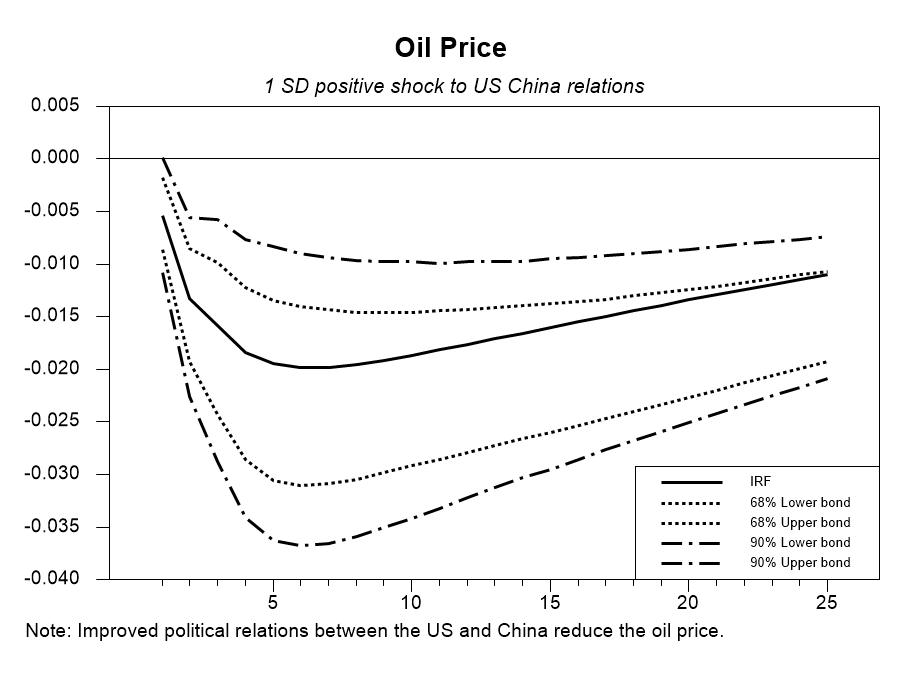
GRAPH(STYLE=LINE,WIDTH=7,HEIGHT=5,PATTERNS, SUBHEADER=" 1 SD positive shock to US China relations", $
HEADER="Oil Price", KHEIGHT=0.5, KWIDTH=0.5, $
key=LORIGHT,NODATES,klabels=||"IRF","68% Lower bond",$
"68% Upper bond","90% Lower bond","90% Upper bond"||,$
FOOTER="Note: Improved political relations between the US and China reduce the oil price.") 5
# IRFE1(1,5) 1 25
# IRFE1(2,5) 1 25 2
# IRFE1(3,5) 1 25 2
# IRFE1(4,5) 1 25 4
# IRFE1(5,5) 1 25 4You are welcome to download, share, or comment on the following working paper:
- Cai, Y., Saadaoui, J., & Uddin, G. S. (2024). US Partisan Conflict, Sino-US Political Relation News, and Oil Market Dynamics. Available at SSRN 4868418.