In this blog, we will see how to use Stata and Python to download daily gold prices in USD. I will rely on a series of blogs showing how to use Dbnomics: https://www.jamelsaadaoui.com/tag/dbnomics/. This time, we use the dbnomics package to import the data maintained by the London Bullion Market (https://db.nomics.world/LBMA/gold_D).
Key takeaways:
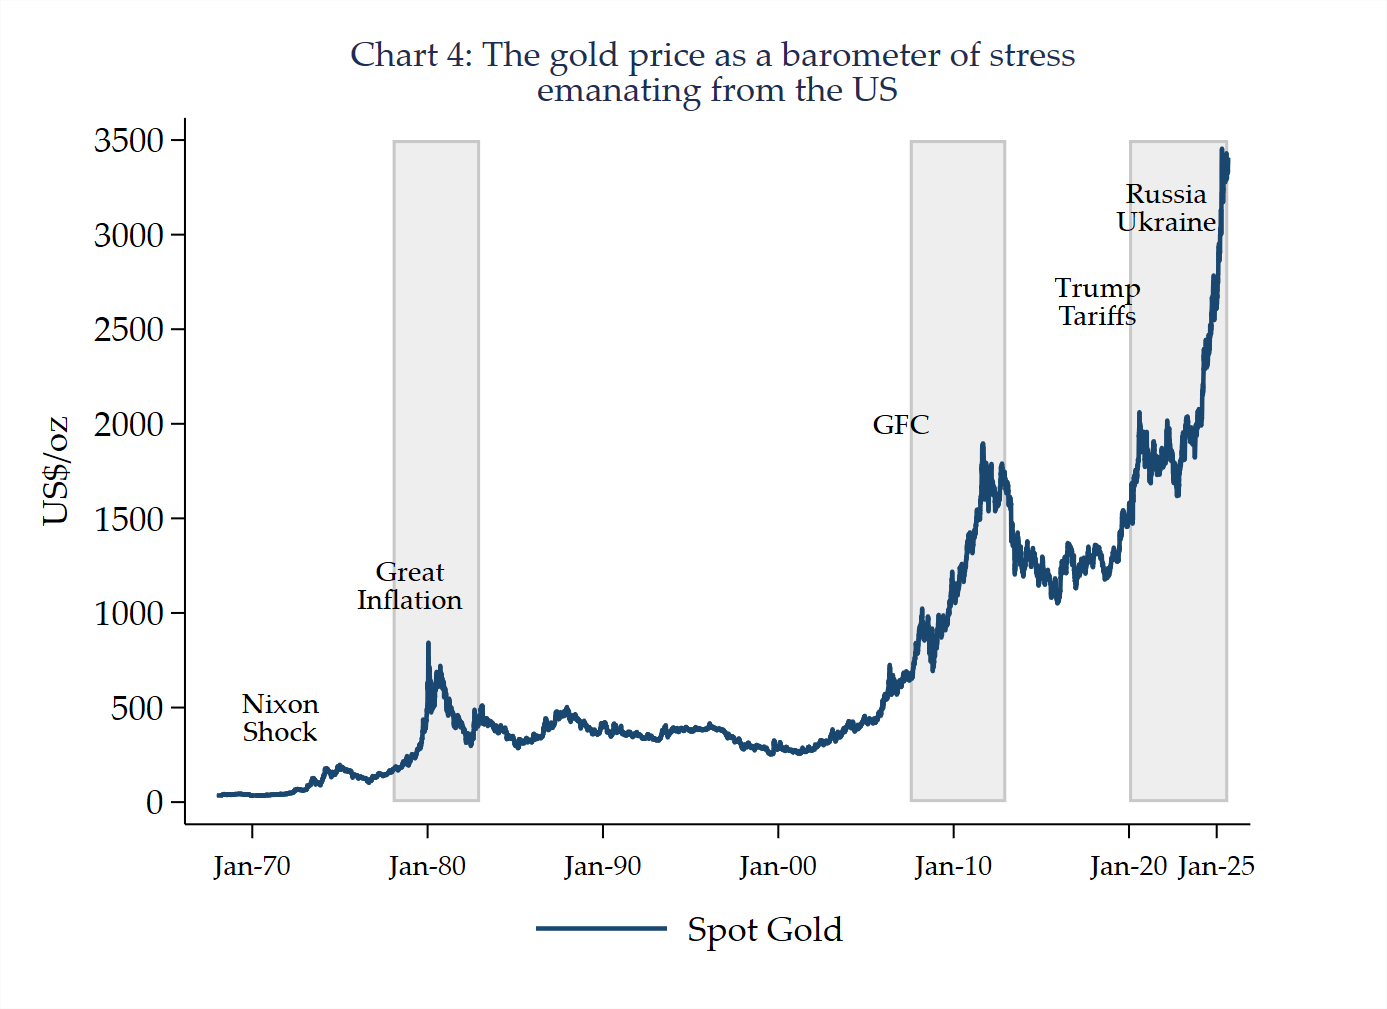
- Gold reflects geopolitical and economic stress. Periods such as the Nixon Shock, the Great Inflation, the Global Financial Crisis, and recent trade and geopolitical tensions all coincide with sharp increases in the gold price.
- Safe-haven demand dominates in crises. When confidence in US monetary or financial stability weakens, investors tend to flock to gold, pushing its price sharply higher.
- Different shocks produce similar reactions. Whether the trigger is monetary turmoil (1970s), financial instability (2008–09), or geopolitical conflict (Ukraine), the pattern of surging gold prices remains consistent.
- Long calm spells contrast with sudden spikes. Between major crises, gold often trades sideways for years, but each major disruption produces a visible step-up in the long-term price path.
- Gold remains a global “barometer” of US-led stress. Despite changes in the international monetary system, gold continues to act as a universal signal of risk aversion when events emanating from the US shake the global economy.
We are going to replicate Chart 4 of the following blog, The International Monetary System and the Canary in the Goldmine written by Jennifer Johnson-Calari:
The shortened code is commented at each step below:
***# Python

// Python version with the API on the DBnomics (select columns) and create the exel file

python:
import dbnomics as db
api_link = ("https://api.db.nomics.world/v22/series/LBMA/gold_D?dimensions=%7B%22unit%22%3A%5B%22USD%22%5D%2C%22time%22%3A%5B%22AM%22%5D%7D&facets=1&format=json&limit=1000&observations=1")

df = db.fetch_series_by_api_link(api_link, max_nb_series=10000)
df.to_excel("GoldDRodger.xlsx", index=False)
end

**# Use Stata to read the dataset

import excel GoldDRodger.xlsx, firstrow clear

// Keep the interesting dataset

drop frequency provider_code dataset_code ///
 dataset_name series_code series_name original_period

// Rename the Gold variable
rename value Gold_USD_Price

// Label the variable
label variable Gold_USD_Price ///
 "Gold Price in US dollars per fine troy ounce"
* Explained here: https://www.lbma.org.uk/prices-and-data/precious-metal-prices#/prices-explained

// Create the date variable
display td(02jan1968)
display td(28aug2025)
gen td = dofC(period)
* Explained here: https://www.stata.com/manuals/fndateandtimefunctions.pdf
format td %td
tsset td

* 3) Prep shaded bands & y-limits
quietly summarize Gold_USD_Price, meanonly
scalar ytop = ceil(r(max)/100)*100
scalar ybot = 0

cap gen double y0 = ybot
cap gen double yM = ytop

cap gen byte band_greatinfl = ///
 inrange(td, td(01jan1978), td(31dec1982))
cap gen byte band_gfc = ///
 inrange(td, td(01jul2007), td(31dec2012))
cap gen byte band_2020s = ///
 inrange(td, td(01jan2020), td(28aug2025))

* 4) Event dates (arrows + labels)
local nixon     = td(15aug1971)
local greatinfl = td(01jan1979)
local gfc       = td(15sep2008)
local russia    = td(24feb2022)
local tariffs   = td(22mar2018)

* 5) Draw chart (line + bands + bottom labels) — PUB MARGINS

* y-positions for arrows & labels
local yb   = `=ybot'
local yt   = `=ytop'
local yhi  = `=ybot + 650'
local ylo  = `=ybot +  80'
local ytx  = `=ybot + 120'

* x-axis tick positions
local x70  = `=td(01jan1970)'
local x80  = `=td(01jan1980)'
local x90  = `=td(01jan1990)'
local x00  = `=td(01jan2000)'
local x10  = `=td(01jan2010)'
local x20  = `=td(01jan2020)'
local x25  = `=td(01jan2025)'

* tidy the top label to nearest 500
local ylabtop = `=ceil(`yt'/500)*500'

twoway ///
    rarea y0 yM td if band_greatinfl, ///
        color(gs12%35) lcolor(gray) || ///
    rarea y0 yM td if band_gfc, ///
        color(gs12%35) lcolor(gray) || ///
    rarea y0 yM td if band_2020s, ///
        color(gs12%35) lcolor(gray) || ///
    line Gold_USD_Price td, ///
        lwidth(medthick) lcolor(navy) ///
    , ///
    title("Chart 4: The gold price as a barometer of stress " ///
          "emanating from the US", size(medsmall)) ///
    ytitle("US$/oz") xti("") ///
    ylabel(0(500) `ylabtop', angle(0) nogrid) ///
    xlabel(`x70' "Jan-70" `x80' "Jan-80" `x90' "Jan-90" ///
           `x00' "Jan-00" `x10' "Jan-10" `x20' "Jan-20" ///
		   `x25' "Jan-25", ///
           angle(0) labsize(small)) ///
    legend(order(4 "Spot Gold") pos(6) ring(1) ///
           region(lstyle(none))) ///
    yscale(range(`yb' `yt')) ///
    scheme(s2color) ///
    graphregion(margin(r+10) ///
                color(white)) ///
    plotregion(margin(l+1)) ///
    text(300  `nixon'     "Nixon" "Shock", ///
         place(n) just(c) box bcolor(white%0) s(small)) ///
    text(1000 `greatinfl' "Great" "Inflation", ///
         place(n) just(c) box bcolor(white%0) s(small)) ///
    text(2000 `gfc'       "GFC", ///
         place(w) just(c) box bcolor(white%0) s(small)) ///
    text(3000 `russia'   "Russia" "Ukraine", ///
         place(n) just(c) box bcolor(white%0) s(small)) ///
    text(2500 `tariffs'   "Trump" "Tariffs", ///
         place(n) just(c) box bcolor(white%0) s(small))
Conclusion
The Gold Price Historical Path indicates that, quite contrary to being ancient history, gold remains a staunch marker of economic and geopolitical distress. All big disruptions emanating from the United States—monetary dislocations, financial crises, trade, and security tensions—have made their presence felt in the gold market. Where the wider financial system has changed, investors’ propensity to flee to the safe haven of gold is surprisingly resilient. It confirms the long-term position of gold as a commodity, but as well a world measure of uncertainty and risk in the world economy.
Further reading
Johnson-Calari, J. (2025, August 19). The International Monetary System and the Canary in the Goldmine. World Gold Council. Retrieved from https://www.gold.org/goldhub/gold-focus/2025/08/international-monetary-system-and-canary-goldmine