In this blog, I update a previous blog of mine using an orthogonalized version of the religious tension variable coming from the international country risk guide (ICRG). Orthogonalization may be useful to partially deal with endogeneity:
I also made a recent blog to clarify what this variable measures. This measure is not perfect but seems good enough to replicate the rise in religious tensions in France and in the Netherlands, for example:
First, you have to set the folder, load the data, and generate the series for the shocks. The shock will be the change in the ND-GAINS vulnerability variable in our case:
////////////////////////////////////////////////////////////////

**# Set the directory

cd "C:\Users\jamel\Dropbox\Latex\PROJECTS"
cd "24-03-emft-adb-private\estimates"

**# Import data

use emft-adb-new-v3.dta, clear

xtset imfcode period
xtdes
des
sum

gen vul100 =100*vul
gen Dvul100=D.vul100
Then, orthogonalize the religious tensions variable using the bond yields and check the reverse causality. I use the first difference of the bond to deal with the possible non-stationarity of the bond yields:
////////////////////////////////////////////////////////////////
**# Orthogonalize Religious Tensions

reg reltensions bonds_tw imfcode, robust
capture drop residuals_lrel
predict residuals_lrel, residuals

areg residuals_lrel L(1/5).D.bonds_tw, a(imfcode) robust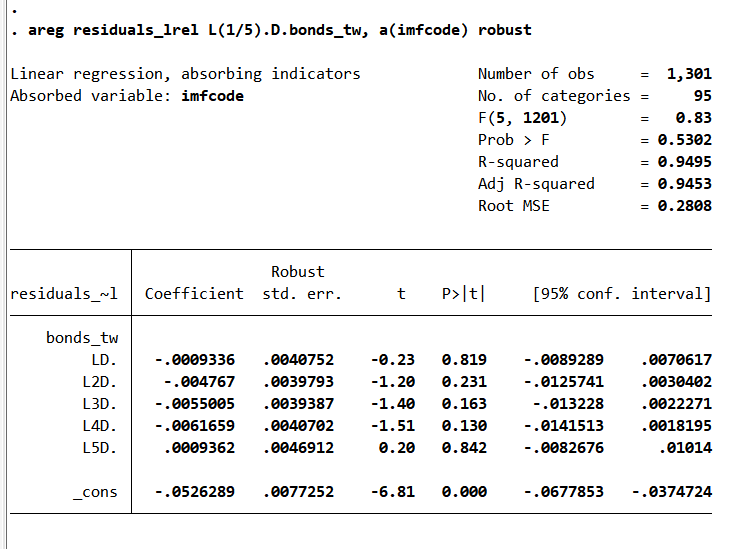
Now, I estimate the State-dependent Local Projections with the orthogonalized religious tensions as the state-dependent variable and change in the ND GAIND vulnerability score is the shock:
////////////////////////////////////////////////////////////////

**# Panel SLP - impact of change in vulnerability on bond yields (Religious Tensions Orthogonalized)

egen reltensions_p10 = pctile(residuals_lrel), p(10)

sum residuals_lrel, detail

cap drop D3
gen D3 = 0
replace D3 = 1 if l.residuals_lrel<l.reltensions_p10

locproj bonds_tw D3#c.Dvul100, lcs(1.D3#c.Dvul100) ///
 h(5) yl(1) sl(2) ///
 c(f(1/5).Dvul100 i.period) ///
 fe cluster(imfcode) conf(90) ///
 title(`"High Religious Tensions"') ///
 save irfname(belowbr) zero noisily stats
graph rename Graph belowbr, replace

locproj bonds_tw D3#c.Dvul100, lcs(0.D3#c.Dvul100) ///
 h(5) yl(1) sl(2) ///
 c(f(1/5).Dvul100 i.period) ///
 fe cluster(imfcode) conf(90) ///
 title(`"Low Religious Tensions"') ///
 save irfname(highbr) zero
graph rename Graph highbr, replace
The plot for the impulse responses will be obtained with lpgraph:
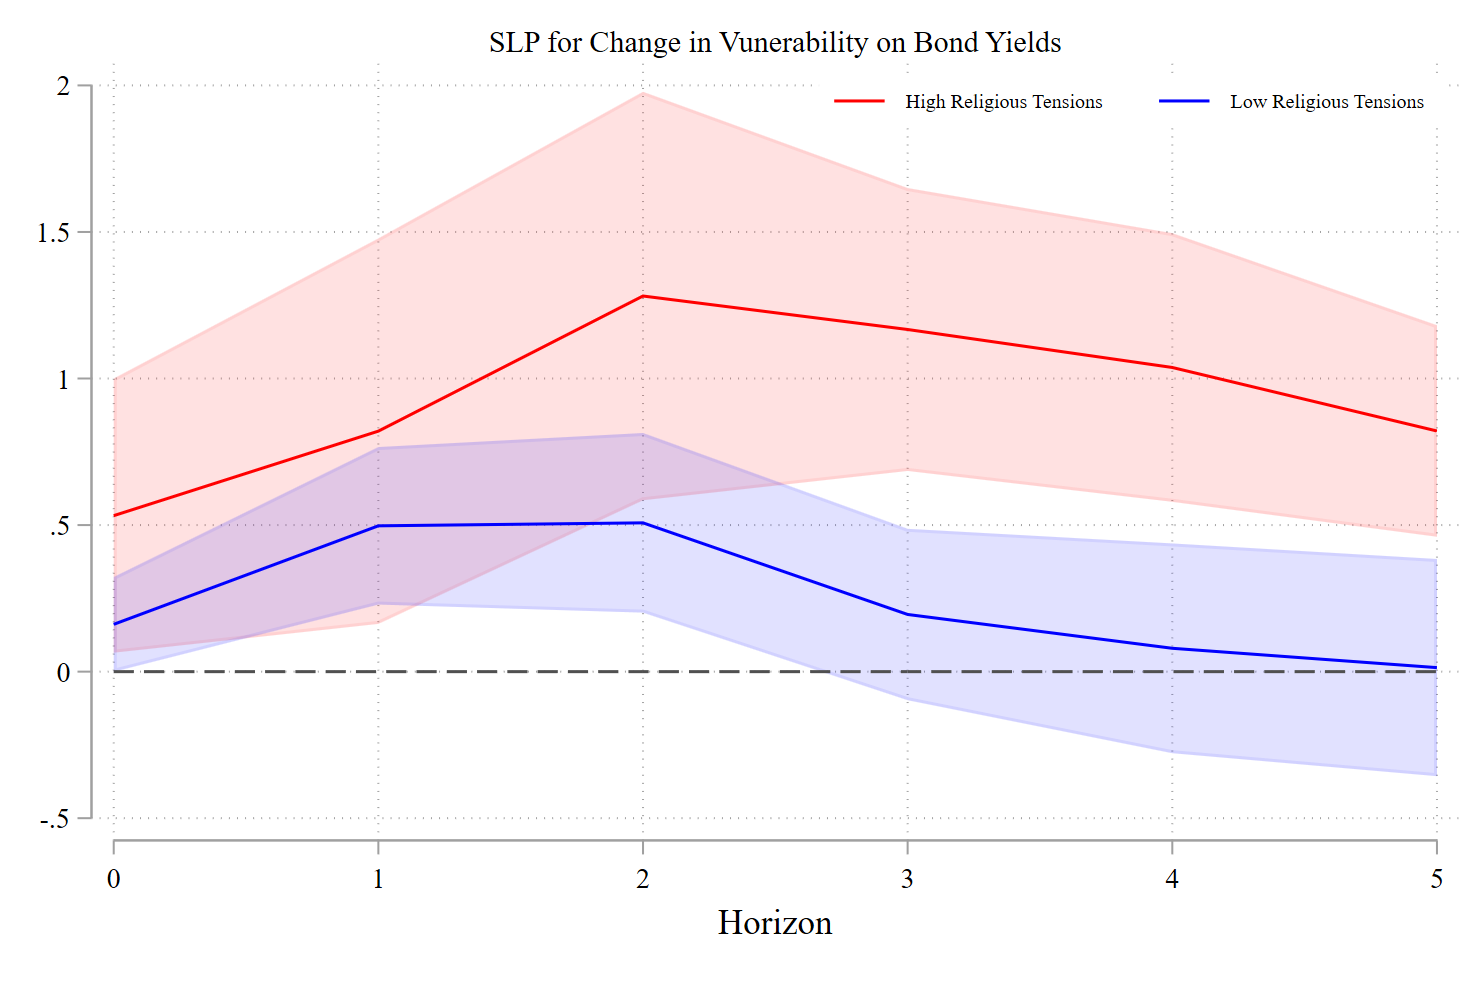
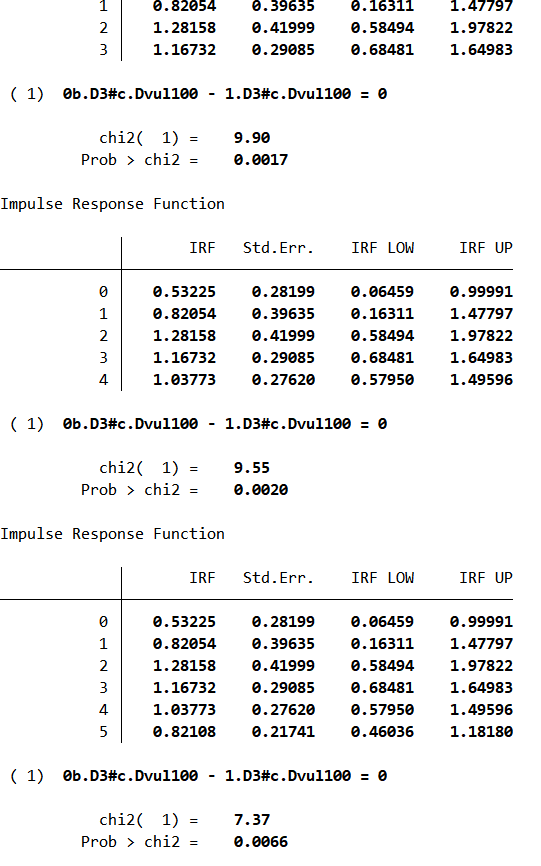
Finally, I test the equality between states:
////////////////////////////////////////////////////////////////

**# Wald Test Between Test

forvalues v = 0(1)5{

locproj bonds_tw D3#c.Dvul100, lcs(1.D3#c.Dvul100) ///
 h(`v') yl(1) sl(2) ///
 c(f(1/5).Dvul100 i.period) ///
 fe cluster(imfcode) conf(90) ///
 title(`"High Religious Tensions"') nograph

test (_b[0.D3#c.Dvul100] = ///
 _b[1.D3#c.Dvul100])

}

////////////////////////////////////////////////////////////////