Today, I will build on my two previous blogs to show you how to use an alternative projection for the maps. Indeed, you need a projection when you want to represent a sphere, a 3-D object, into a Cartesian plan. The Mercator projection solves this mathematical problem at the cost of having increasing distortion in function of the distance to the equator:
(Step A) We will download the files to build the map on the following website:
https://www.naturalearthdata.com/
**#******** Download the map files *****************************
/*
https://www.statalist.org/forums/forum/general-stata-discussion/general/1438858-shp2dta-error-invalid-dbase-data-type
*/
/*
Download the maps:
*https://www.naturalearthdata.com/downloads/10m-cultural-vectors/
*/
/*
https://www.naturalearthdata.com/http//www.naturalearthdata.com/
download/10m/cultural/ne_10m_admin_0_countries.zip
*/
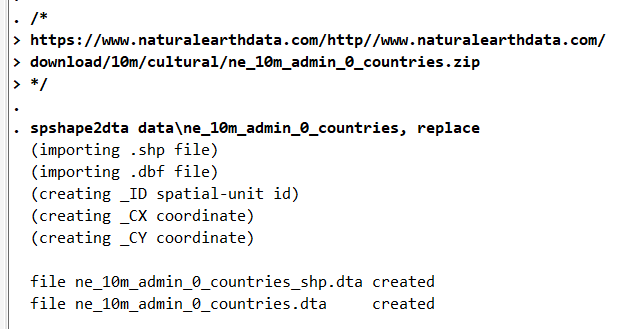
spshape2dta data\ne_10m_admin_0_countries, replace
use ne_10m_admin_0_countries.dta, replace
generate LPOP = ln(POP_EST)
generate POP = POP_EST/1000000
format LPOP %4.2f
order _ID LPOP REGION_UN, first
sum POP_EST, detail
sum LPOP, detail
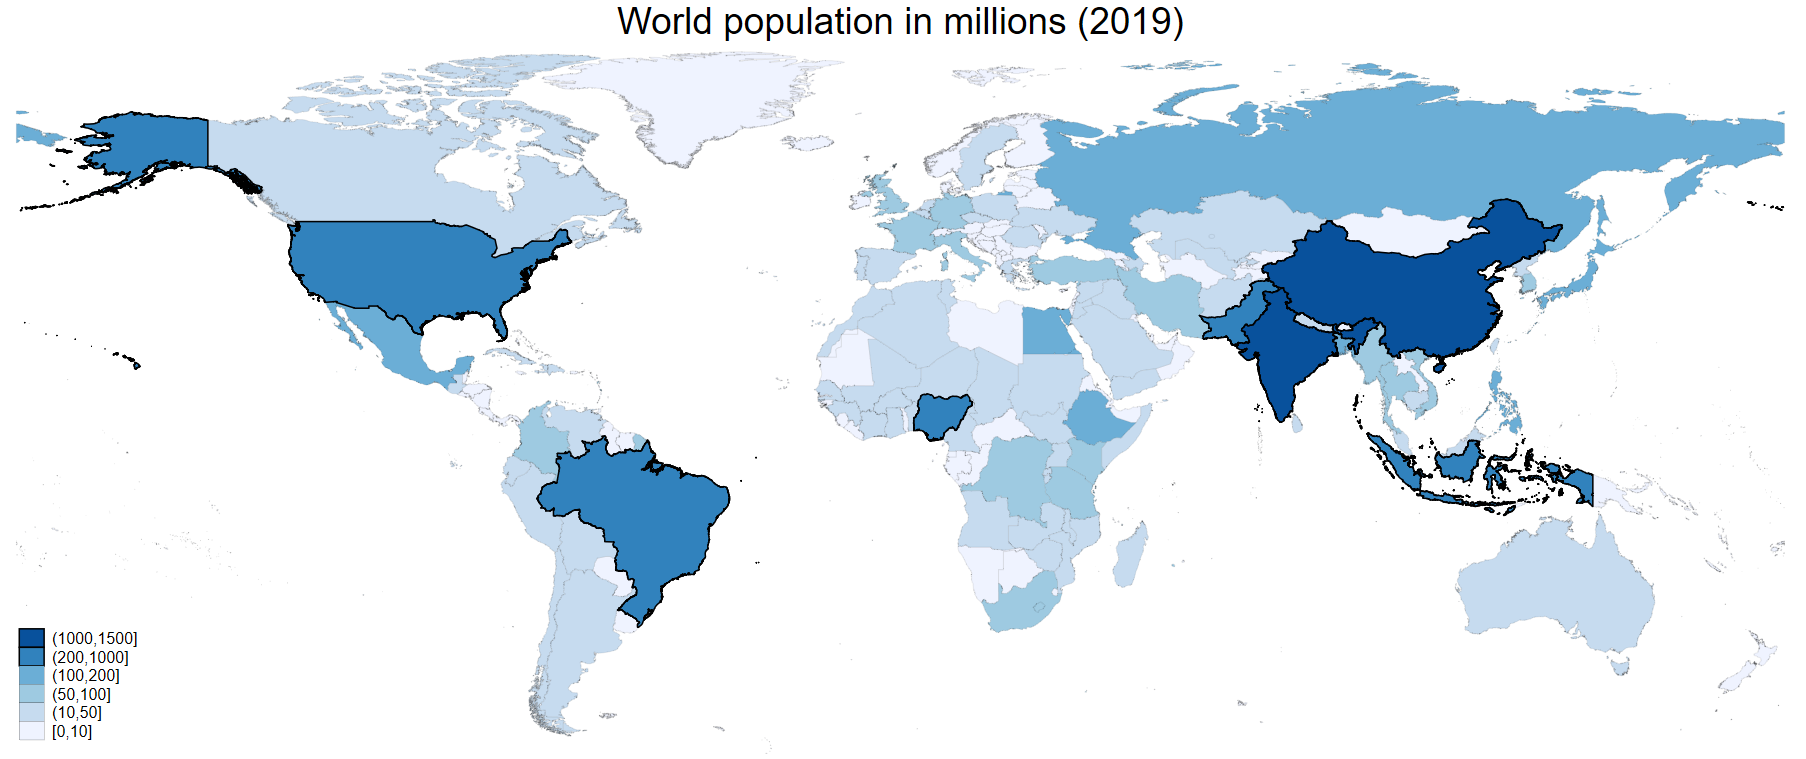
grmap, activate
grmap POP using ne_10m_admin_0_countries_shp.dta ///
if ADMIN!="Antarctica", id(_ID) ///
fcolor(Blues) ///
osize(vvthin vvthin vvthin vvthin) ///
ndsize(vvthin) ///
ndfcolor(gray) clmethod(custom) ///
clbreaks(0 10 50 100 200 1000 1500) ///
title("World population in millions (2019)")
The spshape2dta package will build the file necessary to draw the maps:
We draw a first map of the world population in log:
(Step B) I convert the codes from ISO 3 codes (https://www.iso.org/) to IFS codes (https://www.imf.org/) to merge the data in the next step:
**#******** Generate country codes *****************************
kountry ADM0_A3, from(iso3c) to(imfn)
rename _IMFN_ IFScode
order IFScode ADM0_A3, first
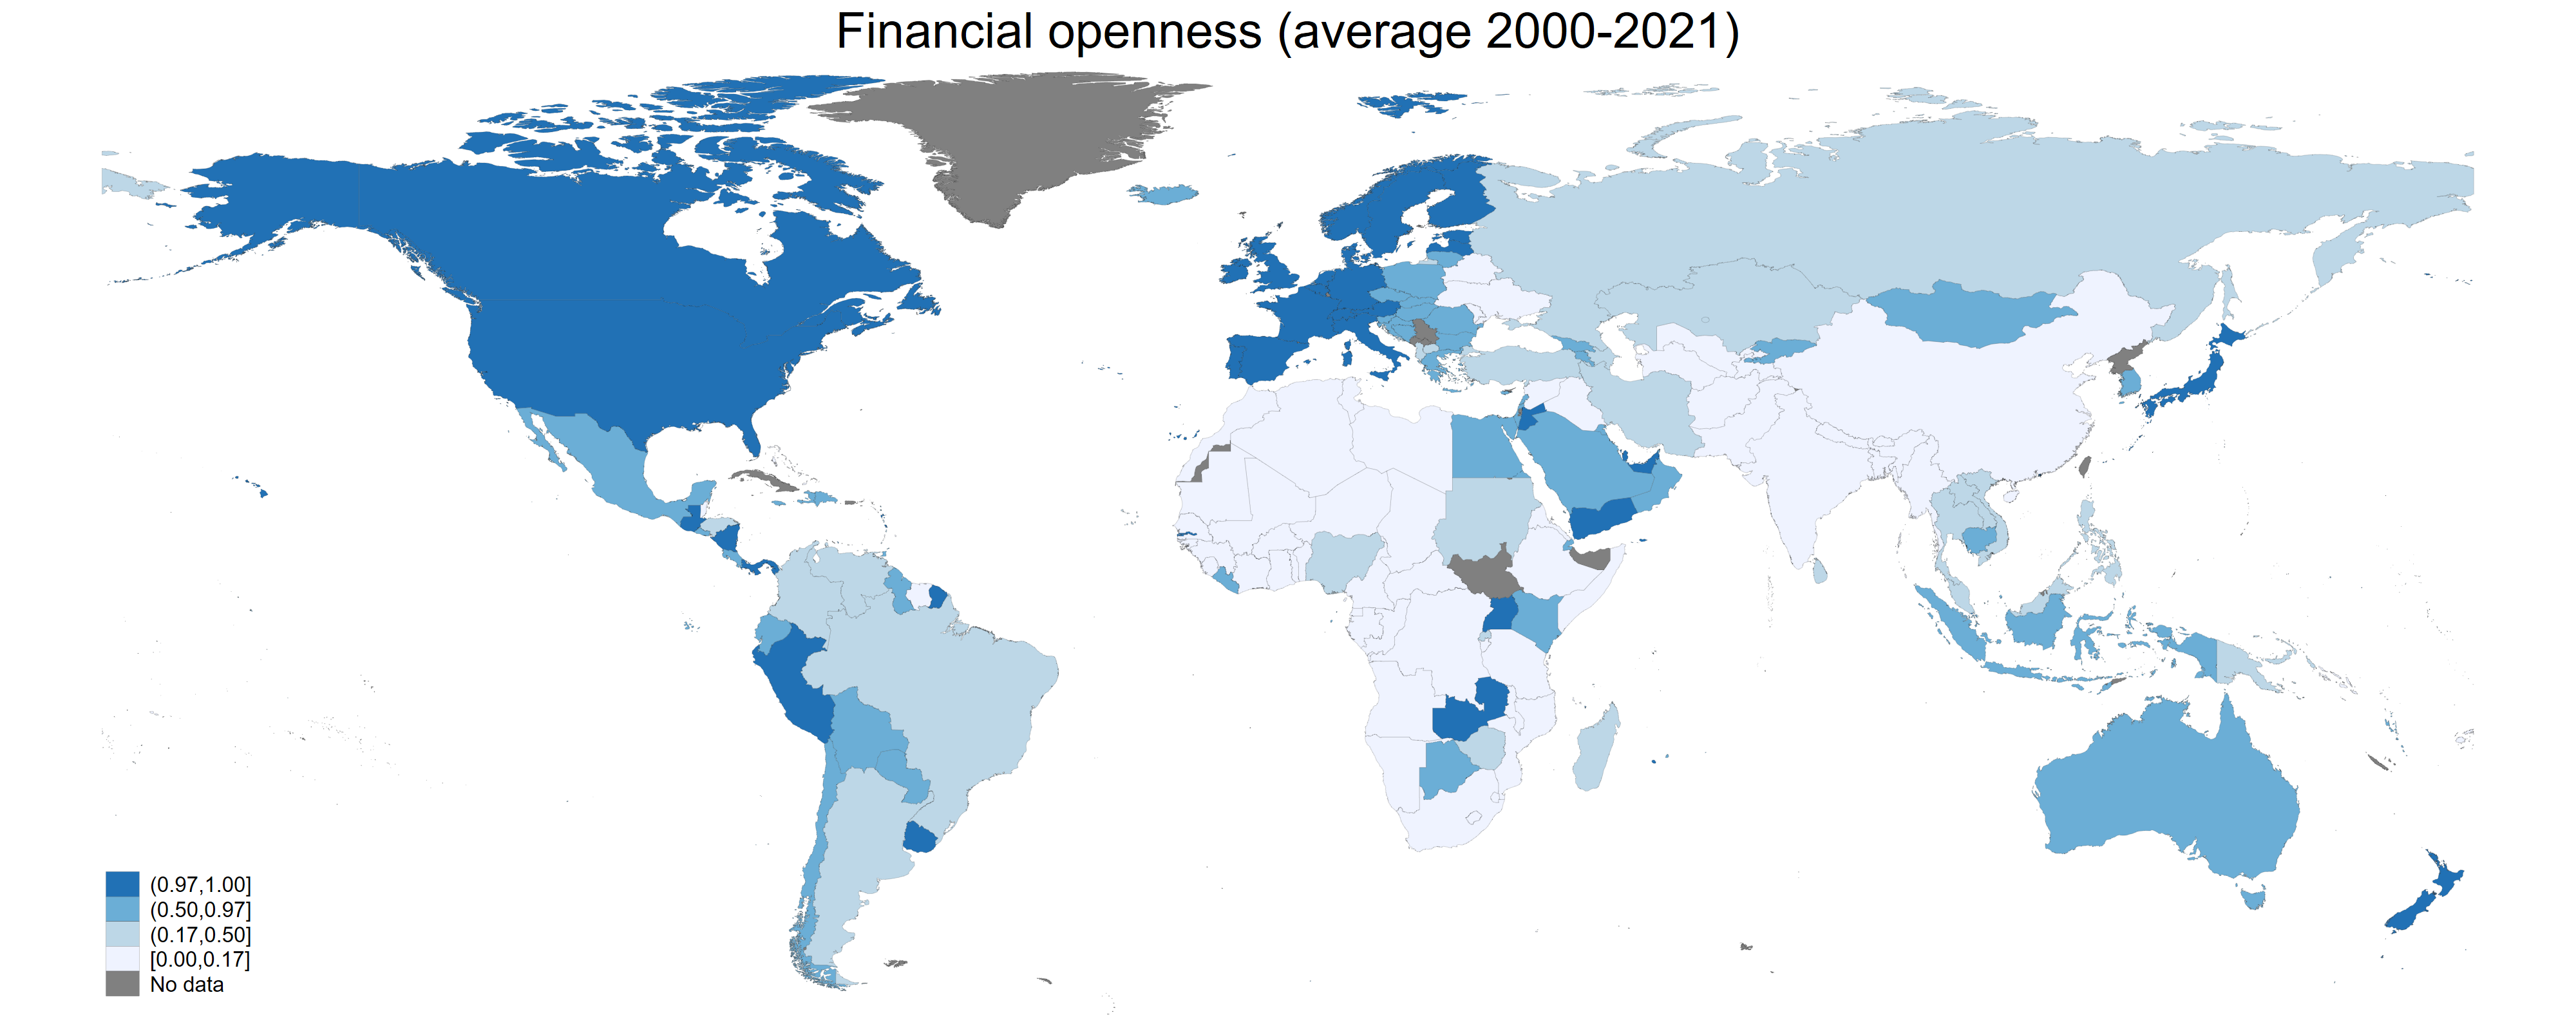
save data\maps_again2.dta, replace(Step C) I use the financial openness index built by Menzie Chinn and Hiro Ito (https://web.pdx.edu/) to generate average financial openness for the period 2000-2021:
**#****** Generate Average Financial openness ******************

use data\kaopen_2021.dta, clear

rename cn IFScode

keep if year>=2000

by IFScode: egen mean_ka_open=mean(ka_open)

keep if year==2021

save data\kaopen_again.dta, replace
(Step D) I draw maps for financial openness at the world level and for some regions:
**#****** Merge and draw the Maps ******************************
use data\maps_again2.dta, clear
duplicates list IFScode
*drop if IFScode==.
merge m:1 IFScode using data\kaopen_again.dta, nogenerate
format mean_ka_open %12.2f
// World
spmap mean_ka_open using ne_10m_admin_0_countries_shp.dta ///
if ADMIN!="Antarctica", id(_ID) ///
fcolor(Blues) osize(vvthin vvthin vvthin vvthin) ///
ndsize(vvthin) ///
ndfcolor(gray) clmethod(custom) ///
clbreaks(0 0.17 0.5 0.97 1) ///
title("Financial openness (average 2000-2021)")
graph rename Graph map_ka_open_world, replace
graph export figures\map_ka_open_world.png, as(png) ///
width(4000) replace
graph export figures\map_ka_open_world.pdf, as(pdf) ///
replace
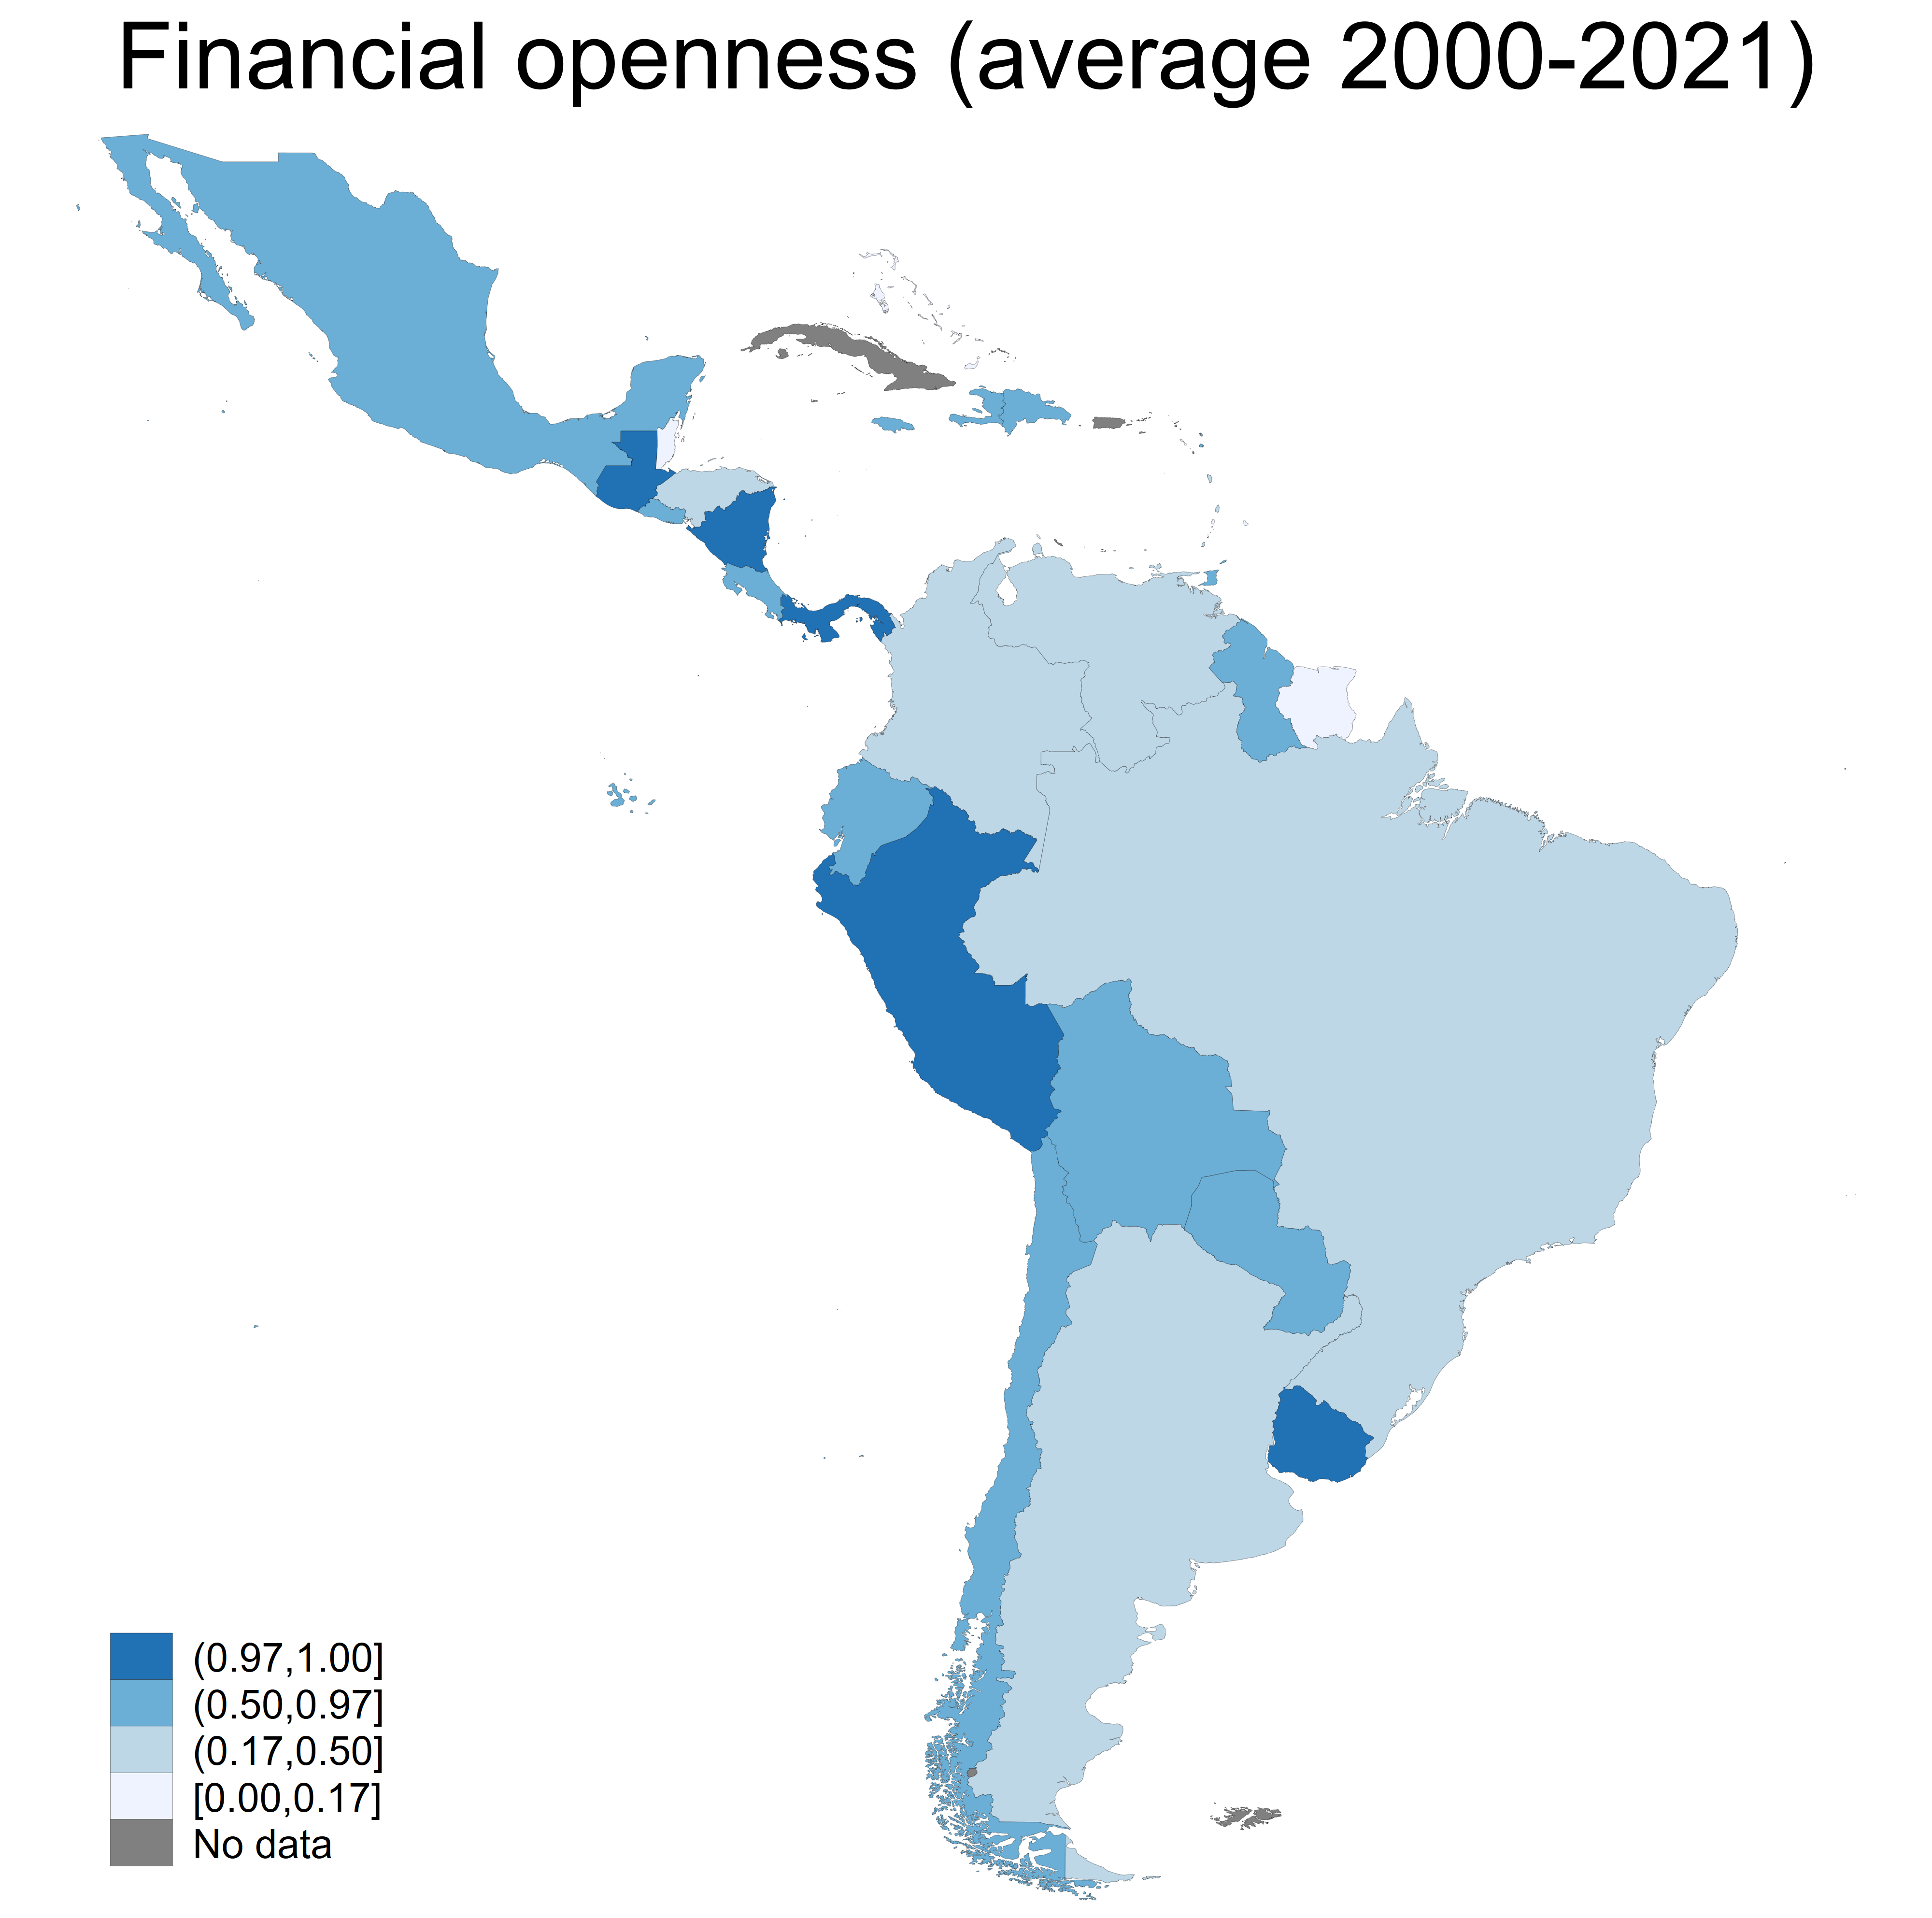
// Latin America & Caribbean
spmap mean_ka_open using ne_10m_admin_0_countries_shp.dta ///
if REGION_WB=="Latin America & Caribbean", id(_ID) ///
fcolor(Blues) osize(vvthin vvthin vvthin vvthin) ///
ndsize(vvthin) ///
ndfcolor(gray) clmethod(custom) ///
clbreaks(0 0.17 0.5 0.97 1) ///
title("Financial openness (average 2000-2021)")
graph rename Graph map_ka_open_latam, replace
graph export figures\map_ka_open_latam.png, as(png) ///
width(4000) replace
graph export figures\map_ka_open_latam.pdf, as(pdf) ///
replace
// Africa
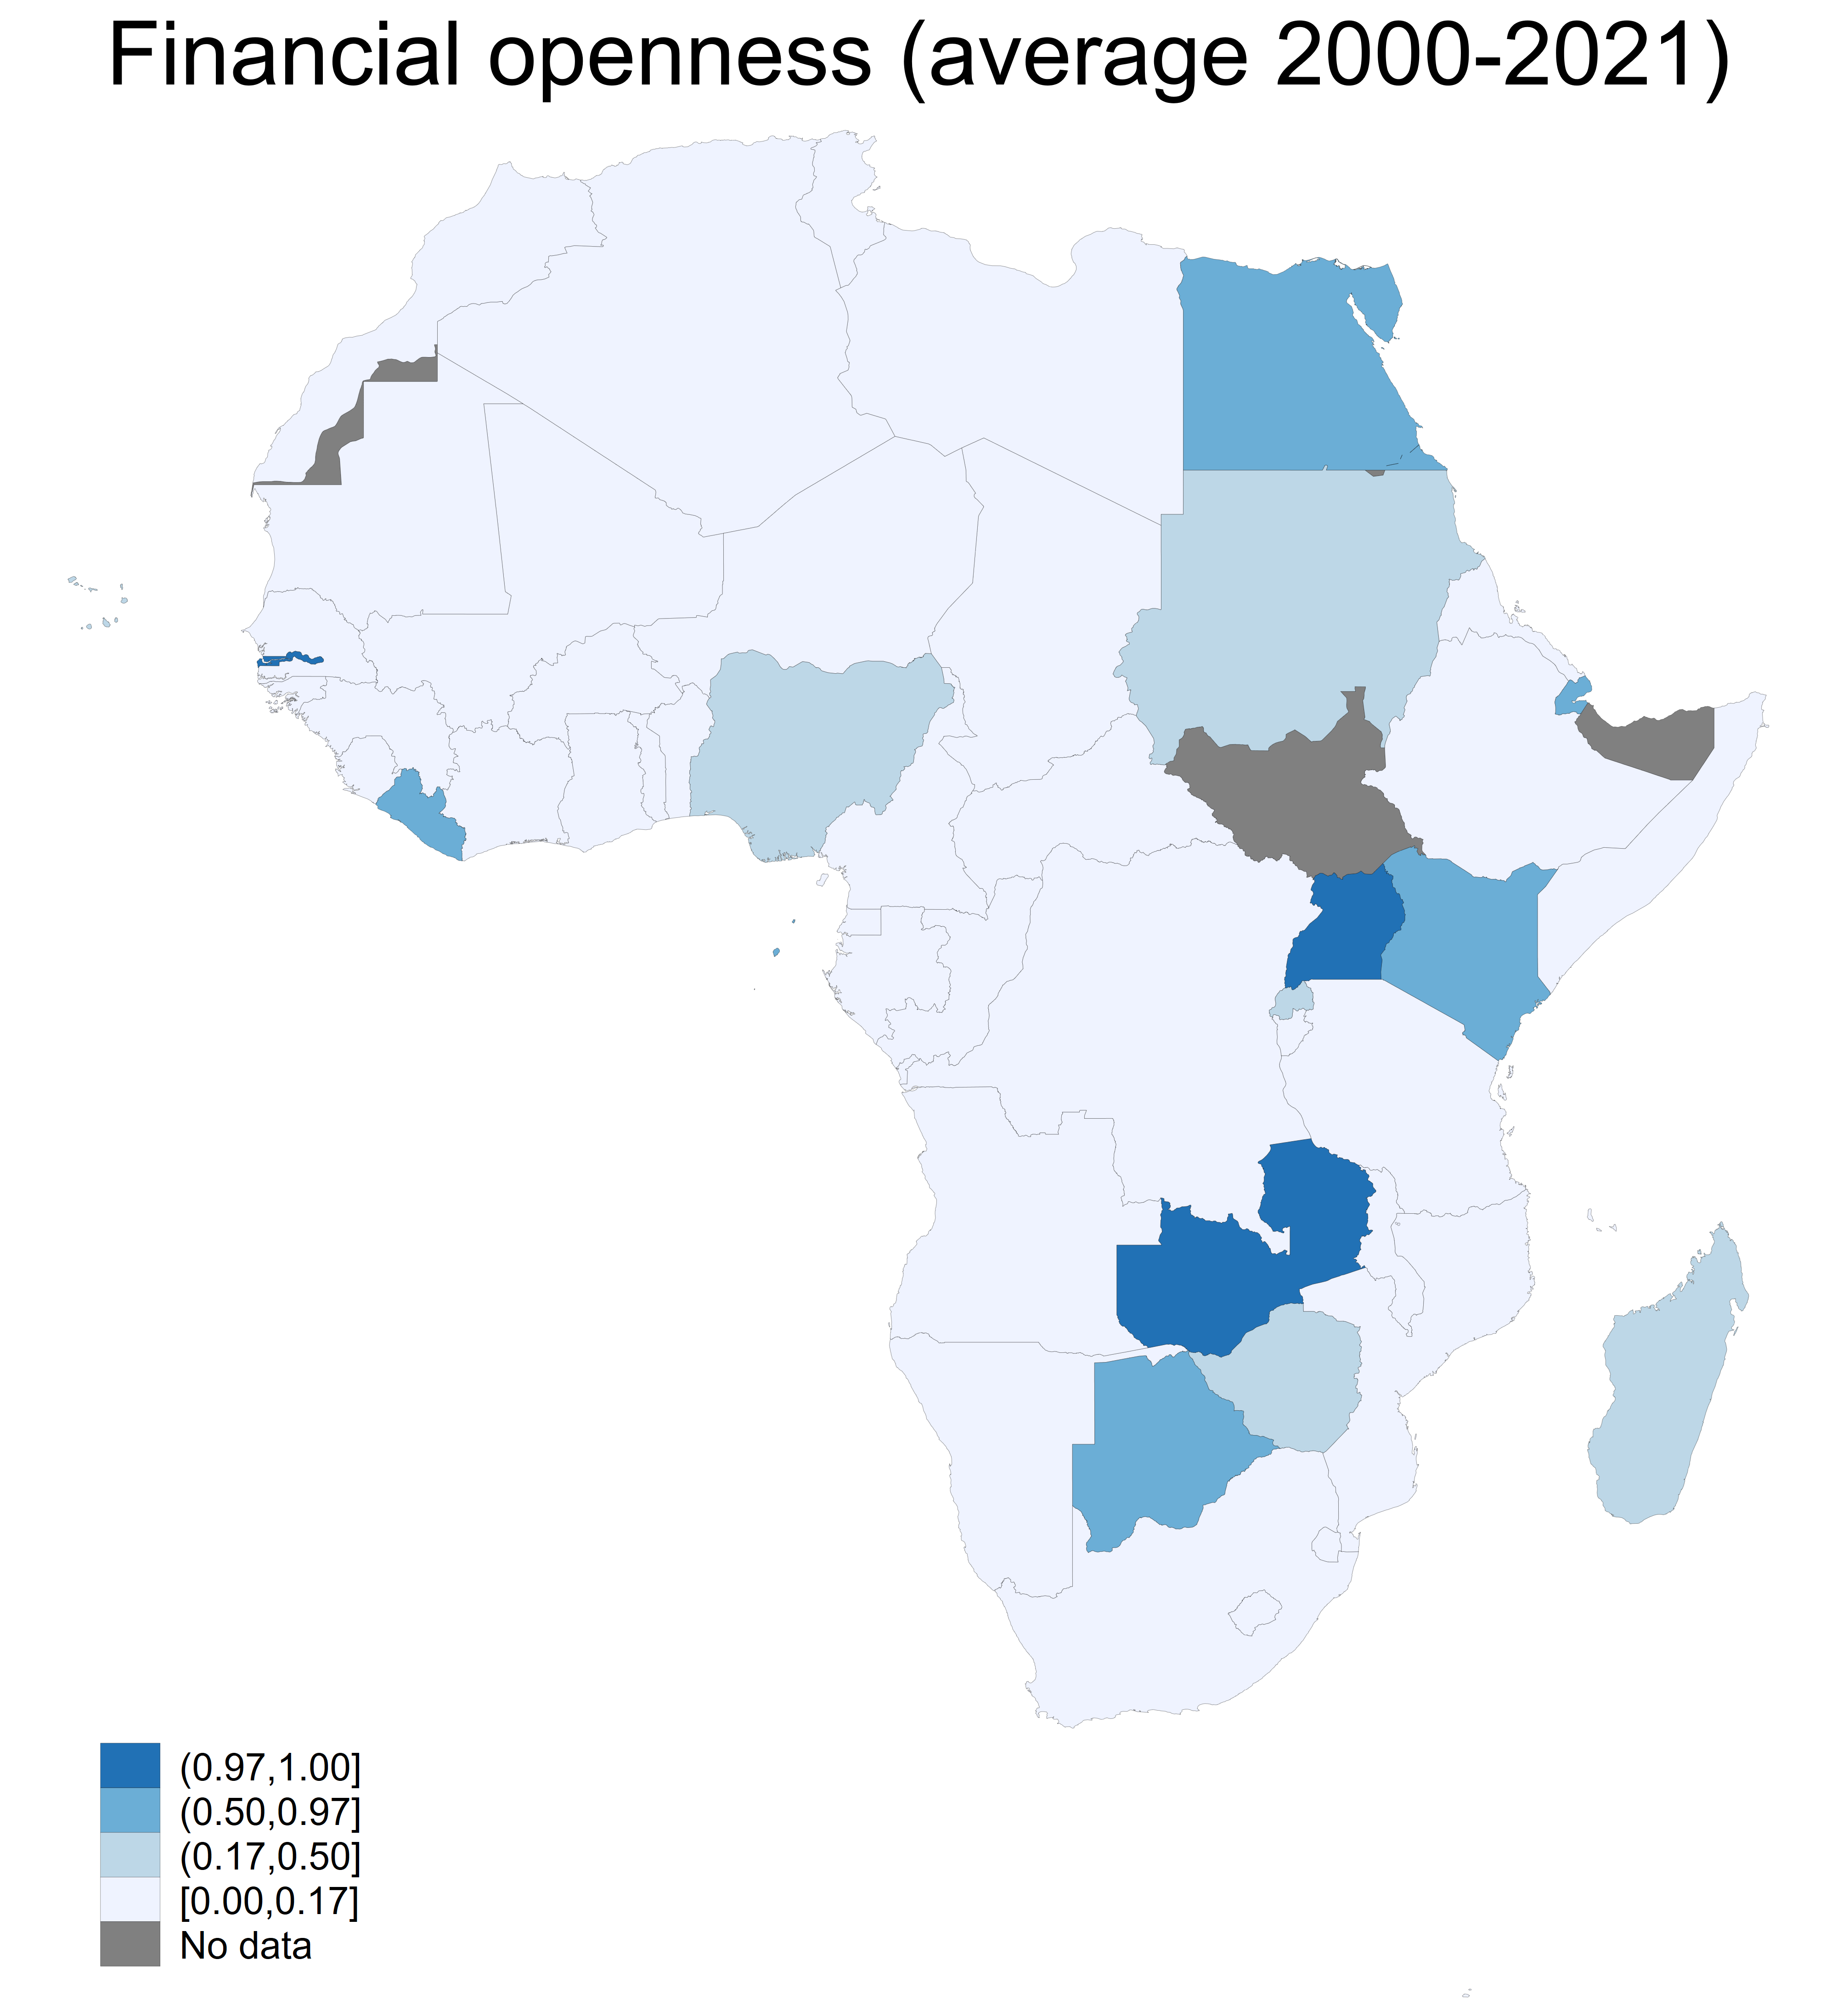
spmap mean_ka_open using ne_10m_admin_0_countries_shp.dta ///
if CONTINENT=="Africa", id(_ID) ///
fcolor(Blues) osize(vvthin vvthin vvthin vvthin) ///
ndsize(vvthin) ///
ndfcolor(gray) clmethod(custom) ///
clbreaks(0 0.17 0.5 0.97 1) ///
title("Financial openness (average 2000-2021)")
graph rename Graph map_ka_open_africa, replace
graph export figures\map_ka_open_africa.png, as(png) ///
width(4000) replace
graph export figures\map_ka_open_africa.pdf, as(pdf) ///
replace
save data\maps_again2_final.dta, replace
****************************************************************
Besides, I can focus on some continents like Latin America or Africa:
As we have seen in this blog, it is possible to draw maps in Stata in four simple steps at different levels. These maps could help you to think about some cross-country correlations. The files for replicating the results in this blog are available on my GitHub.
2 Comments
[…] Drawing Maps with Stata… Again and Again! […]
[…] Drawing Maps with Stata… Again and Again! […]