The numbers are going up not because we are testing more, but because the virus is being transmitted more.
Jennifer Lee (2020).
The case fatality rate (i.e. the number of reported deaths per reported case) could not be a reliable indicator of the severity of the COVID-19 since there are uncertainties about deaths which are not reported and undetected cases.
\text{ CFR } = \frac{ \text{ D } }{ \text{ C } }Where D and C stand for the reported deaths and the detected cases, respectively.
A better metric could be the infection fatality rate (i.e. the number of deaths per infected person). The group of infected persons includes the detected disease (cases) and those with an undetected disease (asymptomatic and not tested groups).
\begin{gathered}
\text{ IFR } = \frac{ \text{ D } }{ \text{ C } + \text{ U } }\\
\text{ IFR } = \text{ CFR }  \times \frac{ \text{ C } }{ \text{ C } + \text{ U } }\\
\text{ IFR } \leq \text{ CFR }
\end{gathered}
Where D, C and U stand for the reported deaths, the detected cases and the undetected cases (asymptomatic and not tested groups), respectively. Theoretically, the IFR is lower than the CFR.
After these reminders, we could move to the main question of this post. Does testing more lead to finding more cases? It could seem obvious but, in fact, it depends on virus circulation. If the virus circulation is high, more testing will result in higher positivity rates and the finding of new cases. If the virus circulation is low, more testing will result in lower positivity rates and new cases will not be found. This rationale is clearly explained in this CNN fact check. In Florida, for example, between May 25, 2020, and July 20, 2020, the number of tests has decreased by 22%, but the positivity rate (i.e. number of positive tests divided by the total number of tests) has increased by 341% meaning that the virus circulation was particularly dynamic during this period.
If the virus circulation is low, more testing will result in lower positivity rates and new cases will not be found.
What about cross-country differences? The hypothesis of a similar virus circulation during a particular point of time for several countries seems to be virtually impossible. In order to check whether more testing leads to finding more cases at the world level, I begin with a scatter plot of cases per million of inhabitants (cumulative) against PCR tests per million of inhabitants (cumulative). The data are available here and the countries with less than 1 million of inhabitants have been removed. I use PCR tests as of July 15, 2020, since they detect antibodies shortly after the infection according to the WHO.
You can download the database used in this post:
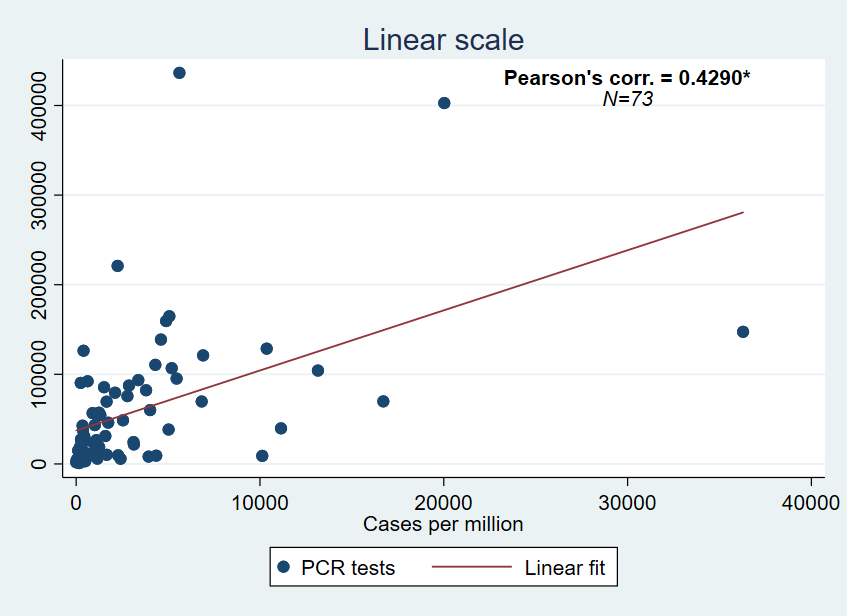
The Pearson’s correlation coefficient is positive and significant at the 1% level (p-value=0.0000). In order to eliminate the influence of potential outliers, I use a logarithmic scale:
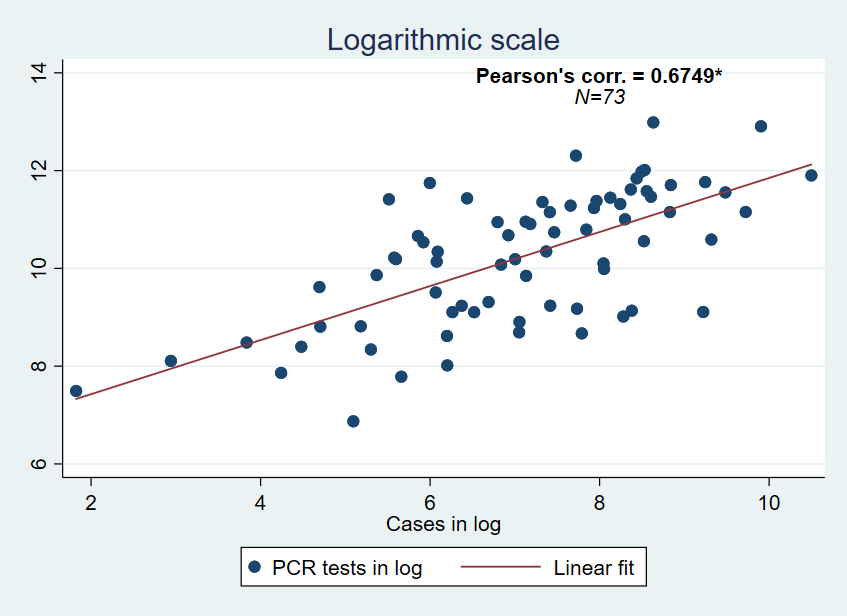
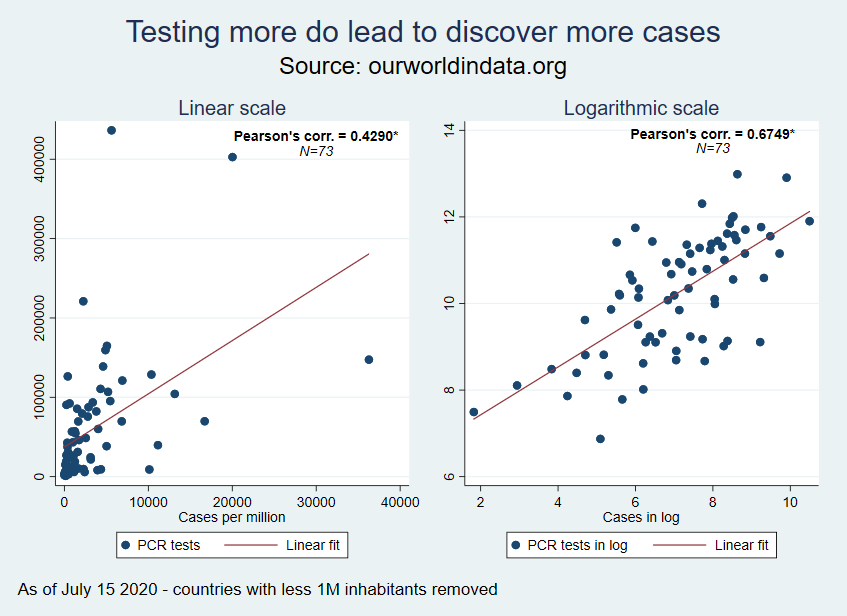
Again, the Pearson’s correlation coefficient is positive and significant at the 1% level (p-value=0.0000). It appears that outliers have no influence in this relationship. We can combine these two previous graphs:
I also run bivariate regressions to investigate these cross-section differences:
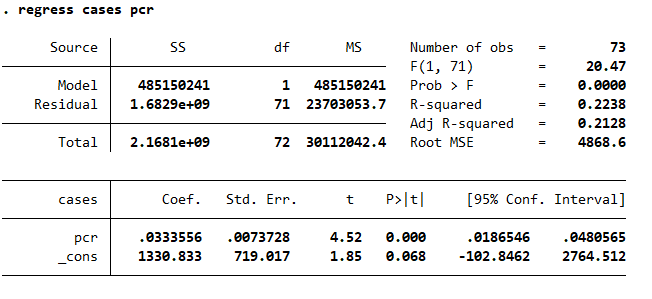
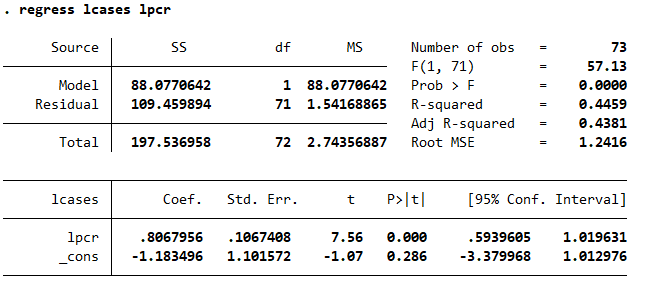
We can safely conclude that countries that tested more found more cases since the beginning of the pandemic. This means that the Case Fatality Rate is lower in countries that tested more. Ceteris paribus.
The STATA code used is reproduced below and was inspired by the LinkedIn course of Franz Buscha:
* Analyzing the correlation between tests and cases
*--------------------------------------------------

version 15.1
set more off
cd "C:\..."           // Set the directory
capture log close
log using covid_testing.smcl, replace

clear

import ///
excel "C:\...\covid-testing-under-1M.xlsx", ///
sheet("Feuil1") cellrange(G1:I74) firstrow  // Note 1

encode G, generate(ISO)

label variable ISO "country"
label variable pcr "Total PCR tests per million people"
label variable cases ///
"Total confirmed cases of COVID-19 per million people"

drop G

order ISO, first

// Pearson's coefficient correlation

pwcorr pcr cases, sig star(.05) obs

gen lpcr = log(pcr)
gen lcases = log(cases)

pwcorr lpcr lcases, sig star(.05) obs

tw (sc pcr cases, title(Linear scale) ///
xtitle(Cases per million)) ///
(lfit pcr cases, legend( label(1 "PCR tests") ///
label(2 "Linear fit") order(1 2)) ///
text(420000 30000 "{bf:Pearson's corr. = 0.43*}" "{it:N=73}")), ///
name(covid_testing, replace)

capture graph export covid_testing.png, replace

label variable lcases "Cases in log"

tw (scatter lpcr lcases, title(Logarithmic scale)) ///
(lfit lpcr lcases, legend(label(1 "PCR tests in log") ///
label(2 "Linear fit") order(1 2)) ///
text(13.75 8 "{bf:Pearson's corr. = 0.67*}" "{it:N=73}")), ///
name(covid_testing_log, replace)

capture graph export covid_testing_log.png, replace

graph combine covid_testing covid_testing_log, ///
title(Testing more do lead to discover more cases) ///
subtitle(Source: ourworldindata.org) ///
note(As of July 15 2020) ///
altshrink ///
name(covid_testing_gathered, replace)

capture graph export covid_testing_gathered.png, replace

// Regression analysis

regress cases pcr

regress lcases lpcr

// Save the data
save ///
"C:\...\covid_testing.dta", ///
replace

log close
exit

Description
-----------

This file aims at exploring cross-section variations
at the world level.

Note :
------
1)  Replace the "..." by the path of the current directory.
2 Comments
Very insightful …. Can you send me some results in finance so that I can also do some research.
Yours Sincerely
Anil Kumar Pandey
Thank you for this comment, you can read my last paper here: https://ssrn.com/abstract=3641306
We try to outline some perspectives for the future of the European Union, despite a highly uncertain context.
Feel free to send me some of your own research!
Best.